At the NEG/Independents Day conference in November 2016, Heidelberg Engineering scanned three real patients from optometrist Peter Waite’s practice, KG Miles in Birmingham. All the patients were scanned live on the big screen using the Spectralis Imaging Platform and were assessed for both retinal disease and glaucoma. A case study is presented below in the first of a three-part series examining each of the patient cases.
Patient history
- A 62-year-old Afro-Caribbean male presents with a history of persistent headaches.
- VA R/L: 6/5, 6/18.
- IOP R/L: 17mmHg, 16mmHg.
- Visual fields full R&L (full threshold).
- Family history: Siblings with glaucoma.
- General health: Suffered blunt trauma on the left side of the back of the head on 15/05/04. He was rendered unconscious and subsequently noticed the reduced left acuity.
- He has had type II diabetes since 2010 (which is diet controlled), hypercholesterolaemia, hypertension and sickle cell trait.
- Medications: atorvastatin and atenolol.
Fundus appearance (figures 1 & 2)
Average-sized discs with no significant asymmetry and no rim notching (figures 1 and 2). There is evidence of macular pucker in the left eye consistent with an epiretinal membrane and microaneurysms at the fovea, indicating mild non-proliferative retinopathy (figure 2).
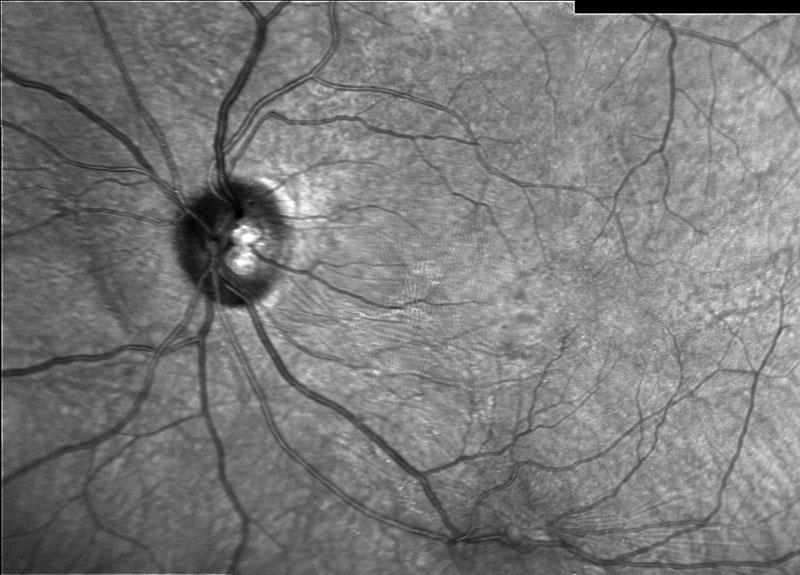
Figure 2: Infrared image of the disc and macular in the left eye
OCT Examination of the right eye (figures 3, 4 & 5)
The OCT examination of the right eye (figure 3 and 4) shows a normal retinal and foveal profile, evidence of a hyper-reflective band in the vitreous cavity, consistent with a posterior vitreous detachment (yellow circle) and normal macular thickness (figure 5).
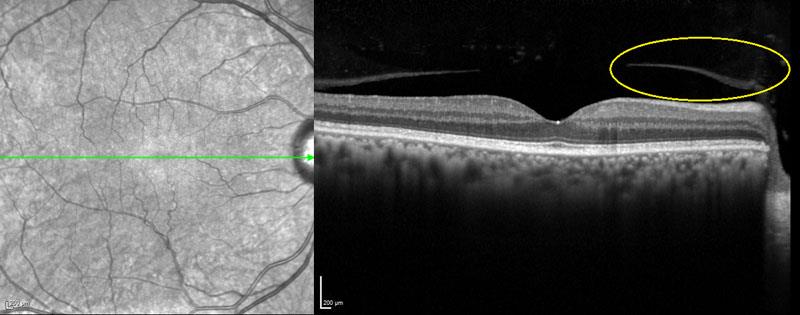
Figure 3: Horizontal line OCT exam of the right eye
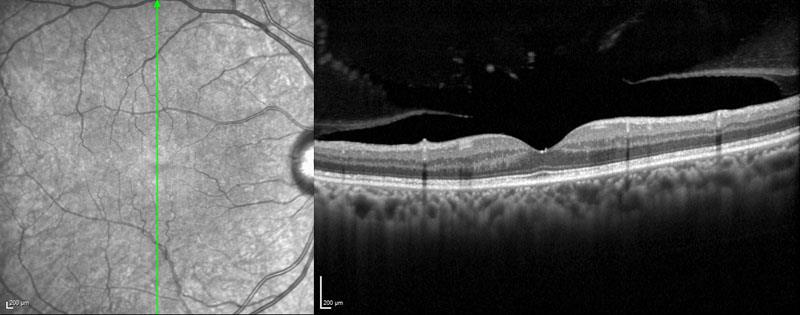
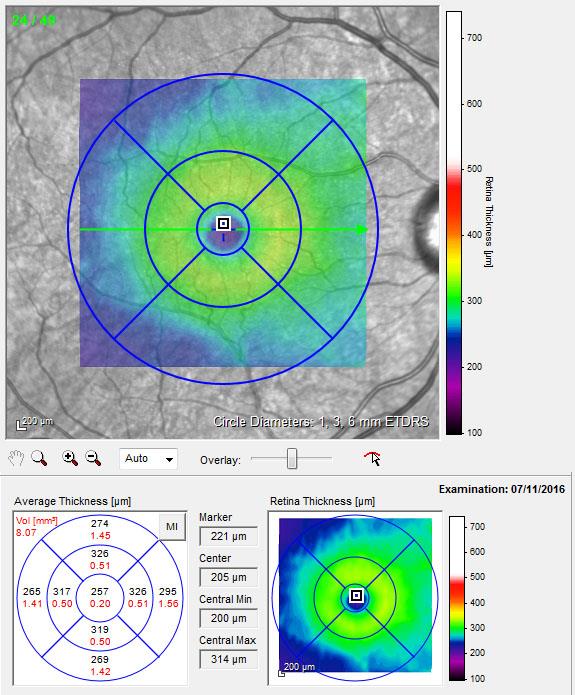
Figure 5: Macular thickness map
OCT examination of the left eye (figures 6, 7 & 8)
The horizontal line scan OCT examination (figure 6) of the left eye shows an irregular scan profile and asymmetric foveal profile. There is a highly reflective epiretinal structure and the epiretinal surface is ‘corrugated’ (yellow circle).
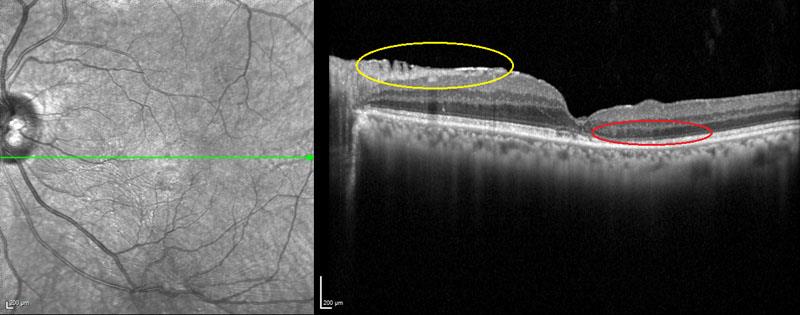
Figure 6: Horizontal line OCT exam of the left eye
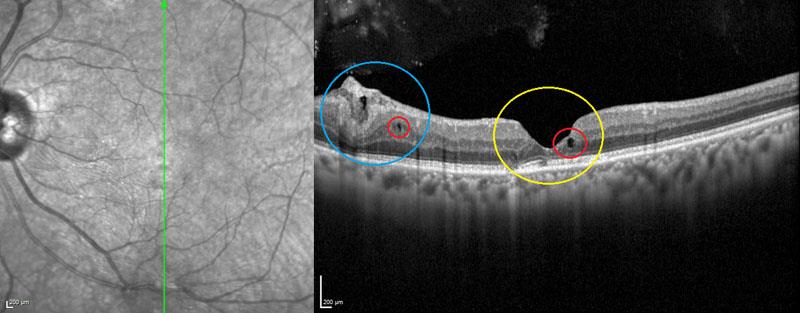
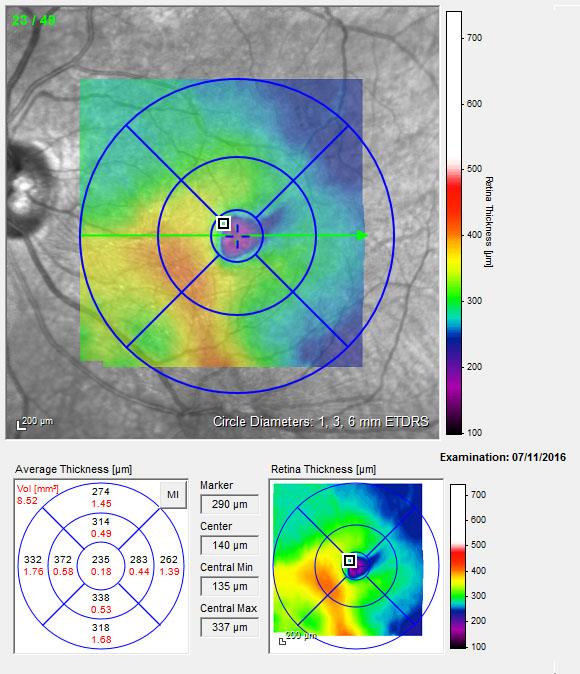
Figure 8: Macular thickness map
Temporally the outer nuclear layer is atrophied with disruption to the outer segments of the photoreceptors, ellipsoid and myoid segments (red circle).
The vertical line scan OCT examination (figure 7) shows an irregular scan profile with a steepened and deepened foveal profile (yellow circle). There is evidence of hypo-reflective voids within the retina, which could be macular cysts or cavitation (red circles). Inferiorly there is significant disruption to the RNFL associated with the epiretinal membrane (blue circle).
The macular thickness map (figure 8) shows signs of macular thickening (red/yellow areas) and foveal atrophy (blue/purple areas in the centre).
Glaucoma assessment using the RNFL report for right and left eye (figure 9)
The RNFL profile shows asymmetry temporal and inferior (figure 10), with separation of the R/L RNFL profile at these points (red box). Caution should be taken in interpreting this information as the epiretinal membrane is causing artefactual thickening of the profile.
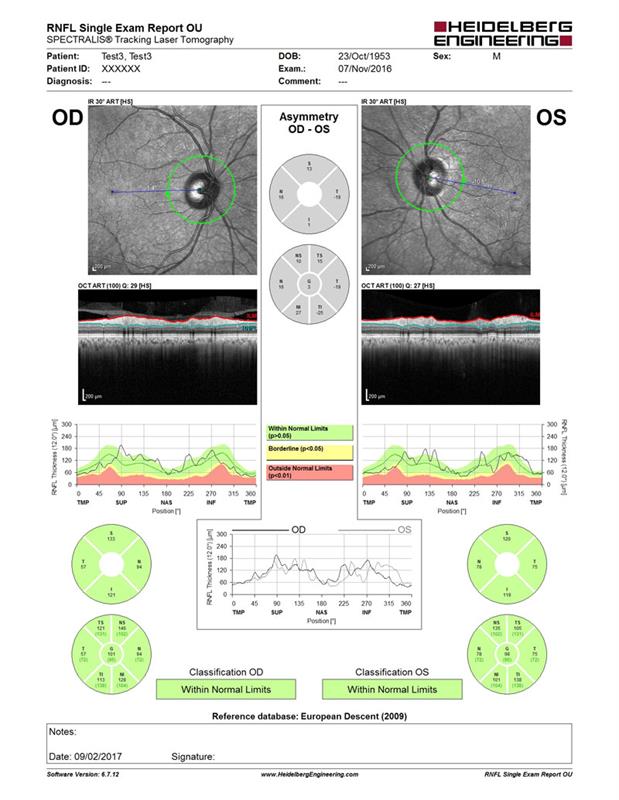
Figure 9: RNFL report for right (OD) and left (OS) eye
This is because epiretinal membranes can cause retinal pucker (‘pulling’ on the retina) which can lead to overestimation of RNFL thickness. It is imperative to always check the segmentation profile for evidence of retinal pucker that could affect the RNFL thickness results (figure 11). In this patient, although his RNFL thickness falls within the normal range, the RNFL thickness asymmetry between the right and left eye shows evidence of thinning of the RNFL profile inferiorally. In view of the family history of glaucoma, monitoring is advisable.
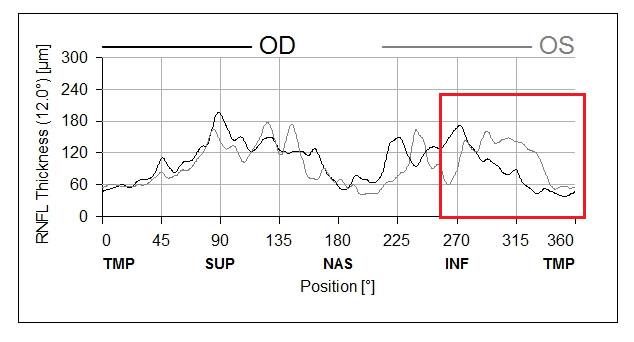
Figure 10: RNFL thickness in right (OD) and left (OS) eye. Note the asymmetry between the RNFL thickness in the temporal and inferior section (red box)
Conclusion
The macular changes in the left eye are consistent with blunt force trauma and a deceleration injury. Without the benefit of examining the patient at the time of the injury, it is impossible to be sure what happened, but the changes observed are consistent with traumatic vitreous traction and possibly a spontaneously closed macular hole. The changes are likely to be long standing.
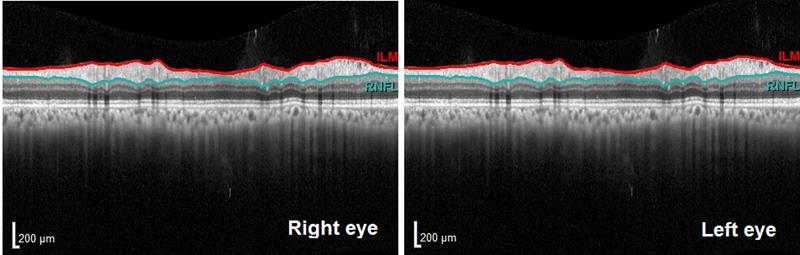
Figure 11: Segmentation of the RNFL in the right and left eye
Ongoing patient management
On the fundus image there appears to be two microaneurysms. Check that the patient is under the care of the community retinopathy screening programme and ascertain the date of the last fundus screening.
Ongoing monitoring of the patient for glaucoma, progression of diabetic retinopathy and changes in the epiretinal membrane are advised.
Want to know what happened next? Join Heidelberg Engineering on stand G20 at Optrafair on Sunday, April 2, to take part in a live follow-up examination of this patient and peer discussion worth three CET points. Register at www.optrafair.co.uk/education/on-stand-cet.