Bill Harvey tries out the latest vision testing unit to come onto the UK market
The Optimed Vision Analysis System
Bill Harvey tries out the latest vision testing unit to come onto the UK market
 |
| Figure 1. The laptop screen angle needs to be adjusted for maximum contrast setting |
As far as portability is concerned, any need for back illumination or variation of chart (such as a duochrome target, a fixation disparity target and so on) usually requires a suitcase-worth of equipment and targets for a full assessment to be carried out in the domestic or work environment.
Many recent developments have seen increasing use of computer-based systems. The City 2000 test chart
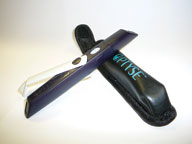
| Figure 2. The unit is both portable and easily mounted on a wall | |
 |
 |
This is particularly important when using such a system on a laptop. Most standard laptops have a screen that varies in contrast depending upon the angle at which it is viewed. When I use such a system, I have to position myself at eye level next to the patient and adjust the screen angle to a maximum contrast setting (Figure 1). This is not a major problem but does use up time. The letter size adjustment is straightforward when working distance needs to be adjusted, but for shorter distances this sometimes affects the smaller letters. Also, the systems need to be recalibrated on a regular basis to maintain the correct luminance contrast on screen.
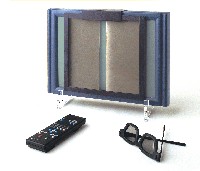
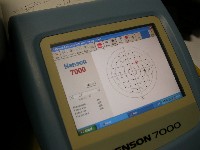
I was interested, therefore, to see a new electronic chart system which is not based on a software programme for loading on to a computer, but is an integrated unit with a liquid crystal TFT screen of 38.5cm by 28 cm. This allows it to be clearly seen at a variety of angles. Also, very usefully, there is never any need to recalibrate the screen. The unit contains the infra-red activated display circuitry, but the whole unit is just 8cm deep, allowing it to be both portable and easily mounted on a wall (Figure 2). The unit comes in a carrying case which also includes the remote handset, red/green and polarising goggles as well as a polarising screen which may be mounted over the main screen itself. Weighing in at 3.8kg, the unit is heavier than a typical laptop but obviously much more portable than a desktop based system.
40 DIFFERENT TESTS
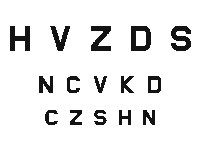 |
| Figure 3. The ETDRS chart |
There is, however, the option to use a variety of other charts. The SLOAN chart was originally introduced into practice in 1959 by Louise SLOAN and used a non-serif letter improvement upon previous Snellen types. More recently, the need (driven particularly by practitioners working in low vision assessment) for greater numbers of letters for assessing lower levels of vision and for there to be a regular size change between lines and spacings between letters, has resulted in a variety of logMAR-based charts such as the ETDRS, now considered the standard for the profession, certainly in parts of the US (Figure 3). The ETDRS developed out of the Early Treatment Diabetic Retinopathy Study. Child-friendly charts are widespread, a common one being an HTOV chart which may be used as a matching test. The SLOAN, ETDRS and HTOV are all represented on the Optimed system and, importantly, may all be randomised to prevent a patient from memorising letters between presentations. All acuity charts may be pre-set for working distances from 0.5m up to 8m and there is the option for a reverse chart if the screen is to be viewed through a mirror. Chinese and Hebrew letters are also available.
Another idea I liked was the way the remote used a number of 'hot keys' allowing the practitioner to jump from larger to smaller targets without the need to scroll down. These may be pre-set to the testing patterns of up to three different practitioners which is useful in a busy practice.
CONTRAST
Many eye diseases, particularly those affecting the media, may have little influence upon high contrast acuity targets (as with a standard Snellen chart) but significantly reduce one's ability to see in the variable contrast environment within which we all live.
 |
| Figure 4. Contrast sensitivity function test |
The Optimed system is interesting in that it incorporates a Vistech contrast sensitivity
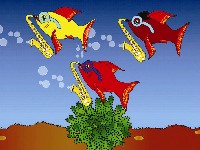 |
| Figure 7. Animations for the children |
For many years, researchers have argued the usefulness of CSF assessment in general practice, but to my mind this represents one of the easiest and quickest methods of such assessment I have seen and would be very easy to incorporate into a routine examination.
BV AND COLOUR TESTING
Another interesting feature is the incorporation of an Ishihara pseudoisochromatic plate
 |
| Figure 6. Ishihara pseudoisochromatic plate |
There is a need to use a polarising screen (which may be orientated vertically or horizontally) for fixation disparity assessment. What I found interesting about this test was that, when a disparity is found, instead of using prisms in a trial frame to realign the cursors, the lines are actually manipulated on screen to the correct alignment and the prismatic equivalent to achieve this is shown on screen (Figure 8). This is useful for
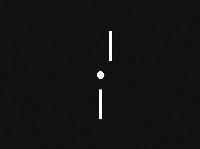 |
| Figure 8 |