At the NEG/Independents Day conference in November 2016, Heidelberg Engineering scanned three real patients from Optometrist Peter Waite’s practice, KG Miles in Birmingham. All the patients were scanned live on the big screen using the Spectralis Imaging Platform and were assessed for both retinal disease and glaucoma. Their cases were presented in Optician and follow-up examinations were subsequently performed on these patients at Optrafair 2017. A case study is presented below in the first of a three part series examining how each of the patients has progressed.
The case
A 64-year-old male patient attends for his follow-up OCT assessment. Previous findings were bilateral suspicious discs and posterior vitreous detachment (PVD) in the right eye and epiretinal membrane (ERM), with possible spontaneously closed macular hole in the left eye.
Follow-up examination of the macular (right eye):
A macular OCT examination was performed using follow-up examination protocol (figure 1). The OCT scan shows no structural change and a normal foveal profile. The vitreous cavity reveals an interrupted hyper-reflective band consistent with a PVD and the posterior hyaloid face.
The macular thickness map shows no significant change in the retinal thickness, with an inter-scan variation of one micron in the central subfield (figure 2). So, there is no significant change.
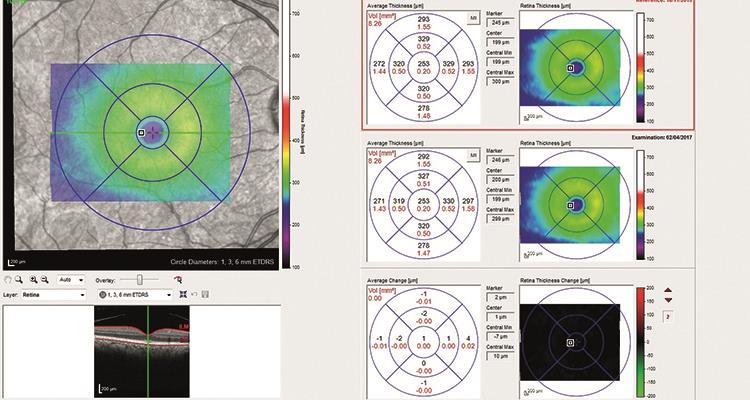
Figure 2: Macular thickness map (right eye)
Follow-up examination of the RNFL (right eye):
The RNFL examination shows no significant progress from the baseline examination two years earlier, with a global reduction in RNFL thickness of 1.2µm, a rate of change of half a micron a year (figures 3 and 4).
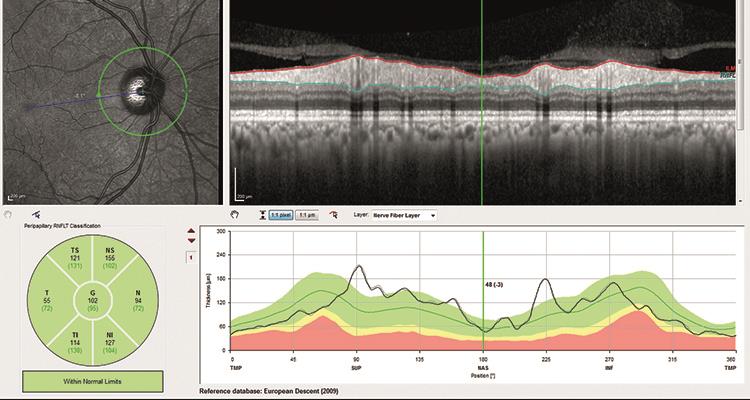
Figure 3: RNFL profile showing RNFL thickness
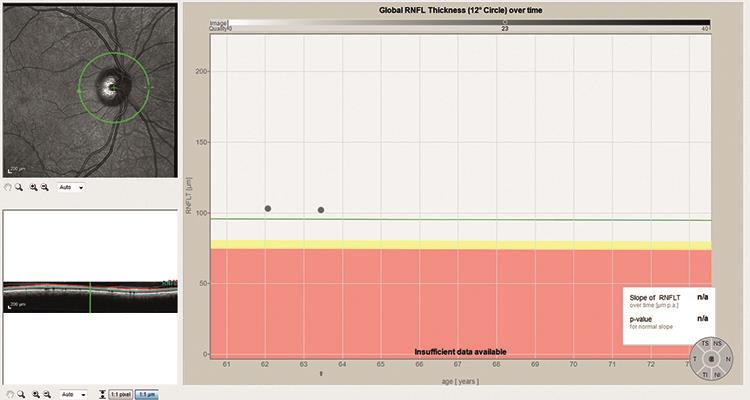
Figure 4: Change in RNFL thickness over time
Follow-up examination of the macular (left eye):
The left macular OCT scan shows little change in the macular or foveal profile, with a light increase of the ERM, in terms of thickness, reflectivity and size (figure 5).
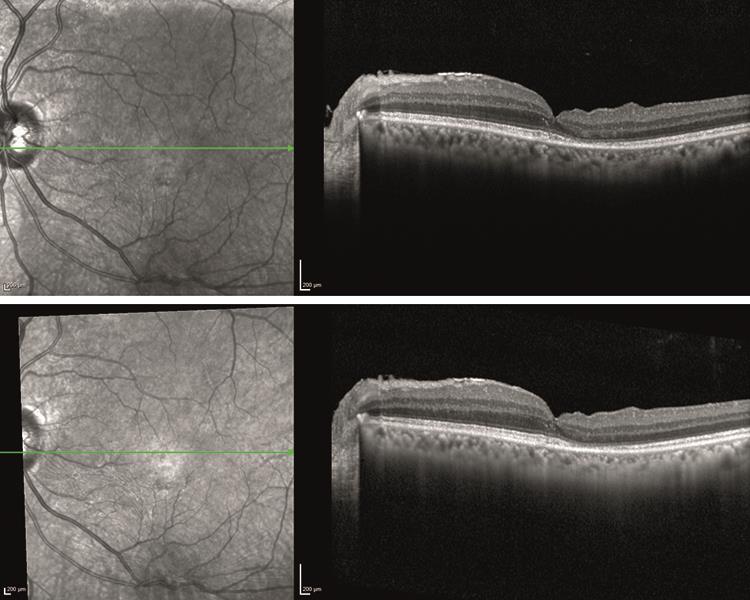
Figure 5 Top: original OCT single line scan taken on 08/11/15. Bottom: follow-up OCT single line scan taken on 02/04/17
The macular thickness map shows a slight increase in central subfield of 7µm (figure 6). This is consistent with the changes observed in the OCT scans.
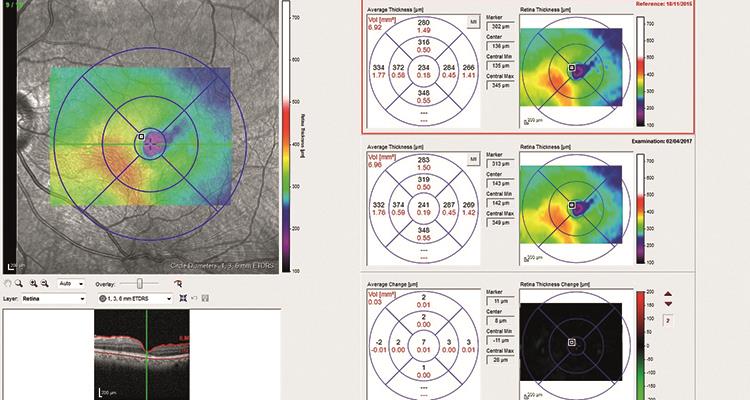
Figure 6: Macular thickness map (left eye)
Follow-up examination of the RNFL (left eye):
The RNFL examination of the left eye shows little change between examinations with a global increase in RNFL thickness of 0.85µm, although in the inferior nasal sector there is an increase of 15µm observed (figure 7).
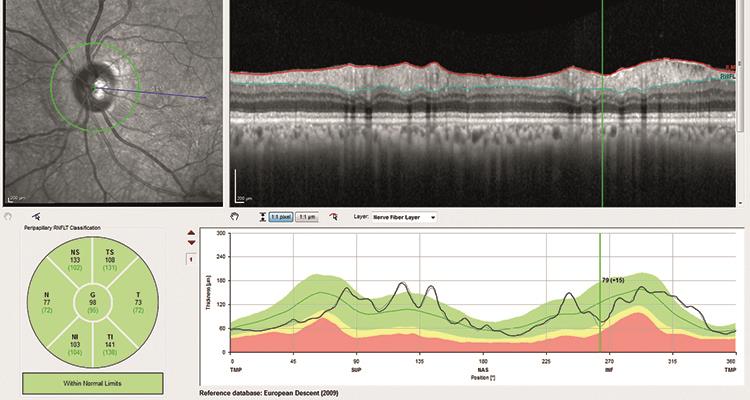
Figure 7: RNFL profile showing RNFL thickness. Position of the green line highlights area of increased RNFL thickness
Discussion
Over the two-year period there has been little or no change between examinations of the right eye. The macular is unchanged and the progression observed in the RNFL thickness can be attributed to inter-scan variation or normal change due to ageing.
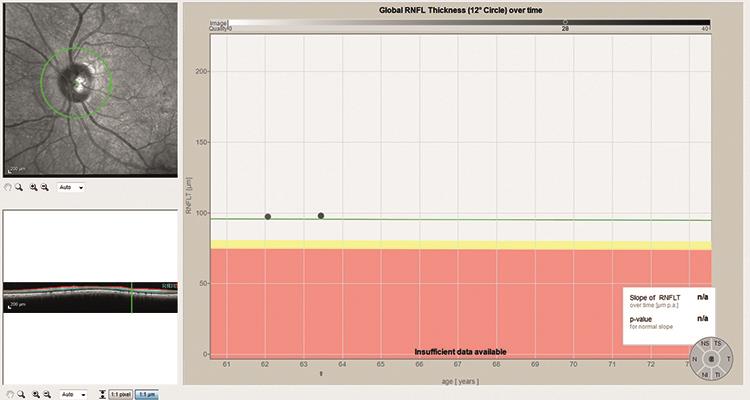
Figure 8: Change in RNFL thickness over time
The changes in the left macular show an increase in thickness of the ERM, with increased macular pucker and associated retinal thickness. This is observed in the 7µm increase of central subfield value. This change is probably insignificant, but should probably be observed and a referral considered if further increase in retinal thickness is observed, associated with onset of visual symptoms or reduction in acuity.
The increase in retinal thickness in the left RNFL profile is at odds with a suspicious disc, one might expect to see further atrophy; however, the progression of the ERM is also influencing the RNFL thickness measure acquired by the circumpapillary scan. Referring back to the high quality RNFL OCT reveals an increase in the ERM in the inferior nasal sector, accounting for the increase in retinal thickness at this point. Continued monitoring is advised.