The elderly gentleman looked bemused as I encouraged him to look at my nose as I ‘waggled’ my fingers at the end of my outstretched arms in the vain hope that it might provide some information about the status of his peripheral visual fields. Within his poorly-illuminated lounge, I had no control of any of the parameters which I had been taught might affect the reliability of my visual field assessment-stimulus luminance (finger), background luminance (wallpaper, china ducks and TV screen), fixation target (my nose), stimulus movement (the enthusiasm of my waggling), etc. ‘Visual fields full to confrontation,’ I recorded as I mused whether the result would have been any different if the patient had a full-blown homonymous hemianopia.
Over the past few decades there have been impressive developments in the world of visual field testing. The early arc perimeters and Bjerrum screens have evolved into the highly sophisticated instruments available today. Perimetrists (recording isopters by making holes in a record card) have been replaced by computers creating detailed maps of visual fields obtained using sophisticated psychophysical algorithms (with obligatory acronyms), adorned with a mind-boggling array of statistics. These developments have been supported by a huge body of research.
There is no doubt that these developments have improved the accuracy of visual field assessment and allowed for more accurate detection and monitoring of lesions affecting the visual fields. However, the new generation of field screeners are generally large, expensive and delicate and therefore not well-suited to the demands of domiciliary practice. Consequently, the domiciliary practitioner is faced with a choice of a ‘luggable’ screener (to add to all the other equipment to carry), rather basic card-based tests or ‘waggling fingers’.
Given that computer screens are now widely used for displaying test charts and performing a wide-range of other tests of visual function, it is somewhat surprising that until now, there has been no commercially-available visual field test exploiting modern display technology (most field screeners choosing to use LEDs or projection systems). Modern screens provide a high resolution, cheap and portable test canvas – so what is the catch? Two potential limitations are immediately apparent.
Firstly, unless a curved computer screen is used (not currently available) it will not be possible to cover the same area of the visual field as a ‘bowl’ perimeter. However, it is of course possible to change the position of the fixation target to effectively enlarge the testing area provided by a screen. Furthermore, within the context of screening in a domiciliary environment, the reality is that most defects are likely to be apparent within the central +/- 30 degrees.
Secondly, if off-the-shelf computer displays and laptop screens are to be used, it is necessary to calibrate the screen luminance to ensure that the background luminance is within tolerance and the luminance of the stimuli is known. Until recently, screen calibration required the use of expensive photometers. However, the advent of affordable screen calibration technology has removed this potential obstacle.
Encouraged by the apparent removal of the two most obvious obstacles, a team of developers at Thomson Software Solutions set out to develop the software to turn a PC or laptop into a ‘useful’ visual field screener. It should be stated from the outset that it was not our ambition to create a replacement for existing clinic-based visual field instruments, but a test which would provide domiciliary patients with a meaningful visual field screening. After two years of research, development and testing, the result is the Digital Visual Fields Screener (figure 1).
Hardware
The Digital Visual Fields Screener is designed to run on a PC or laptop running Windows 7 or later. The requirements in terms of memory and speed are minimal but some consideration must be given to screen size.
The area of the visual field that can be tested clearly depends on the size of the screen and the viewing distance. In practice, a viewing distance of less than 25cm is not desirable so there is a minimum practical screen size required to cover a reasonable area of the visual fields.
If the angle subtended by the screen is less than that required for the chosen protocol (30-2, 24-2, 10-2), the software will automatically move the fixation target to eccentric areas of the screen. While this is a good pragmatic solution, moving the fixation target can be confusing for some patients and can be avoided by using a larger screen.
A 24-2 examination can be carried out without moving the fixation target on screens of 17'' or larger. For desktop applications we recommend a minimum screen size of 24''.
While the software can be operated on computers with a single screen, there are a number of advantages to using a dual screen configuration. In dual screen mode, a test control window can be shown on one screen while the patient views the second screen (figure 2). This avoids the need for instructions and buttons to be displayed on the patient’s screen and allows the practitioner to monitor and control the progress of the test on the control screen.
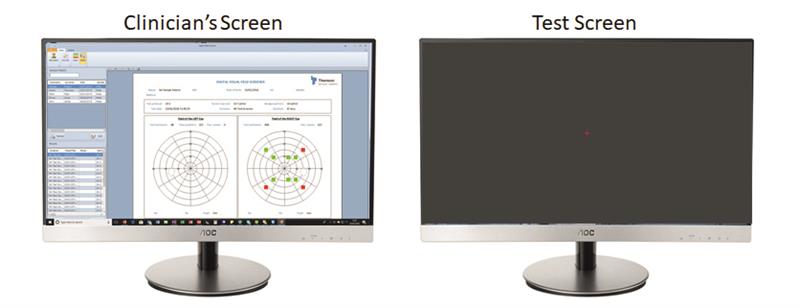
Figure 2: In dual screen mode the clinician can control the test on one screen while the patient views the second screen
For domiciliary visits, a mobile display panel may be connected to a laptop to provide the second screen (figure 3). Such panels are light and portable and require a single USB3 connection with the laptop. The display panel can be placed on a table or held directly by bed or chair-bound patients.
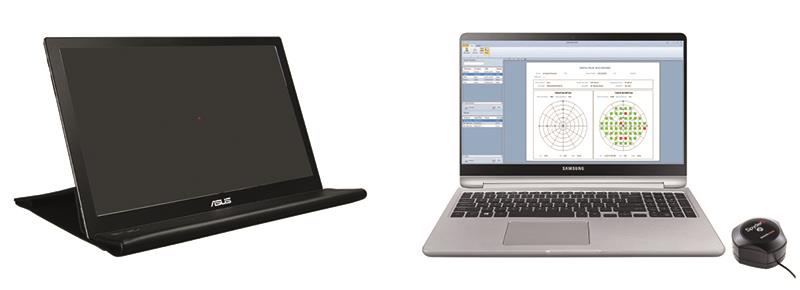
Figure 3: Portable display panels provide a good solution for domiciliary testing
Screen size calibration is a one-off measurement requiring the user to input the physical dimensions of the test screen and the proposed viewing distance (figure 4).
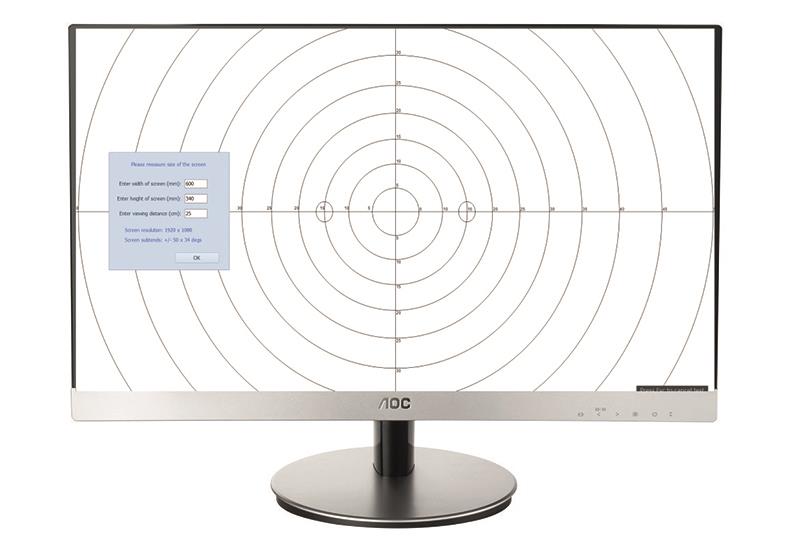
Figure 4: The Digital Visual Fields Screener can be calibrated for different sized displays
Screen luminance calibration
Visual field assessment requires careful control of the background and stimulus luminance. As no two computer screens are the same, it is very important that the screen luminance is calibrated before testing is carried out.
The Digital Visual Fields Screener is supplied with a Spyder 5 photometer for calibrating the screen luminance (figure 5).
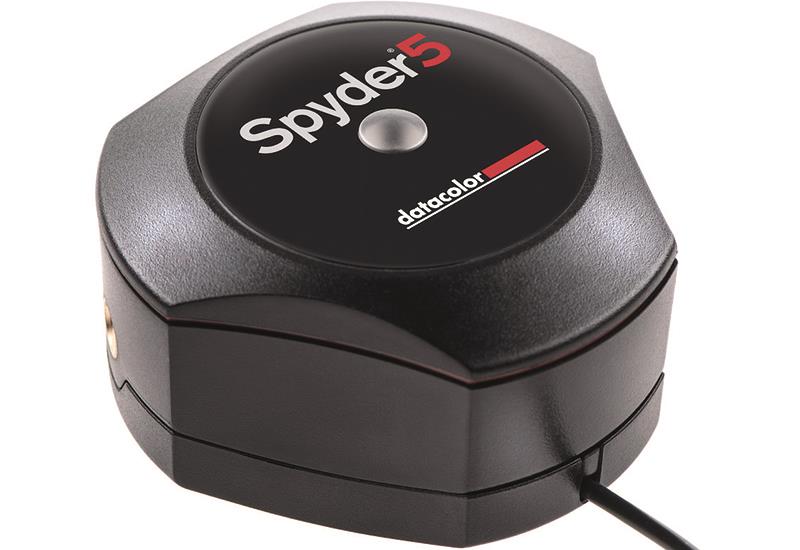
Figure 5: The Spyder photometer required for screen calibration is included with the package
To calibrate the screen luminance, the Spyder is attached to a USB port of the computer and the sensor placed over a test area of the screen (figure 6). The software automatically measures the screen luminance as the grey level is incremented from black to white. It is recommended that this process is repeated periodically to compensate for any changes in screen luminance over time.
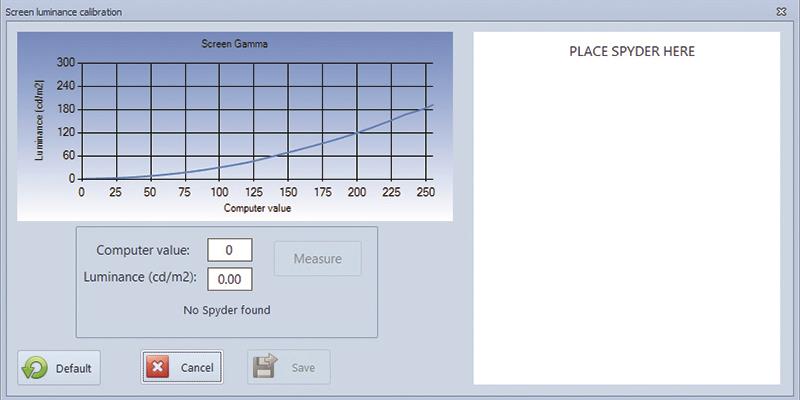
Figure 6: The display luminance is calibrated automatically
General considerations
Conventional visual field assessment involves assessing the smallest increment in luminance that can be detected (against a background luminance), at multiple locations across the visual field. The clinical value is based on the fact that lesions along any part of the visual pathway (from retina to visual cortex), will tend to cause a loss of sensitivity in an area of the visual field served by the cells or fibres affected by the lesion. The pattern of visual field loss often allows the location of the lesion to be identified while the severity and extent of the field defect allows the lesion to be monitored.
Unfortunately, the sensitivity of a human observer to a small spot of light varies with almost every conceivable parameter including background luminance/adaptation, size, colour and presentation duration. To complicate things further, these factors interact in a complex manner and vary according to the location of the stimulus. If you add some patient variables into the mix (refractive error, pupil size, lens opacities, fixation stability), some of the challenges of obtaining reliable visual field measurements become apparent.
In an attempt to standardise between instruments and clinics, a series of standards relating to background luminance and stimulus size, location and duration have evolved. The Digital Field Screener adheres to all relevant standards.
As a static visual field screener, some compensation must be made for the normal reduction in sensitivity as a function of eccentricity. This is usually achieved by either increasing the relative luminance or the size of the stimuli (exploiting spatial summation) as a function of eccentricity. This approach is less than perfect as the rate of change in sensitivity can vary between individuals and is not always homogenous. The Digital Fields Screener adopts the stimulus scaling approach using the best published data on norms.
Test options
Computer-based visual field testing provides an almost infinite range of possibilities in terms of stimulus configuration, positioning, test strategy and so on. Given that this first iteration of the test is designed primarily for the demands of the domiciliary environment, the philosophy has been to try and keep the testing process as quick and simple as possible for the patient (and the practitioner).
Stimulus locations
The program offers standard 30-2, 24-2 and 10-2 stimulus configurations and a 32 point rapid-screening test (figure 7).
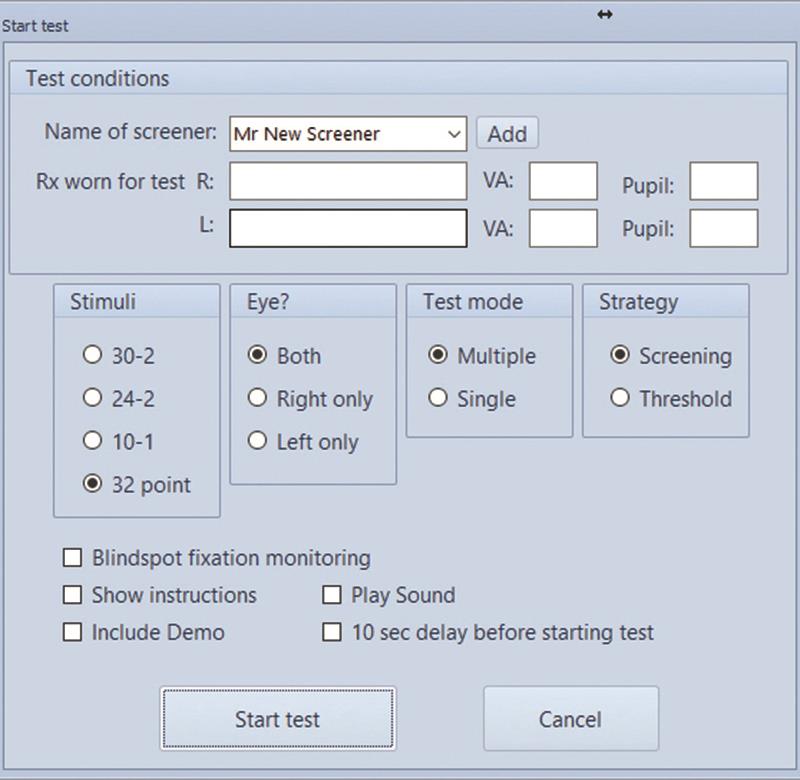
Figure 7: The software offers a variety of test options
Multiple or single stimulus testing
Many of the early static visual field instruments employed the strategy of presenting multiple stimuli, with the patient reporting the number of ‘dots’ they had seen. This technique allows rapid screening of multiple locations but does usually require an operator to be present (to record the number of ‘dots’ seen) and is slightly more demanding of the patient. Modern instruments have tended to favour a single-stimulus protocol on the basis that the test requires a single response button and minimal supervision.
However, given that in a domiciliary setting an examiner is likely to be present and that in general, speed is of the essence, we have resurrected the multi-stimulus approach as an option for the Digital Visual Fields Screener.
In multiple-stimulus mode, two, three or four stimuli are presented simultaneously and the patient reports the number seen (figure 8). If this number differs from the actual number presented, the same pattern is shown again at the end of the test. A second incorrect response triggers the algorithm to present the stimuli singularly so that any stimuli not seen may be identified.
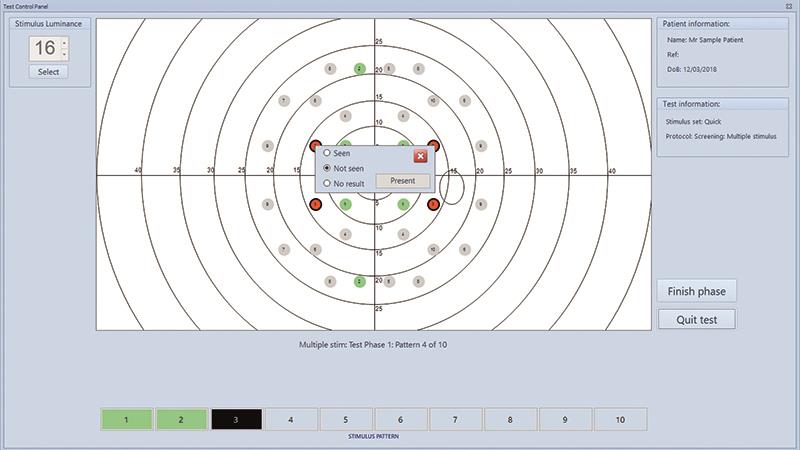
Figure 8: Typical control screen during a multiple-stimulus screening
In dual screen mode the operator may intervene at any stage to repeat a multiple presentation or present a stimulus manually, allowing the test to be tailored according to the patient’s capabilities.
In single-stimulus mode, a single stimulus is presented at each location and the patient is required to press a key within a response time window if the stimulus is seen. This test requires minimal supervision but takes approximately twice as long as the multiple-stimulus test.
Test strategies
The software currently employs a supra-threshold screening strategy, with or without threshold determination for missed stimuli.
In the first phase of the test, multiple stimuli are presented in the mid-periphery of the field and the patient is simply required to report if they can see any ‘dots’ flashing. If any of the stimuli are seen, the luminance is decremented until none of the stimuli are seen. The luminance is then incremented and decremented following a staircase algorithm until a ‘working threshold’ is obtained.
All stimuli are then presented at 5dB above the working threshold. This means that stimuli will be detected unless there is a scotoma with a depth of 5dB or more. In ‘Screening mode’, the software will simply show the location of any stimuli not seen. In ‘Threshold mode’, the luminance of each stimulus that was not seen is varied to determine the depth of the scotoma. This information is then represented on the final plot as a grey scale or a heat map (figure 9).
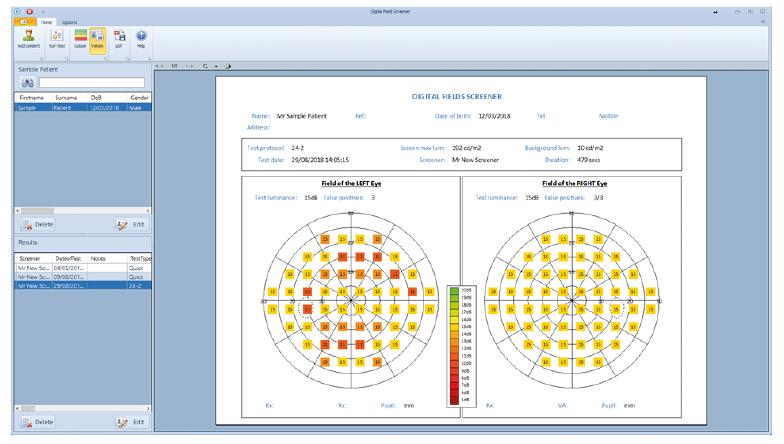
Figure 9: A heat map is shown for threshold tests
The software is also capable of monitoring fixation using the blind-spot technique. The blind-spot is located at the beginning of the test and then stimuli are presented in the blind-spot on a number of occasions throughout the test. If the patient reports that these stimuli are seen, it is assumed that the patient is not fixating correctly. This provides an indication of fixation accuracy.
To check for false positives (patient reports seeing a stimulus when they cannot), a number of dummy presentations are made throughout the test and false positive rate is reported.
Administrative functions
The Digital Visual Fields Screener incorporates the normal array of administrative tools. A database maintains a record or results and includes a powerful search facility. Multiple results can be selected to show changes over time. Charts can be configured in a variety of ways and printed or saved as a pdf to be attached to patient records.
The future
Results from trials suggest that the Digital Field Screener has excellent sensitivity and specificity as a screening device (relative to the gold standard instruments). Feedback from beta-testers and users suggest that the system is easy to use for both patients and practitioners and that the system represents a huge improvement on the alternatives for domiciliary testing.
While the current system is designed primarily for domiciliary testing (or perhaps a backup within a practice or clinic), with some further development and validation there is no good reason why a system of this kind could not provide an alternative to the current gold-standard instruments. Indeed, modern displays provide an ideal test canvas which could be used for performing a wide variety of vision assessments – fields, contrast sensitivity, acuity, eye tracking, Hess screen, stereopsis, colour vision – are just a few of the tests which are already available. Performing a range of tests on the same hardware has obvious advantages in terms of space and cost. Watch this space.
Professor David Thomson was Professor of Optometry and Visual Science at City University and is MD of Thomson Software Solutions