
Before starting my recent sessions at a low vision clinic, I had got into the habit of asking all patients about dry eye symptoms and, confirming what is widely known and published, found a majority suffered some form of symptomatic dry eye at some time. Most of these were easily helped by good advice, management of their environment or with the recommendation of lid therapy or tear and dietary supplementation.
Upon seeing people attending low vision clinic, many with severe sight loss or severe cognitive or learning difficulties, it became very obvious that, firstly, a majority of these patients had similar problems and, secondly, that many had never been asked about them before. Worryingly, though perhaps not surprisingly, knowing the ‘didn’t want to bother you’ attitude of many of our older patients, many were sitting at home and suffering symptoms of burning and gritty eyes which could easily have been addressed.
That said, assessment and management of dry eye disease, as we are usefully reminded by the TFOS DEWSII group, needs systematic assessment and the implementation of a tailored treatment which should be monitored over time as things change. One system that allows such an approach is the IDRA, which we first reported on in Optician 21.12.2018, so I was keen to get hold of the unit to see assess its usefulness in a low vision clinic.
The IDRA
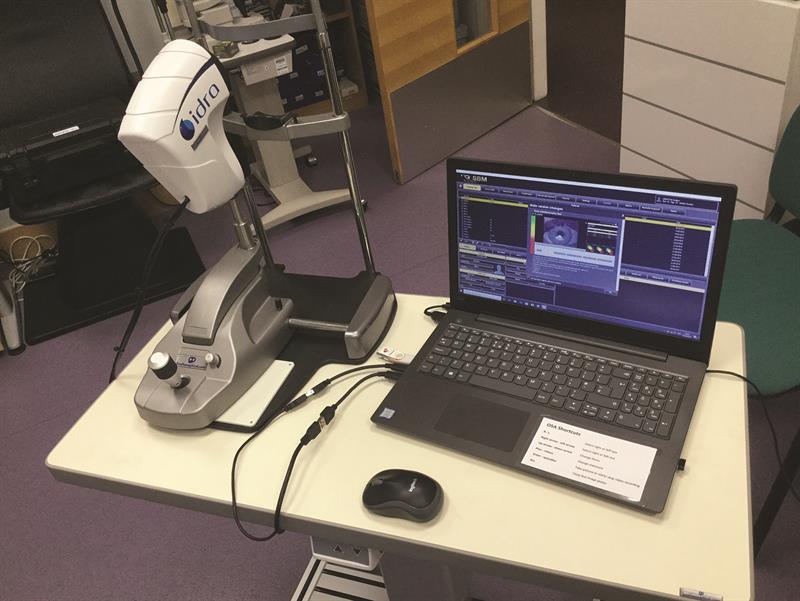 Figure 2
The IDRA (distributed in the UK by Grafton Optical) is essentially a 5MP digital imaging system that can be fitted into the central pivot hole (figure 1) of any slit-lamp and is capable of both multi-shot and video image capture. The unit has two links (one USB2 and the other USB3) to link with any laptop with the ports (figure 2) and onto which the licensed software has been downloaded (you pay for the unit and a license for software on one laptop). The unit, wiring and the linked laptop are easily contained within a carry case (figure 3) making the system portable between clinics.
 Figure 3
The operating head of the IDRA, as seen from the patient view, comprises a series of LED lights for image capture (figure 4) and onto this head further adaptors can be clicked into place (figure 5).
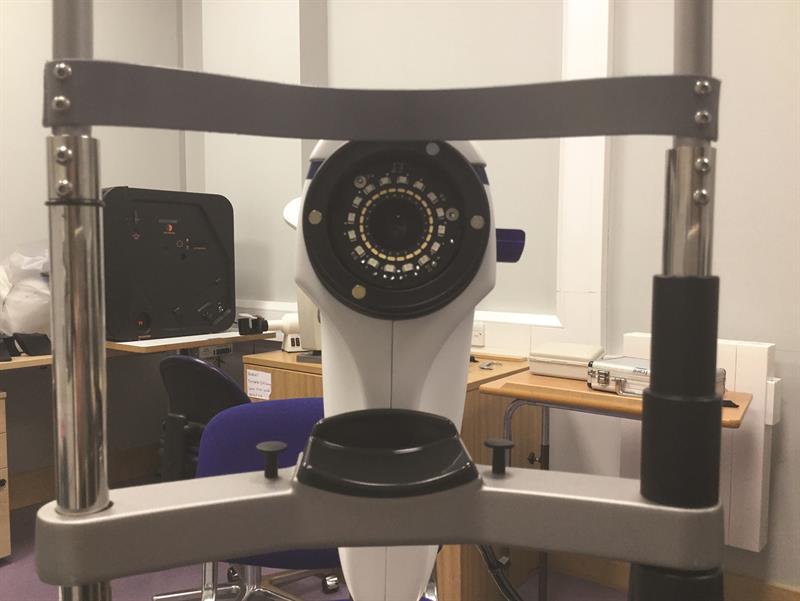 Figure 4
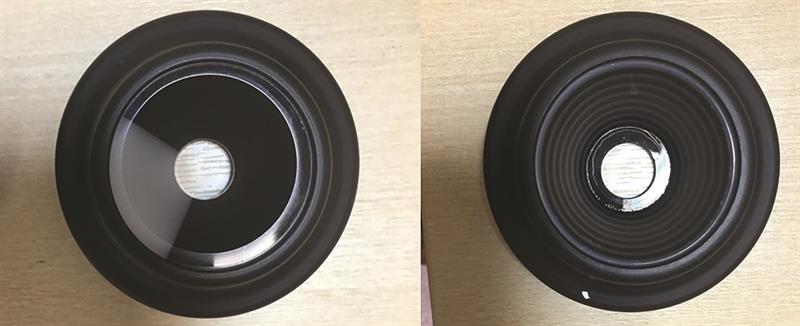 Figure 5
One of these has a white wedge and is used for interferometry, while a second has a series of concentric rings (Placido-style) which can be used for assessing surface integrity or distortion (figure 6). A small blue tab allows the insertion of an orange absorption filter for when blue light assessment is being used (figure 6).
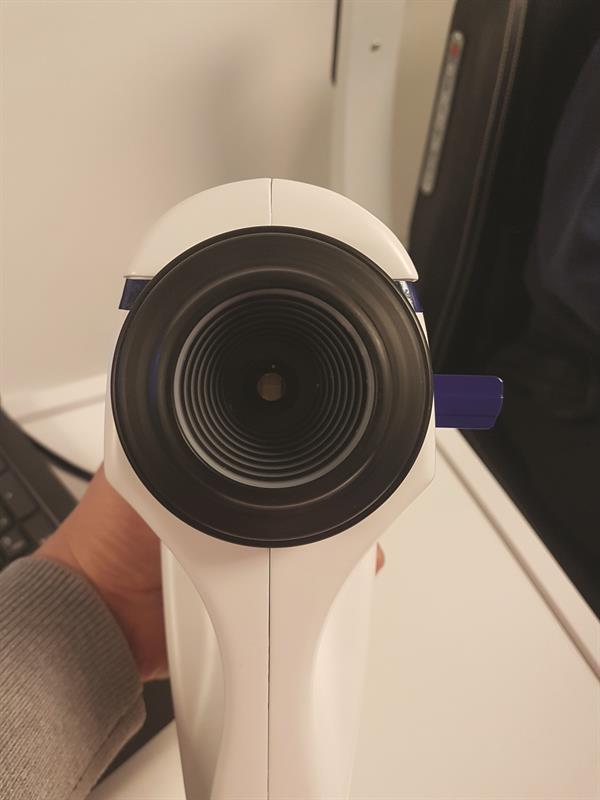 Figure 6
Tailoring Assessment
Once patient data has been input, the screen reveals the large array of tests and assessments that may be carried out (figure 7).
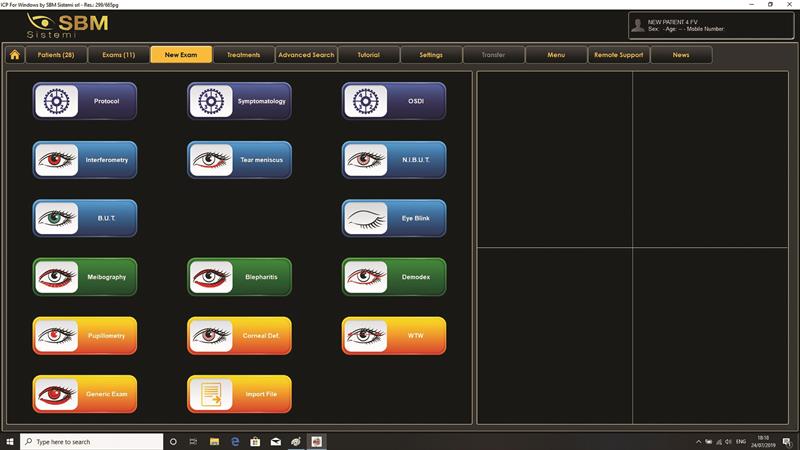 Figure 7
These are colour coded thus;
• Navy blue – options where data can be recorded, such as for an OSDI questionnaire or symptoms
• Light blue – tear assessment
• Green – lid assessment
• Orange – general assessment, such as anterior photography, corneal integrity/distortion or pupillometry
Tear Assessments
Before use on ‘real’ patients over the coming month, I began my first test run by working through the tests as they appeared on screen. So, interferometry first. Problems with the lipid layer causes changes to the interference pattern seen from tears when viewed with polarised light. This allows the tear interference pattern to be graded and so show integrity at any one time.
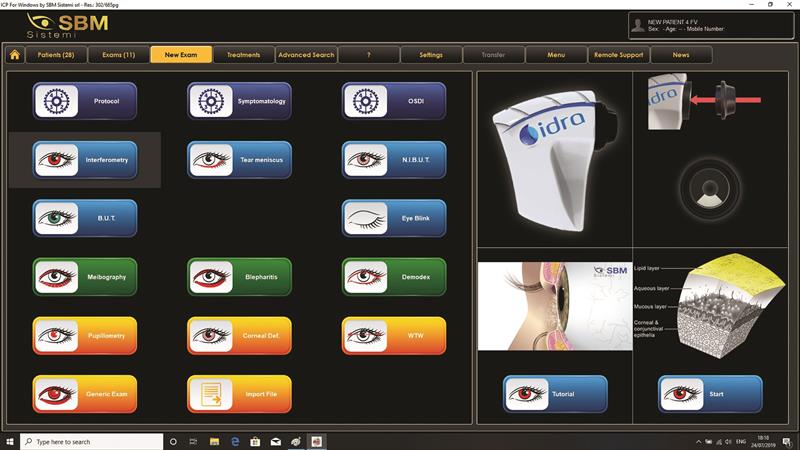 Figure 8
A click of the button brings up instructions as to how to set up the IDRA, in this case by using one of the attachment heads, some information about the tear film, and the option of a tutorial
(figure 8). These tutorials are videos of presentations by well-known optometrist Nick Dash who takes you through the process of taking the data and how to interpret them (figure 9). These are, I think, very useful for those new to any of the techniques and well worth going through before starting on patients.
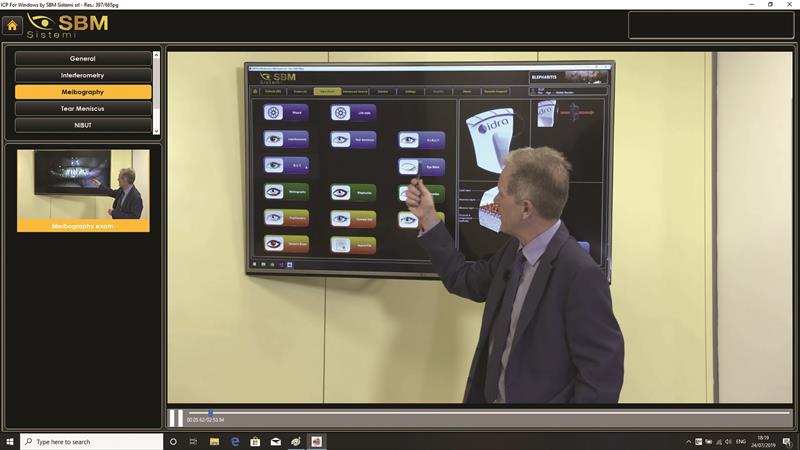 Figure 9
On clicking ‘start’, you then select the eye to be assessed (figure 10) and then view the screen such that the projected inferior white wedge fits nicely into a guide displayed (figure 11).
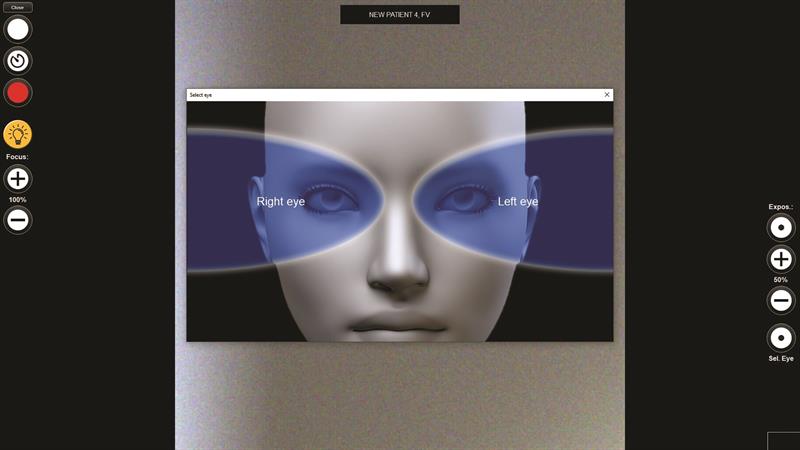 Figure 10
At this point, you record a short video of the eye by depressing the SPACE bar (a foot-pedal option is also available) and then pressing again after a period of a few blinks. All very easy.
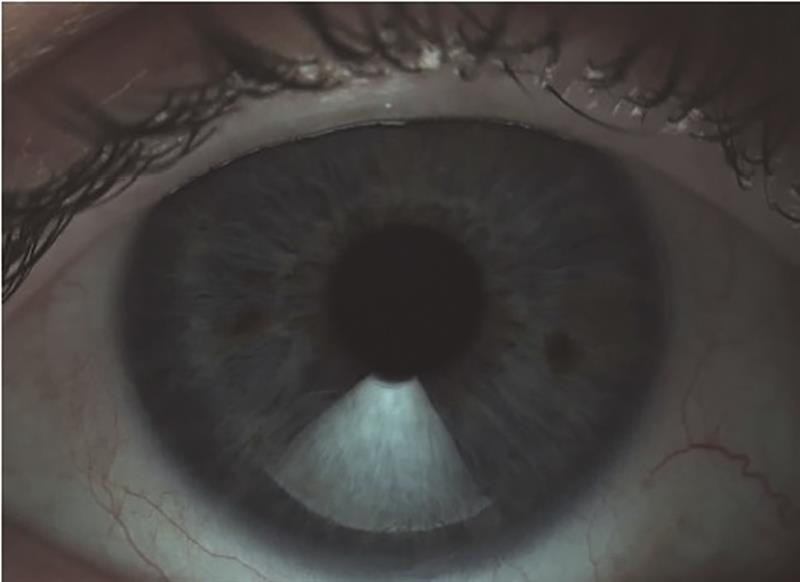 Figure 11
Once this is complete, clicking the analysis button then runs the video on screen and calculates the interference fringe response for grading (figure 12) along with data relating to the blink frequency and patency (figures 13 and 14).
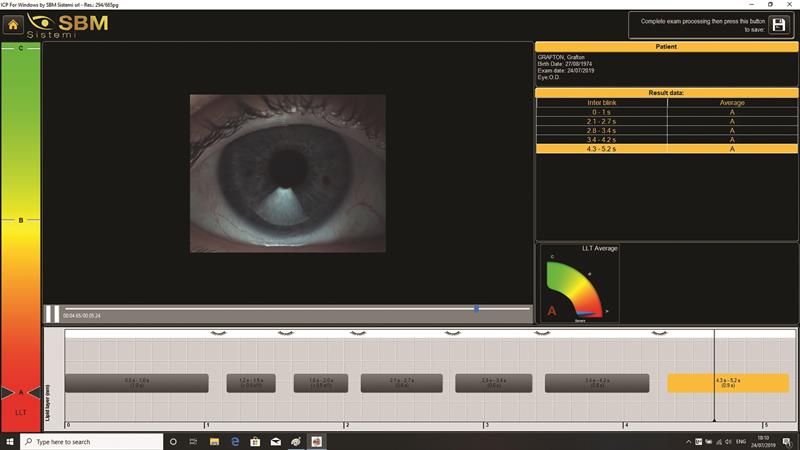 Figure 12
In our trial case here, the patient shows grade 1 fringing suggestive of a compromised tear film lipid layer. This confirmed what had been reported symptoms-wise and by confirmation of blocked meibomian gland orifices.
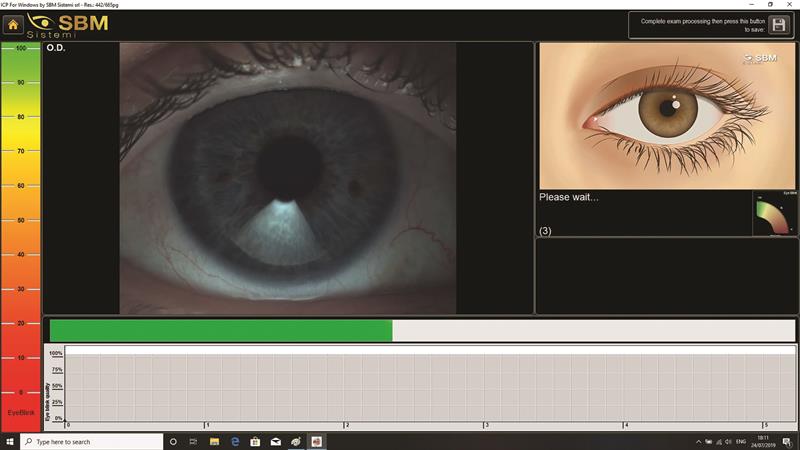 Figure 13
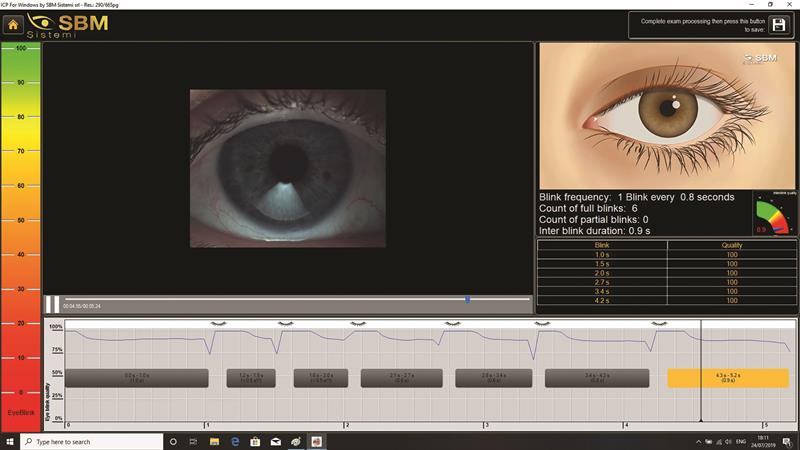 Figure 14
The same video capture is able to be analysed for other tear parameters, which may also be assessed as individual tests if required. So, tear meniscus height can be measured by aligning the pupil onscreen with a guide to standardise size, and use of callipers (figure 15).
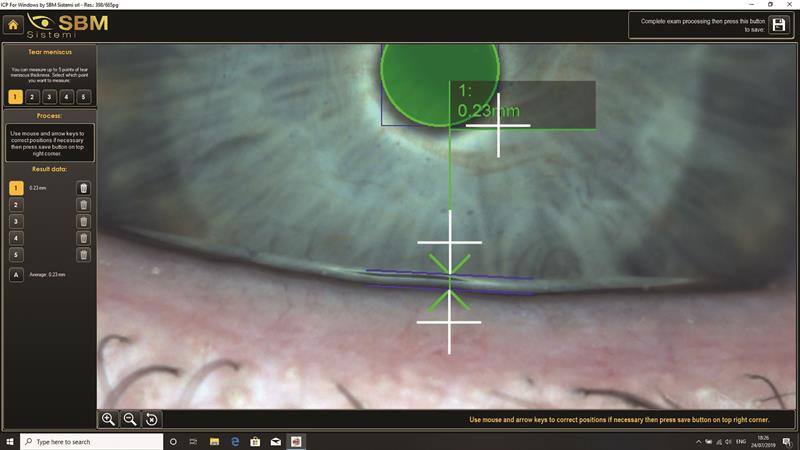 Figure 15
This can be done in up to five locations where there is uneven meniscus height (figure 16).
 Figure 16
Non-invasive tear break-up time requires the insertion of the Placido head. The eye is then focused on screen and the video captured as before. The IDRA is able to automatically detect areas of distortion of the projected disc pattern and highlight them in yellow, orange or red as they appear depending on the extent of distortion (figure 17). This adds accurate temporal information to what is all-too-often a subjectively variable test.
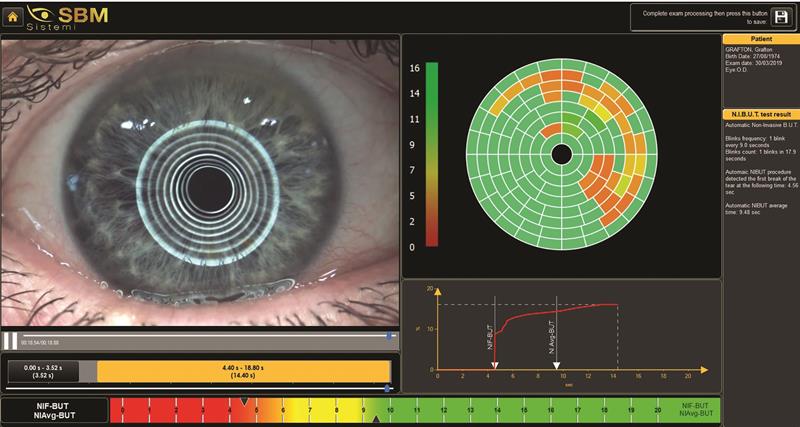 Figure 17
Fluorescein staining and break-up time are easily undertaken and visualised on screen, and the addition of the orange absorption filter has improved the sensitivity of these tests.
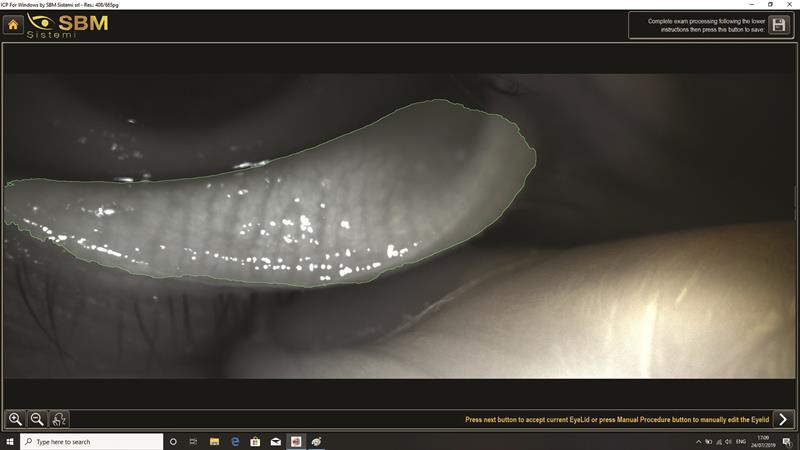 Figure 18
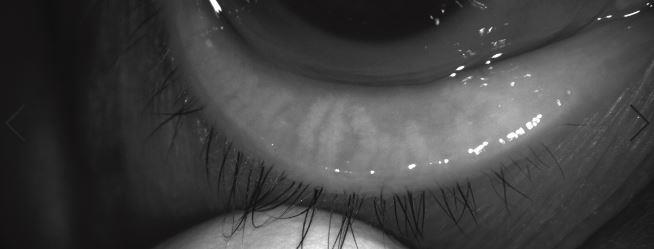 Figure 19
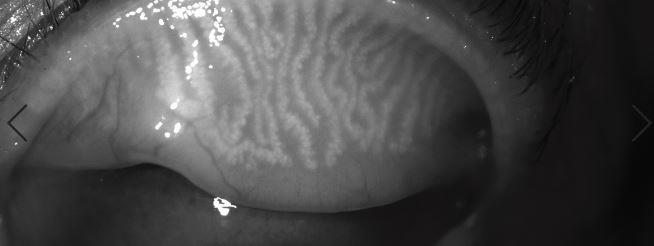 Figure 20
Lids
The use of an infra-red view allows the state of the meibomian glands to be easily visualised (figures 18,19 and 20).
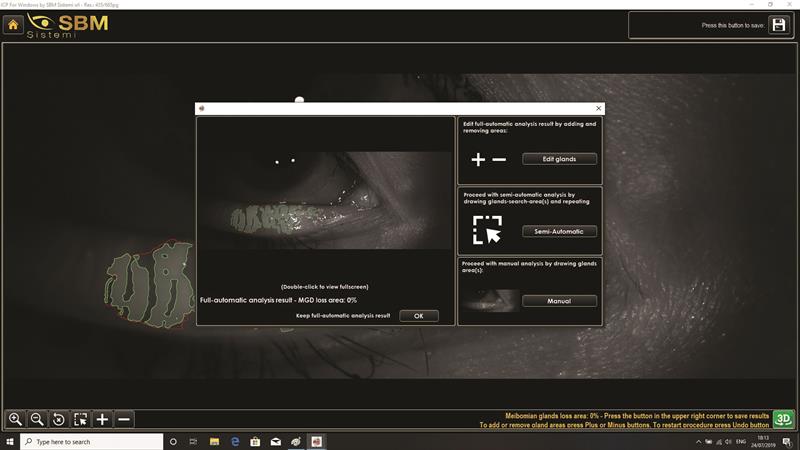 Figure 21
These can be further analysed after selection of the best image (figure 21), and the software maps the area of analysis (figure 22).
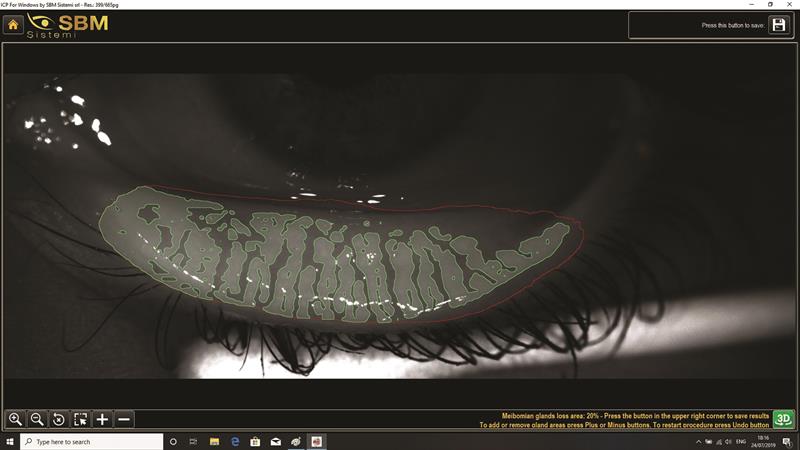 Figure 22
As well as showing percentage of drop out, there is the option of representing the glands in 3D (figure 23) or colour 3D (figure 24) which can be useful for informing a patient about their lid health.
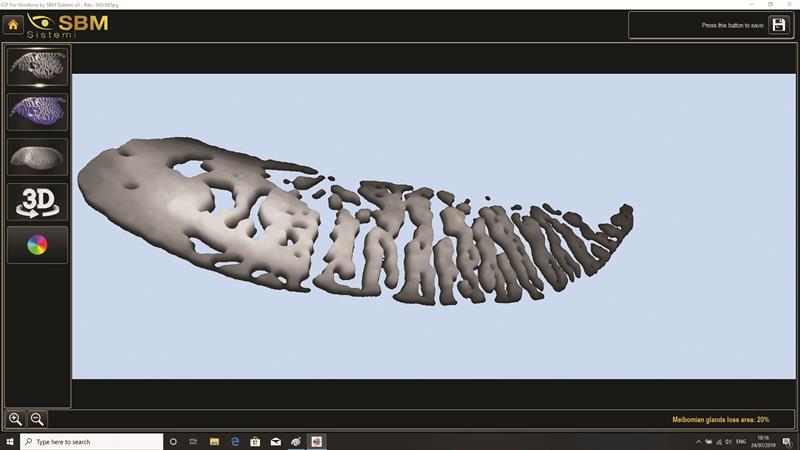 Figure 23
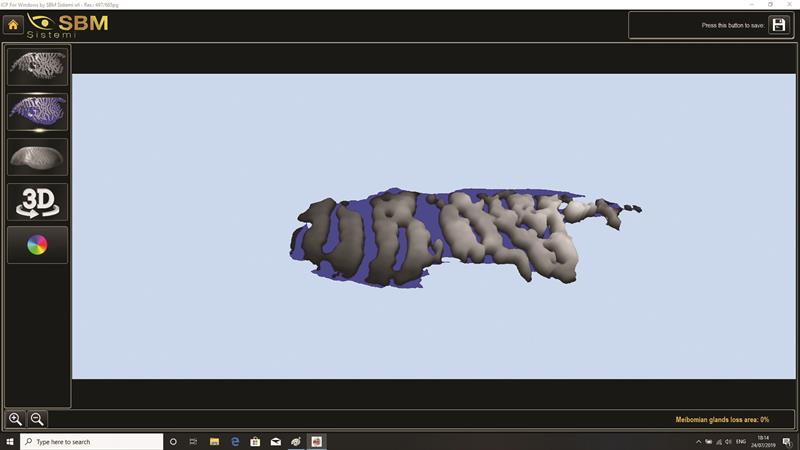 Figure 24
Reports
Importantly, the print out or display of data is entirely customisable (figure 25), with multiple options.
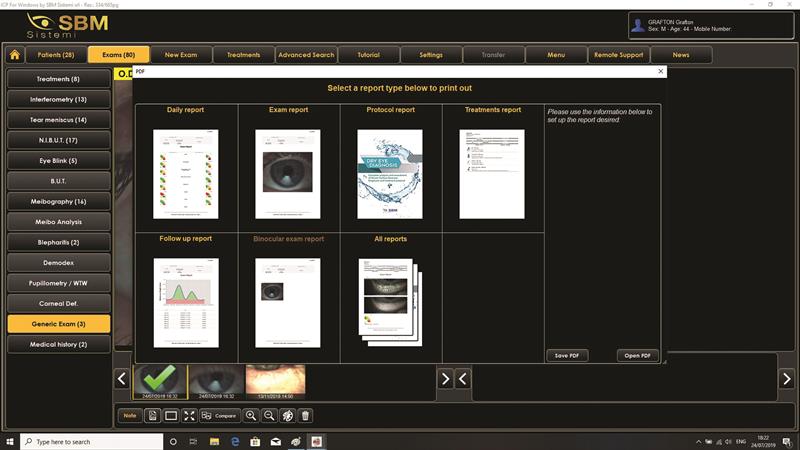 Figure 25
For example, my simple interference assessment of the right eye is shown in figure 26. This can then be compared with a second reading after MGD treatment. A full report can run to several sheets of print out, but keeping patients in the loop is key so having such a detailed profile should enable them to understand the benefit of any intervention and, importantly, to comply with instructions.
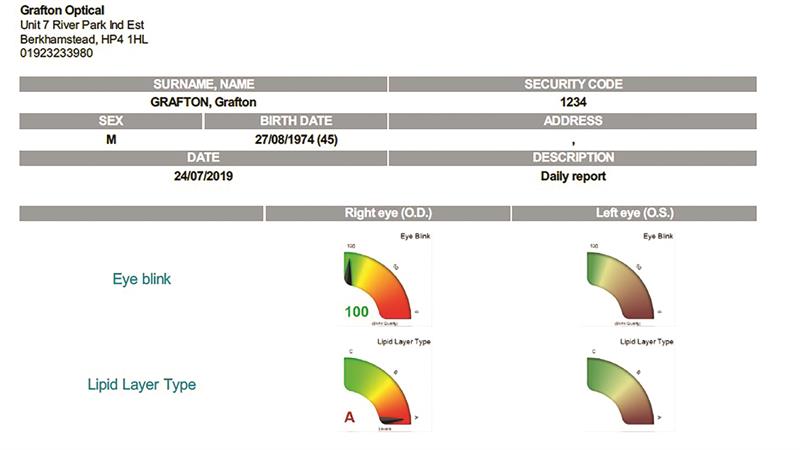 Figure 26
Look out for case studies using the IDRA in Optician in the coming months.
For further information contact www.graftonoptical.com