
Figure 1: Basic Michelson interferometer around 1880
In terms of advancing patient diagnosis and treatment in ophthalmology, light is a gift that keeps on giving. Traditionally the human vision system was the key mode of observation of the anterior and posterior eye and, for a time, the fundus camera was the ‘gold standard’ image capture system of retinal structures.
While the diagnostic information provided by the fundus camera system was of high value, each pixel in the image could be considered as the sum of photons scattered from adjacent tissues sites and so resolution could be degraded. Also, details of deeper structures could not be readily detected.
The technology of optical coherence tomography (OCT) has found a natural home within ophthalmology where the intrinsic transparency of ophthalmic tissues allows imaging of retinal structures. While OCT has made progress in other clinical specialties such as cardiology1 and gastroenterology,2 the rapid loss of signal in vascular tissue limits its application somewhat, though developments in optical technology continue to enhance its performance.
The challenges of more complex and diverse tissue profiles in clinical specialties such as cardiology and gastroenterology, however, may be made less daunting by the use of appropriate artificial intelligence (AI) technology.
Albert Michelson: The Master of Light
Before delving into the complexities of current OCT in ophthalmology, it is relevant to review the pioneering work of Albert Michelson in the development of interferometers. In 1879, in the USA, Michelson achieved a remarkably accurate estimation of the speed of light with essentially very basic equipment but elected to visit Europe to learn more from pioneers in optics in Berlin and Paris.
The great scientific debate of the era was that of the existence of the so called ‘luminiferous aether’ as a medium within which light could propagate. Michelson began to imagine how to conduct an experiment to detect the effect of basically checking for changes in the speed of light as a function of the direction of travel of light.
Previously, in 1859, Armand Fizeau had devised an apparatus to detect changes in the velocity of light from water flowing in opposite directions, which probably provided Michelson with some valuable insights. Michelson was also aware of an instrument designed by Jules Celestin Jamin in Paris to measure the refractive index of gases by interference of light waves.
He adapted this design to that indicated in figure 1 (see top of page), constructing it in Berlin with funding facilitated by Alexander Graham Bell but had to move the system to Potsdam to avoid the background vibrations of an active city. In the system, light from a lamp propagates through a pinhole with light being split by a beamsplitter into two paths.
Any relative changes in speed of light in different paths would be detected as moving fringes at the observer’s position. Changes in positions of fringes would be observed if there was a velocity change in the arms of the interferometer when the whole apparatus was rotated.
This was the so-called Michelson-Morley experiment, which was also subsequently repeated in the USA. There was, however, no noticeable change in the velocity of light in the different light paths, though this paved the way for the emergence of the relativistic theories of modern physics. Initially, Michelson described his invention as an ‘interferential refractometer’ but would revert to describing it as an ‘interferometer’.
Michelson’s highly developed experimental skills involving interferometers were acknowledged by the International Bureau of Weights and Measures3 when it asked him to measure the physical length of the standard metre using the wavelength of cadmium. Michelson in his 1907 Nobel lecture4 reported his measurement of the metre as equivalent to 1,553,292.3 wavelengths of the red wavelength of cadmium atoms.
In this mode of measurement Michelson was confident of making measurements to a fraction of a fringe change. Details of this important period of optical innovation are described in the biography of Michelson written by his daughter.5
Wave Properties of Light
While it is quite intuitive to consider photons of light as bundles of energy interacting with photoreceptors in the retina to create the sensation of vision, there remains a property of light which is not apparent. This is the phase of light associated with its ‘wave like’ properties.
Each photon of light can also be considered as a localised oscillating electromagnetic field where a photon of 532nm wavelength, a commonly used laser wavelength in ophthalmology, corresponds to frequency value is 5.635 1014 Hz. This is based on the relationship between the speed of light and the wavelength of light.
The shorter the wavelength, the higher the oscillating frequency. In addition, it is possible for photons in an advancing wavefront to share a common phase – like soldiers marching in a column.
If light travels out from a source with a common phase but with a spread of wavelengths, then as the wavefronts of different wavelengths propagate, the differing phases of the component wavelengths will produce the profile indicated in figure 2, where in this example the spread of wavelengths corresponds to around 2% of central wavelength.
Figure 2: Representation of coherence length (indicated by arrow) of wavefront profile with 2% spread of wavelengths
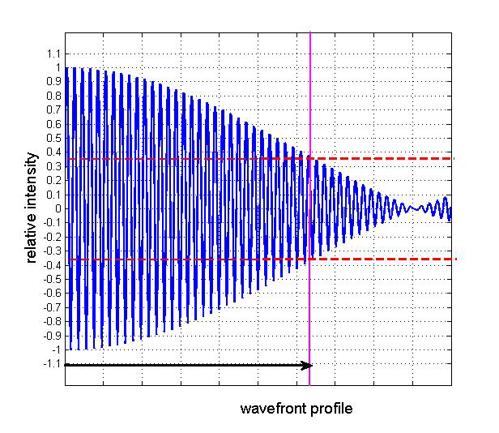
The coherence length is identified as the distance over which the apparent intensity falls by 36.8%. This extent of coherence length can vary greatly with various types of light sources. Laser sources with extremely small range of wavelengths or ‘bandwidth’ can have coherence lengths of several kilometres. For low coherence interferometry, however, coherence lengths of only a few microns are required.
It can be considered that the more ‘compact’ the group of coherent wavefronts, the better a light imaging system will be at detecting structures. Thus shorter coherent lengths are going to be better at resolving distances in the direction of beam propagation – the axial resolution.
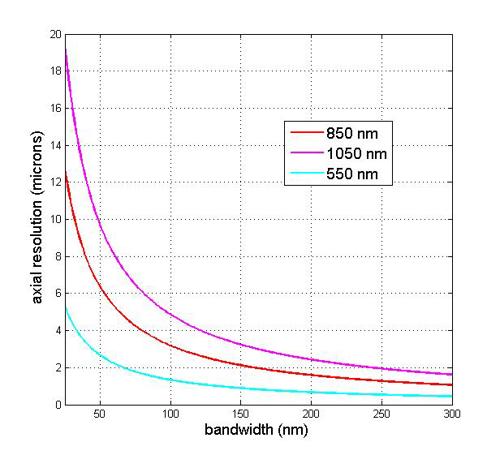
Figure 3 indicates the estimated axial resolution for a range of central wavelengths, 850nm, 1,050nm and 1,350nm for varying bandwidth of the light source. Thus shorter wavelengths will have a smaller value of axial resolution for a given bandwidth value.
Figure 3: Variation of estimated axial resolution with c. re wavelengths of 850nm, 1,050nm and 1,350nm as a function of spectral bandwidth
Time-Domain OCT (TD-OCT)
It was some time, however, before the potential of interferometry was applied to the imaging of biological tissues. Awareness of the technique of detecting interfence fringes of low coherence light from ocular interfaces such as the cornea and retina was demonstrated in 1982 by Fercher et al in Germany where it was possible to detect movement due to heartbeats.6
The first two-dimensional picture of the fundus of a human eye in vivo was created by Fercher in 1990, using white light interferometry and where his results were presented that year at the International Commission for Optics meeting.7
This marked the start of the rapid development of the technology with the group at MIT in the USA in 19918 creating the name ‘optical coherence tomography’ for the imaging modality. Initially, the technique used to generate images of the eye used so called time-domain OCT modality as indicated in figure 4.
Figure 4: Outline of time domain OCT modality

Figure 4 indicates the basic principle of image detection using the technique called time domain OCT. A wavefront of light from a broadband light source is split by a 45 degree mirror into paths AB and CD. Light in path AB, known as the reference arm, is reflected by a mobile mirror and passes up to the detector.
Light transmitted horizontally through the beamsplitter in the sample arm is partially reflected from interfaces at D, E and F and signals are reflected to the detector unit. The detector registers a signal when the path length determined by the mobile mirror position d corresponds to the path length of light corresponding to reflections from interfaces D, E and F.
This is where the phases of the light from different paths match. A limitation of this mode of signal detection is the speed with which the dynamic mirror can be activated, and so the image capture speed is limited.
As part of the image capture process, the broadband light source is focused to a small spot of a few micrometres in diameter and scanned over the sample surface as the ‘x,y’ co-ordinate value, while the ‘z’ or depth parameter is derived from the processed light detection signals. In this way a detailed 3D picture of the tissue sample can be constructed.
Fourier-Domain OCT (SD-OCT)
In a development from the so-called time domain technique of OCT detection, the Fourier domain option uses a light source with a range of wavelengths across the light field.
When the detected output from a spectrum analyser is processed for its time varying output using a Fourier transform to extract its time signature, the processed signal identifies the time signatures of the tissue interface that reflected back incident light. This technique is also described as ‘spectral domain OCT’ or ‘SD-OCT’.
Figure 5: Concept of Fourier-Domain OCT modality

The processing time for image generation becomes the time for processing the acquired light signal captured by the spectrometer though image processing speeds are considerably faster than time domain techniques.
The significantly enhanced image capture technology enabled by Fourier-Domain OCT (SD-OCT) allows, for example, live video imaging of tissue structures.
Fercher et al in 1995 described an early application of ‘backscattering spectral interferometry’ in the determination of axial length and where the technique is essentially using Fourier analysis of backscattered light.9 The impact of Fourier domain OCT in clinical use is described by Leitgeb et al.10
The Fourier-Domain technique, by nature of the limitations provided by sampling rate and specification of the spectrometer, is associated with a maximum imaging depth that increases with value of wavelength and number of resolved spectrometer pixels but decreases with the bandwidth of the light source.
Swept Source OCT (SS-OCT)
In swept-source OCT (SS-OCT), the light source is driven through a range of wavelengths and the signal output of the detector system is converted to spectral interference as indicated in figure 6.
Figure 6: Swept source OCT (SS-OCT) modality

Since the wavelength separation is generated by a laser, there is no need for a dedicated spectrometer element. The central frequency of such swept sources tends to be around 1,050nm due to the challenges of use of sources of shorter wavelength. The various differences between SS-OCT and SD-OCT are described by Kishi et al.11
A review of the rise of OCT technology from its early beginnings is described by Swanson et al within ophthalmic applications and also in wider clinical applications.12 Within ophthalmology, however, modes of diagnosis and treatment of a wide range of conditions have been transformed.
Consideration of Light Absorption in Ocular Tissues
It is also relevant to consider the relative absorption of optical radiation in the eye as a parameter for optimising OCT imaging. Reference is still made13 to the work of Geeraets et al in the relative transmittance values of the various ocular tissues.14
Between 800nm and 1,300nm the dominant absorbance is that of the vitreous with a peak of transmittance around 1,100nm (figure 7).
Figure 7: Transmittance of light in eye for retinal imaging14
![]()
Comparison of OCT Technologies
Table 1 indicates some key features of the various OCT technologies where vis-OCT is included based on SD-OCT technologies.

OCT Angiography (OCTA)
OCTA is an emerging technology that can produce high-resolution angiograms of retinal and choroidal blood vessels though the technology is not yet sensitive enough to detect vessel leakage. The technology operates by detecting the motion of red blood cells through repeated scans of areas of interest.
The technology, however, can provide an understanding of the microvascular changes that occur in ocular diseases15 and has the potential to provide early diagnosis and monitoring of appropriate therapies.
Figure 8: OCT Retinal angiography image using Spectralis OCT2. Image: Heidelberg Engineering GmbH

Figure 9: Retinal structure imaged using OCT on Spectralis OCT2.Image: Heidelberg Engineering GmbH

Future Developments
It is inevitable that the continuing developments in mainstream optics will enhance the existing performance of OCT systems in ophthalmology, where system developers become aware of relevant innovations and implement these within emerging products. At the same time, clinicians need time to assimilate best practice with an established core of reliable clinical OCT systems.
It is relevant to identify, however, the emerging interest in so-called ‘vis-OCT’ systems where wavelengths in range 500nm to 600nm provide both advantages and challenges in their use in OCT within ophthalmology. These shorter wavelengths provide improved axial resolution but with increased absorption in specific tissue layers.
In addition, use of these wavelengths for retinal scanning requires reduced levels of exposure for safety considerations. Several potential advantages of vis-OCT have been identified, however, and include the potential for more accurate imaging of retinal nerve fibre layer (RNFL) and retinal pigment epithelium (RPE) with an in vivo resolution of two microns.
In addition, vis-OCT has been identified with the ability to assess levels of retinal oxygenation in patients with diabetic
retinopathy.16
- Dr Douglas Clarkson is a research fellow at UHCW NHS Trust in Coventry with a wide interest in optical technologies applied to diagnostic specialties and modes of treatment which include lasers and non-coherent light sources.
References
- Ali ZA, Karimi Galougahi K, Thomas SV, Abu-Much A, Chau K, Dakroub A, Shlofmitz ES, Jeremias A, West N, Matsumura M, Mintz GS, Maehara A, Shlofmitz RA. Optical Coherence Tomography-Guided Percutaneous Coronary Intervention: Practical Application. Interv Cardiol Clin. 2023 Apr;12(2):215-224
- Tsai TH, Leggett CL, Trindade AJ, Sethi A, Swager AF, Joshi V, Bergman JJ, Mashimo H, Nishioka NS, Namati E. Optical coherence tomography in gastroenterology: a review and future outlook. J Biomed Opt. 2017 Dec;22(12):1-17
- Davis, R. A short story on length. Nature Phys 14, 868 (2018). Available at:- https://doi.org/10.1038/s41567-018-0243-4
- Michelson, A. A. in Nobel Lectures, Recent advances in spectroscopy. Available at:- https://www.nobelprize.org/uploads/2018/06/michelson-lecture.pdf
- Livingston, Dorothy Michelson. The Master Of Light: A biography of Albert A. Michelson, Scribner, 1973
- Fercher, AF , Hu HZ, Steeger PF, Briers JD. Eye Deformation Measurement by Laser Interferometry. Optica Acta: International Journal of Optics. 1982;29(10):1401-1406
- Fercher AF. Ophthalmic interferometry. In: Proceedings of the International Conference on Optics in Life Sciences. ed. von Bally G, Khanna S, eds. Garmisch-Partenkirchen, Germany, 12–16 August 1990, 221-228
- Huang D, Swanson EA, Lin CP, Schuman JS, Stinson WG, Chang W, Hee MR, Flotte T, Gregory K, Puliafito CA, et al. Optical coherence tomography. Science. 1991 Nov 22;254(5035):1178-81
- Fercher AF, Hitzenberger CK, Kamp G, El-Zaiat SY. Measurement of intraocular distances by backscattering spectral nterferometry. Optics Communications. 1995;117: 43 - 48
- Leitgeb R, Hitzenberger C, Fercher A. Performance of fourier domain vs. time domain optical coherence tomography. Opt Express. 2003 Apr 21;11(8):889-94. doi: 10.1364/oe.11.000889. PMID: 19461802.
- Kishi S. Impact of swept source optical coherence tomography on ophthalmology. Taiwan J Ophthalmol. 2016 Apr-Jun;6(2):58-68
- Swanson EA, Fujimoto JG. The ecosystem that powered the translation of OCT from fundamental research to clinical and commercial impact [Invited]. Biomed Opt Express. 2017 Feb 21;8(3):1638-1664
- van den Berg TJ, Spekreijse H. Near infrared light absorption in the human eye media. Vision Res. 1997 Jan;37(2):249-53
- Geeraets WJ, Williams RC Chan G, Ham WT Jr, Guerry D 3rd, Schmidt FH. The loss of light energy in retina and choroid. Arch Ophthalmol. 1960 Oct;64:606-15
- Hua D, Xu Y, Zeng X, Yang N, Jiang M, Zhang X, Yang J, He T, Xing Y. Use of optical coherence tomography angiography for assessment of microvascular changes in the macula and optic nerve head in hypertensive patients without hypertensive retinopathy. Microvasc Res. 2020 May;129:103969.
- Soetikno BT, Shu X, Liu Q, Liu W, Chen S, Beckmann L et al. Optical coherence tomography angiography of retinal vascular occlusions produced by imaging-guided laser photocoagulation. Biomed Opt Express. 2017 Jul 7;8(8):3571-3582

