In the last article, reviewing the performance of the Index panel members over the last 20 years, we identified the ‘Specsavers effect’ which impacted on the number of eye examinations, volume of spectacles dispensed and revenue. In 1993, when the Optician Index started, Specsavers had 200 stores in the UK with revenue of £150m. By the end of February 2015 it had 697 stores with revenue of £1.165bn, almost 40% of the optical retail market.
The aggregated results, for the Index panel, showed improvement in all of the performance measures up to 2004 but then we saw a reversal, resulting in modest revenue increases which did not keep pace with inflation for the next 10 years. In this second and final article we will be taking a look at the dispensing trends over the 20-year life span of Optician Index.
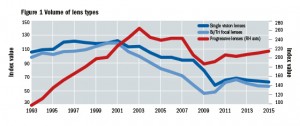
We have tracked the sales volume of single vision, bi/tri focal and progressive lenses. Volume of lens types (Figure 1) shows how the percentage increase in the volume of progressive lenses went up significantly as innovations in the modelling of the lens surface and computer-controlled manufacturing techniques introduced in the 1980s improved their quality and made them more affordable.
 Sales volume overtook those of bi/tri focal at the turn of the millennium helped by a more ‘youthful’ look and association. The sales volume of single vision and bi/tri focal lenses also increased but at a slower rate than progressive lenses to the year 2001. Progressive lens sales continued to grow up to 2003 and as the sales volume of single vision was not falling as sharply as bi/tri focals, Index reported this as a trend moving in the favour of progressive at the expense of bi/tri focal.
A more seismic shift was in fact taking place with Specsavers taking a greater share of the number of eye examinations and volume of spectacles dispensed. The rest of the market was repositioning itself to provide higher levels of service and the percentage decrease of the higher value progressive lenses was, as a consequence, not as severe as the fall in single vision and bi/tri focals. The percentage increases did recover after the recession in 2009 and in the case of progressive lenses that improvement has continued since 2013 when the sample only included independents and regional chains.
In terms of the overall percentage share of the lens market for the sample, things settled down around 2008 and since then the mix of the total volume has been in the region 70% single vision, 20 per cent progressive lenses and 10% bi/tri focal.
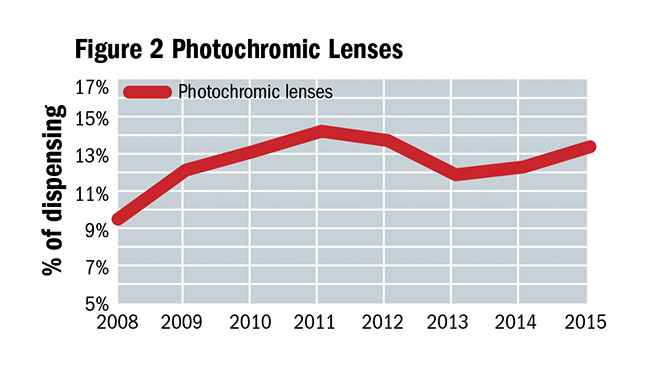
Since 2008 Index has also been tracking the percentage of the total spectacles dispensed with photo-chromic and anti-reflective treatments.
The percentage of Photo-chromics (Figure 2) shows an upward trend but almost a 2% fall when the sample transitioned to independent practices which has virtually been recovered.
The percentage of anti reflective coatings (Figure 3) has always been difficult to measure because some manufactures provide all their lenses pre-coated and the practices which make up the sample report between 0 and 100%. Again the percentage did fall with the change in the make-up of the sample but is now at a record level of 47%.
We saw a step change increase in 2013 for the percentage of re-glazes which the independent practices dispense up from 10 to 15% in 2013. This continues on an upward trend as customers show a propensity to buy more expensive frames which they don’t want to discard.
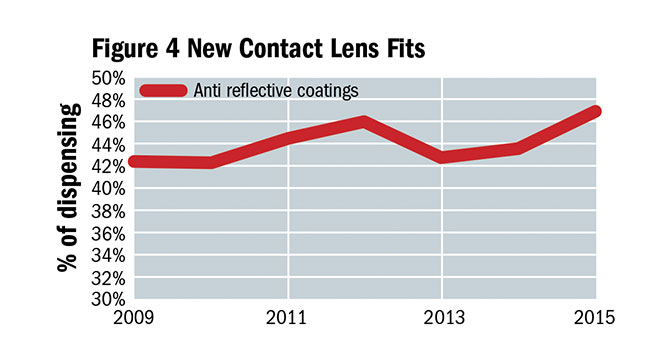
Optician Index has been tracking new contact lens fits (figure 4) and this is another example where we have seen significant growth in the 1990s followed by a fall in the percentage of new fits.
The shift to daily disposable lenses has seen the market continue to grow in terms of volume and value. After managing the initial growth phase and renewed interest at the time disposable lenses gained traction, the number of new fits has been in decline for the Index panel. As with the actual number of eye examinations it seems we have completed a cycle where the number of new fits is just 12% higher than the base year in 1993. GfKs last quarterly review, published in Optician showed that the largest growth segment of the market, toric and multi focal lenses, was being driven by the chains.
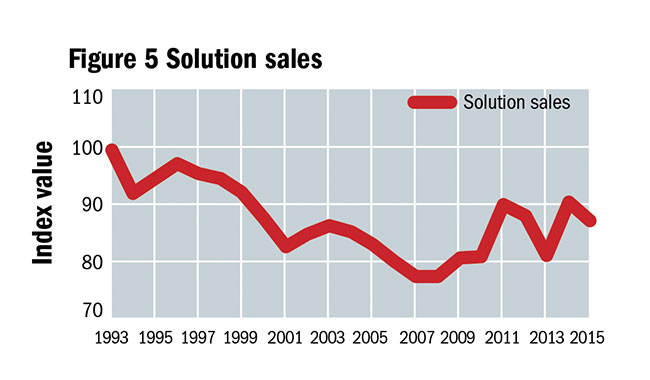
The downward trend in solution sales (Figure 5), caused by the availability of solutions in supermarkets and high street pharmacies and the move to disposable lenses, was reversed in 2010 but we attribute this to a change in the sample when a new multi national chain joined the Index panel.
In conclusion, the last 20 years has been a bit of a roller coaster and the success of the Specsavers model has had a significant impact. The independents and regional chains which survived have faced the competitive challenge thrown down by the national multiples. Those which are prospering have come to the realisation that their main threat now comes from other local independent practices. The national multiple chains compete with each other to attract new customers, retain their existing customers and improve their market share.
From 1993 to 2015 what’s really changed for the average opticians practice? (excluding Specsavers)
• Turnover has climbed steadily but not quite kept pace with inflation
• Turnover per eye examination has increased in line with the rate of inflation
• The number of eye examinations is practically the same
• The number of spectacles dispensed is practically the same but it sells more progressive lenses and added value treatments
• The number of new contact lens fits is practically the same and the value of solutions sold is down about 10%
The answer from a statistical perspective is not very much. The roller coaster train is back to the start point but most opticians want to stay on board. To complete the fairground analogy – ‘scream if you want to go faster’.
Read more


