 Last month the Index reported solid first half-year results for the financial indicators and an increase in the number of eye examinations. Over the past five years, July has seen a monthly decrease from June in the key performance measures, and though we have seen a fall in most of our indicators the financial benchmarks are stronger and show a significant improvement on the same month last year. This month our analysis focuses on eye examinations and dispensing over the past year and looks at the fees charged for private eye examinations and the amount of time allocated.
Turnover
Total practice turnover is 1 per cent higher than last month and 3 per cent higher than July last year, now at 168 Index points. Annual growth is effectively flat. Turnover per eye examination has increased this month by £6 to £186, £3 up on July last year but year-on-year growth is very slightly negative.
Total eye examinations and dispensing (Figure 1) shows the number of eye examinations carried out in July by our sample of independent opticians, was 3 per cent lower than last month at 93 Index points but this is 1 per cent higher than July 2014. After five months of consistent figures we have seen this benchmark fall in June and July of this year but the linear trend is positive and the moving average line, which was increasing steadily for the first part of this year, has now flattened
Sample average total dispensing decreased slightly from last month to an Index figure of 91 – this is a 3 per cent increase on July last year. After a strong performance in April and May of this calendar year the linear trend-line is as positive as that for eye examinations and the moving average is also showing a small increase. The series lines for eye examinations and dispensing volume broadly mirror each other.
Please note: a linear trend-line takes into account only the data shown on the chart, rather than historical values and a moving average takes into account historic values over 12 months.
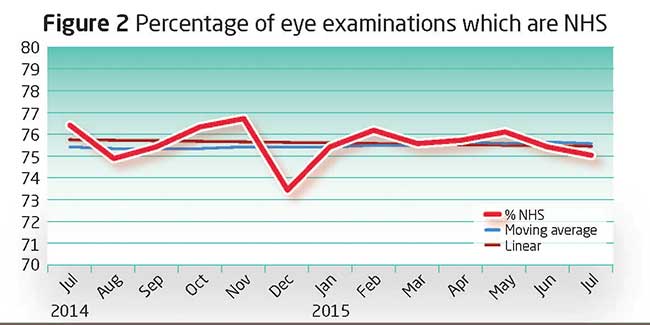
The percentage of examinations which are NHS (Figure 2) decreased marginally on last month to 75 per cent which is 1.5 percentage points lower than July last year. The linear trend is slightly negative and the moving average has hardly moved over the past 12 months.
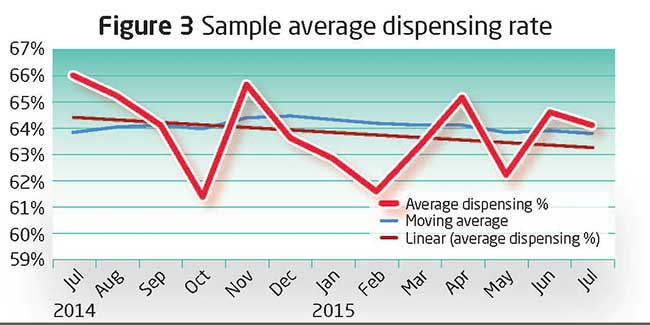
Average dispensing rate is the percentage of total eye examinations resulting in a prescription spectacle being purchased, which is calculated by dividing the total volume of spectacles dispensed by the number of eye examinations carried out. Figure 3 shows the average dispensing rate is 1 percentage point lower than last month at 64 per cent and this 2 percentage points lower than July last year. The moving average for this benchmarking was climbing in the second half of last year but falling through most of this calendar year and overall shows a negative trend resulting from the increase in the number of eye examinations carried out.
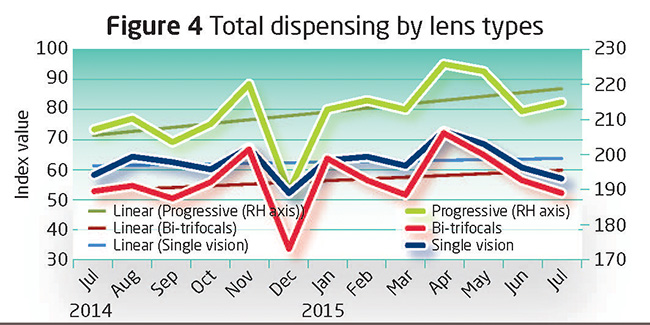
Lens breakdown by volume (Figure 4) shows that the linear trend for each of the three lens types is positive, with progressive outperforming the sales volume of single vision and bi/trifocal lenses. July saw a reduction in single vision lenses down to 57 Index points, 5 per cent less than June and 2 per cent lower than last July. Bi/trifocals recorded an Index value of 53 in July, 7 per cent lower than last month and 1 per cent lower than July 2014. Progressive lenses were 1 per cent lower than last month, at an Index value of 215 which is 4 per cent higher than July 2014.
Photochromic lenses were the same as last month at an average of 15 per cent of spectacles dispensed, 1 percentage point higher than July last year. Anti-reflective coatings are 3 percentage points higher than last month at 48 per cent of spectacles dispensed which is a 4 percentage point increase on July 2014. Re-glazes increased by 1 percentage point from June to 16 per cent, which is the same percentage as July 2014.
Fee charges
The market watch questions we posed to our panel this month were time allocated and fees charged for a standard private eye examination during week commencing June 29 2015.
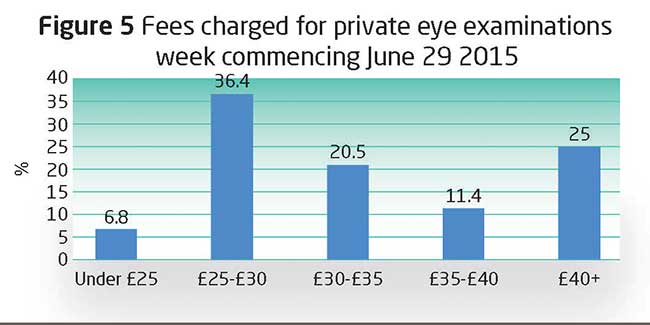
Examination fees charged ranged between £0 and £42; the average figure is £30.97 which is £1.21 lower than our survey 12 months ago. (Figure 5) shows the percentage of practices which charge fees in £5 stages. The largest group, 36 per cent of our sample, charge between £25 and £30 but the notable change from last year is the increase in the number of practices which charge a fee of £40 or more from 16 per cent to 25 per cent.
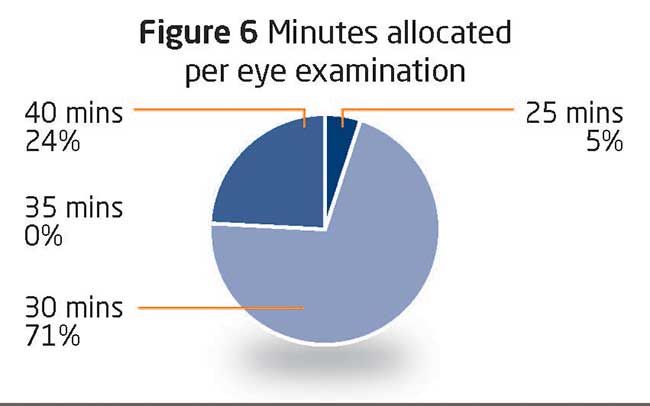
The minutes our panellists allocate for a standard private eye examination ranged between 25 and 40, with the majority 71 per cent allowing 30 minutes. The average amount of time is 32.3 minutes, up by 2.2 minutes on last year. The number allocating 40 minutes has increased by 8 percentage points from last year to 24 per cent.
All figures are adjusted to a 25-working-day month. In July 2015 there were 27 working days.
Summary
- Total practice turnover increases by 3 per cent from July last year to 168 Index points
- The number of eye examinations falls by 3 per cent from June to 93 Index points but this is 1 per cent higher than July last year
- Spectacles dispensed falls by 1 per cent from June to 91 Index points but this is a 3 per cent increase on July last year
- Sample average dispensing rate is 1 percentage point lower than June at 64 per cent and this is 2 percentage points lower than July last year
- Anti-reflective coatings applied to 48 per cent of spectacles dispensed which is 4 percentage points higher than July last year
- Number of practices charging £40 or more for a standard private eye examination increased from 16 per cent of the respondents to 25 per cent
Benefits of joining the index
- Monitor the practice performance of your practice month by month
- Customised reports benchmark your performance against your competitors
- Identify new trends quickly
- Optimise performance and establish competitive advantage
- Optician Index is free of charge to participating practices


