During October, all our benchmarks showed a slight fall from the results reported in September. Of greater concern, with the exception of progressive lens sales and turnover per eye examination, the figures were considerably lower than October 2014. In addition to our monthly analysis – as we have seen, the total number of eye examinations increasing year-on-year for our sample of independent opticians – we thought it would be interesting to take a closer look at how this has affected the dispensing rate and how the different size practices have performed.
Summary
- Total practice turnover is 2 per cent lower than September and October 2014 at 163 Index points
- Total number of eye examinations is 5 per cent lower than October 2014 at 97 Index points
- Practices in the lower turnover group have a higher average dispensing rate than those with higher revenue in
- October, but the overall rate is falling year on year
- Sample average total dispensing 2 per cent lower than September at 89 Index points, but annual growth is positive at almost 1 per cent
- Sales volume of single vision lenses fell by 5 per cent from September to 57 Index points
- New contact lens fits are 4 per cent lower than October 2014 and value of solutions sold 9 per cent lower than October last year
Turnover and eye examinations
Total practice turnover decreased by almost 2 per cent from September and from October last year to 163 Index points. The number of eye examinations fell by 1 per cent to 97 Index points from September and was 5 per cent lower than October 2014. Turnover per eye examination fell by £3 last month to £171, which was £9 higher than October 2014. The percentage of examinations that were NHS compared with private was marginally lower than September, at 75 per cent, which is almost 1 and a half percentage points lower than October last year.
Dispensing
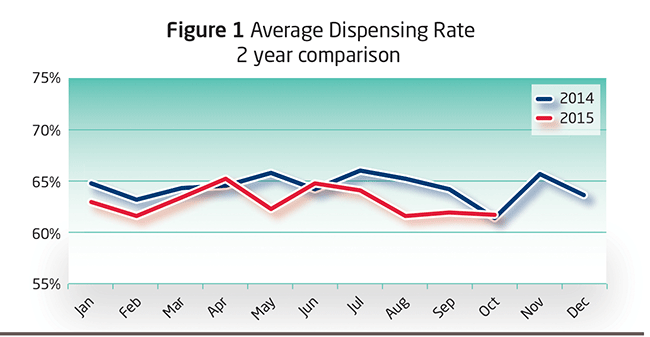
The average dispensing rate is the percentage of total eye examinations resulting in a prescription spectacle being purchased, which is calculated by dividing the total volume of dispensing by the number of eye examinations carried out. In October, the dispensing rate was 62 per cent, which was the same as September and fractionally higher than October last year. (Figure 1) shows the comparison for this rate over the past two years.
For the first half of 2015, the dispensing rate was broadly flat and failed to match the same period as in 2014. In the second half of this year, the dispensing rate has fallen, with a widening gap between last year’s performance derived from an increase in the number of eye examinations and the number of spectacles dispensed remaining flat, as noted later. The average monthly dispensing rate for the first 10 months of the year was almost 1 and a half percentage points lower than the same period in 2014, at 63 per cent.
Average dispensing rates differed significantly between practices (Figure 2). In October, the sample had a minimum dispensing rate of 31 per cent and a maximum of 135 per cent, which were both reported by practices in the middle turnover group. A figure of more than 100 per cent can be explained by patients electing to take their prescription to that practice for fulfilment, deferring a purchase decision, having completed the eye examination in a previous month, or by purchasing two or more pairs of spectacles.
The chart shows our sample in turnover groups for October. The lower quartile in each turnover group represents the 25 per cent returning the lowest dispensing rates for the month. The median quartile represents the middle group, 50 percent of the sample, and the upper quartile is the 25 per cent recording the highest dispensing rates for the month. Generally, it is not appropriate to report in averages as sample practices vary considerably However, with a quartile analysis, they become more meaningful. To identify where your practice fits and assess performance against the sample, calculate your gross practice turnover and dispensing rate for October, and identify which quartile you fall into. In all turnover groups, if your practice is in the lower quartile, it is perhaps possible for you to re-evaluate your range of products, make operational changes to improve service or reduce the number of prescription-only clients. If your practice is in the upper quartile, the challenge is to ensure you maintain this level by continuing to evaluate all aspects of your business.
For our sample, the averages showed that the lower turnover group produced the highest average dispensing rate of 71 per cent during October, with the two other turnover groups on the same average at 58 per cent. In the lower quartiles for each turnover group, the difference was negligible, but the upper quartile in the lower turnover group outperformed the other two groups significantly. Twelve months ago, the same analysis showed the higher turnover group outperforming the middle turnover group, but this was based on just one months’ figures.
For sample average total dispensing, the Index value of the total number of spectacles of all lens types sold (Figure 3) showed the peak this year shifting from May to April, and although flat for the second half, was almost 1 per cent year-on-year growth. October saw a decrease of 2 per cent on September to 89 Index points, which was almost the same as October 2014’s figure.
Lenses
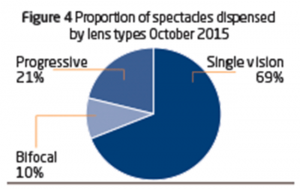
The lens mix (Figure 4) in October was 69 per cent single vision, 21 per cent progressive and 10 per cent bi/trifocals. The changes compared with last year, were a 1 percentage point reduction in single vision lenses and 1 percentage point increase in progressive lenses.
Single vision lenses reduced by 5 per cent from September to 57 Index points, 4 per cent lower than October 2014. Bi/trifocals decreased by 5 per cent from September to 53 Index points, 6 per cent lower than October last year. Progressive lens sales were down fractionally on September, at 212 Index points, which was 1 per cent higher than October last year. Progressive and bi/trifocal lenses showed positive annual growth, while single vision lenses were negative.
New contact lens fits were down by 1 per cent to 108 Index points from September and were 4 per cent lower than October last year. The value of solutions sold was also lower than September at 78 Index points, which was 9 per cent lower than October 2014. Over the past 12 months we have reported a general fall in new contact lens fits and the value of solutions by our sample of independent opticians.
Last month, GfK reported (Optician 30.10.2015) a quarterly increase in the sales value of contact lenses and care products, but made clear that this was being driven by the national multiples.
Please note all figures shown are adjusted to a 25-working-day month. In October 2015, there were 27 working days.
Benefits of joining the index
- Monitor the practice performance of your practice month by month
- Customised reports benchmark your performance against your competitors
- Identify new trends quickly
- Optimise performance and establish competitive advantage
- Optician Index is free of charge to participating practices


