The retina is one of the most metabolically active tissues in the body, consuming oxygen more rapidly than the brain.1 With such a high oxygen demand, the retina must have an extensive vascular network to maintain functionality.
The human retina is supplied by two sources: the central retinal artery (CRA) and the choroidal blood vessels, both of which originate from the ophthalmic artery. The inner retina is supplied by the CRA, which receives 20-30% of the total ocular blood flow and enters the eye at the optic nerve head where it divides into two major branches. These branches in turn divide into arterioles (superior, inferior, nasal and temporal), which extend away from the optic disc to supply separate areas of the retina (figure 1).
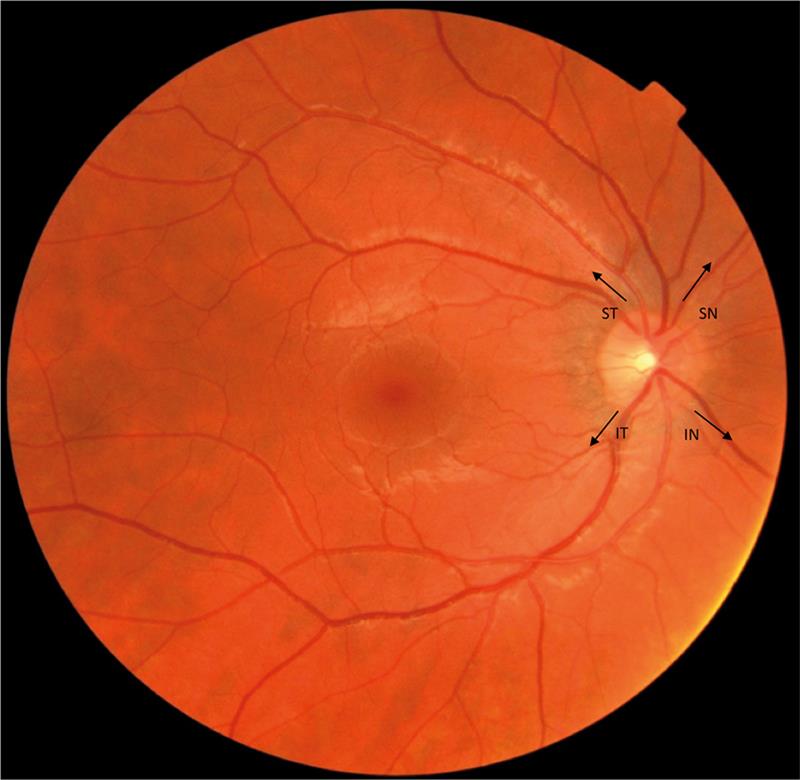
Figure 1: A fundus photograph showing the retinal blood supply to the superior temporal (ST), superior nasal (SN), inferior temporal (IT) and inferior nasal (IN) arcades
The larger retinal arteries lie in the retinal nerve fibre layer (RNFL), just beneath the internal limiting membrane (figure 2). These blood vessels can be visualised with OCT as hyperreflective columns with shadows underneath them. Retinal arterioles give rise to a plexus of capillaries which form an interconnecting network: the first capillary layer is located in the RNFL and ganglion cell layer, while the second capillary layer extends down to the inner nuclear layer (figure 3).2

Figure 2: Retinal layers, imaged with swept source OCT allowing clear visualisation of the choroid

Figure 3: Oxygen distribution throughout the retina. Red circles represent blood vessels; blue arrows show the direction of oxygen diffusion. The retinal blood supply primarily supplies the inner retinal layers, while the choroid supplies the outer avascular retinal layers
A third capillary network – the radial peripapillary capillaries (RPCs) – form the most superficial layer of capillaries, lying in the inner RNFL and extend 4-5mm from the optic disc.3 The retinal blood supply is primarily responsible for maintaining the inner retinal layers, though oxygen supply can extend down to the inner photoreceptors during dark adaptation when oxygen demand is incredibly high.
The choroid receives 65-85% of ocular blood flow4 and is vital for the maintenance of the avascular outer retinal layers, particularly the photoreceptors. It is also responsible for supply to the foveal avascular zone which extends across a diameter of 450-600 microns. It has the highest perfusion rate of any vascular bed within the human body, reflecting the high metabolic activity of the photoreceptors.5 The vascular bed of the choriocapillaris lies adjacent to Bruch’s membrane and is supplied primarily by the long and short posterior ciliary arteries (branches of the ophthalmic artery), with minor contribution from the anterior ciliary arteries. Each posterior ciliary artery supplies a localised region of the choroid by breaking up into fan-shaped lobules of capillaries.6 The choroidal circulation has a very low rate of oxygen extraction resulting in a low arteriovenous oxygen saturation difference and a high venous oxygen tension.7, 8 Choroidal blood is thought to be drained exclusively through the vortex veins, with one or two vortex veins draining each of the four quadrants of the eye.9 The vortex veins penetrate the sclera to merge with the ophthalmic vein.
Both the retinal and choroidal vasculature show changes with age. Retinal vessels undergo ageing changes including atherosclerosis and loss of cellularity in the peripheral capillaries, combined with attachment of the inner limiting membrane to the peripheral vascular arcades.10 The number of capillaries around the fovea also reduce with advancing age.11-13 Choroidal thickness is seen to decrease significantly with increasing age, as measured histologically and in-vivo using swept source OCT (figure 4). As the photoreceptors rely upon the choroidal vasculature for nourishment, a reduction in choroidal thickness may lead to reduced supply of oxygen and nutrients and cause photoreceptor damage.14, 15

Figure 4: Age-related decrease in choroidal thickness. Choroidal thickness in a 25-year-old (A) and a 70-year-old (B), measured with OCT
Retinal oxygen consumption
The retinal oxygen distribution varies across the retina in accordance with the retinal cell class and their associated level of metabolic activity. The highest oxygen tension is found in the choroid, and the lowest at the level of the photoreceptor inner segments, reflecting the high oxygen consumption rate of the tightly packed mitochondria in this region16. While the choroid has a high oxygen tension, the extraordinarily high oxygen demand of the photoreceptors, combined with the avascular nature of the outer retina, results in a substantially increased risk of these cells experiencing hypoxic episodes. This risk is further increased in dark adapted conditions when the inner segments have a higher oxygen demand in order to produce the ATP necessary to maintain the dark current.7, 17, 18
Studies show that the choroid contributes approximately 90% of the oxygen consumed by the photoreceptors in the darkness, and all of the oxygen consumed during light adaptation.19 In order to maintain sufficient oxygenation, the outer retina may increase oxygen use from the deep retinal capillaries,20 suggesting a dynamic regulation of the outer retinal oxygen supply.
Knowledge of the high oxygen demand of the photoreceptors underpins the use of traditional panretinal laser photocoagulation (PRP) in diabetic retinopathy. Lasers used in PRP target the pigment in the RPE, causing thermal tissue damage after absorption of energy. This causes destruction of adjacent photoreceptors, thereby reducing the oxygen consumption of the outer retina, improving inner retinal oxygen supply and resulting in reduced levels of retinal hypoxia. This in turn reduces the production of growth factors such as vascular endothelial growth factor, which promote the development of new blood vessels in proliferative diabetic retinopathy.21,22
In recent years, prevention of dark adaptation with night-time retinal illumination has been suggested as a possible treatment option for diabetic patients. This treatment is once again based upon the hypotheses that the rod system may be a major contributor to the development and progression of diabetic retinopathy due to their high oxygen consumption during dark adaptation causing relative hypoxia, provoking microvascular changes.23,24,25 This theory is further supported by the absence of diabetic retinopathy in patients with retinitis pigmentosa.24 Clinical trials investigating use of light therapy in diabetic patients have shown promising results, with regression of macular oedema and improved visual function seen over a six-month period of treatment in one trial26 and a reduction in the number of haemorrhages and microaneurysms over a three-month period in another.27
There is an increasing body of evidence suggesting that retinal hypoxia also contributes to the pathogenesis of age-related macular degeneration (AMD).28,29 This has led to the commencement of a multicentre, randomised control trial, ALight, which is investigating the effect of night time low level light therapy on AMD disease progression.30
Imaging the retinal and choroidal vasculature
Fundus photography
There are now many ways in which the retinal – and to a lesser extent the choroidal – vasculature can be imaged. Now used in the majority of optometric practices, true colour fundus photography offers a quick, non-invasive method of capturing and documenting the fundus. With this method, vasculature can be easily assessed over the central 45º. Digital retinal photography has become the mainstay of documentation of diabetic retinopathy and the methodology of choice for retinal screening. For the purposes of diabetic screening, colour fundus photography is suggested to be best for demonstrating the presence of white lesions, such as exudates and cotton wool spots, while red-free images are considered superior for assessment of vasculature, haemorrhages and microaneurysms (figure 5).21

Figure 5: True colour (A) and red-free (B) fundus photography showing a superotemporal branch retinal vein occlusion. Red-free fundus photography increases contract between the blood and the surrounding retina, enhancing visualization of retinal vascular defects
Fluorescein angiography
While colour and red-free fundus photography enable visualisation of retinal haemorrhages, they do not enable assessment of vascular leakage or capillary drop out. However, both of these can be assessed with fundus fluorescein angiography (FFA) in a hospital setting. FFA involves intravenous injection of fluorescein, an orange water-soluble dye, and surveillance of the passage of fluorescein through the retinal and choroidal circulation. Photographic capture of FFA requires excitation of the fluorescein with a blue light, then capture of the green emission; this requires the use of a blue excitation filter and a yellow-green barrier filter to allow capture of only the emitted green light. FFA capture takes up to 20 minutes so that all phases of blood flow, from arterial, through to early, mid and late venous flow, can be documented (figure 6).

Figure 6: Healthy fundus fluorescein angiography (FFA), showing complete arterial filling and early lamellar venous flow in the arteriovenous phase
While FFA can provide valuable information on vascular leakage or drop out to aid in diagnosis of retinal conditions, it does not come without its complications; side effects include nausea, vomiting, itching, headache, fainting and very rarely anaphylaxis and bronchospasm.31 Because of the risk of anaphylactic shock, a resuscitation team must be available. This, together with the need for an injection-trained nurse and the length of the procedure, makes FFA a costly exercise.
While FFA allows for assessment of the retinal circulation, information on the choroidal vasculature is limited due to signal blocking by the RPE. Indocyanine green (ICG) angiography allows for evaluation of the choroid as ICG emits light in the near-infrared spectrum, which is scattered significantly less than the shorter wavelength emission of fluorescein. ICG is indicated to aid in the diagnosis of occult choroidal neovascularisation (CNV) (ie when the CNV grows beneath the RPE), polypoidal choroidal vasculopathy, chronic central serous retinopathy (CSR) and white dot syndrome.32
Optical coherence tomography
Although conventional OCT is not terribly useful for assessment of the retinal vasculature, it provides an excellent method for assessment of fluid leakage from either leaky or new blood vessel growth in the retinal and choroidal circulation. Fluid can be classified as: intraretinal, when it lies between the internal limiting membrane and the external limiting membrane; subretinal, when it lies beneath the photoreceptors but above the RPE; or sub-RPE, when the fluid lies beneath the RPE. The location of fluid accumulation can help aid in disease classification; when fluid is located only in the intraretinal space, a break down in the blood retinal barrier is implicated, however, if fluid is only located in only the subretinal and/or the sub-RPE space, a break down in the outer blood-retinal barrier (ie the choroid) is implicated (figure 7).

Figure 7: OCT scans showing intraretinal fluid leakage from the retinal circulation resulting in cystoid macular oedema secondary to branch retinal vein occlusion (A), subretinal fluid in CSR secondary to fluid leakage from hyperpermeable choroidal vessels (B), and subretinal fluid in wet AMD secondary to fluid leakage from a choroidal neovascular membrane in the sub-RPE space
Assessment of the choroid is possible with the enhanced imaging capabilities of swept source OCT or with enhanced depth imaging combined with spectral domain OCT. Examination of the choroid with OCT in-vivo has revealed an age-related decrease in choroidal thickness with age by an average of 25 microns per decade (Figure 3).33 OCT has also enabled examination of choroidal thickness in diabetes, revealing an overall decrease in thickness for all grades of diabetes compared to healthy eyes. If choroidal thinning in diabetes is indicative of loss of the choriocapillaris, then this may contribute to increased susceptibility to retinal hypoxia and ischaemia, which as discussed earlier in this article is believed to drive diabetic retinopathy progression.34 Pathological changes in choroidal thickness has also been observed in CSR,35 wet and dry AMD36 and uveitis37.
OCT angiography
The most significant recent development in OCT imaging is the advent of OCT angiography (OCTA). OCTA enables fast, easy, non-invasive, three-dimensional imaging to visualise intravascular blood flow within the retina and choroid.38 OCTA offers a quicker and safer alternative to fundus fluorescein angiography, which as discussed earlier does not come without risk. Acquisition of OCTA images requires B-Scans to be captured multiple times at the same location, with images compared to assess motion contrast which is presumed to correspond to angiographic flow as blood is the primary cause of signal change.39 OCTA provides both structural and functional information of ocular microvasculature (figures 8 and 9).

From left: Figure 8: OCTA showing the superficial (A) and deep (B) retinal capillary plexi around the fovea in a healthy retina. Note the visualisation of the foveal avascular zone. Figure 9 (right): OCTA of a healthy optic nerve head showing the radial peripapillary capillaries
OCTA has been shown to be a useful imaging modality for the evaluation of common ophthalmic diseases including AMD, diabetic retinopathy and glaucoma. In AMD, OCTA has been shown to be able to non-invasively detect CNVM (figure 10), where the vascular membranes are described as ‘seafan’-like or ‘tree’-like in pattern.40 In diabetes, OCTA has enabled assessment of the foveal avascular zone which has been shown to sequentially enlarge in each of the stages of diabetic retinopathy (figure 11).41 OCTA is also a useful tool for the evaluation of optic disc perfusion in glaucomatous eyes (figure 9), where the peripapillary network has been shown to be attenuated in both the superficial and deep capillary plexuses.42

Figure 10: OCTA showing a choroidal neovascular membrane within the outer retina (pale blue box) in wet AMD

Figure 11: OCTA showing retinal capillary non-perfusion with drop out of capillaries in the superficial (top row, orange box) and deep capillary plexi (top row green box) in a diabetic macular ischaemia. The OCT B-Scan (bottom left) shows secondary retinal thinning of the inner retinal layers
Discussion
Knowledge of the retinal and choroidal vasculature and the ways in which it can be assessed is vitally important in the diagnosis and management of a vast range of ocular conditions. The emergence of OCT enables optometrists to more closely inspect the retinal and choroidal circulation and to locate areas of pathological fluid leakage. OCTA represents an exciting development in ocular imaging, giving further diagnostic ability to optometrists in practice, enabling for the first time, non-invasive assessment of ocular blood flow aiding in the detection of neovascular membranes in AMD and capillary drop out in vascular disorders.
The capabilities of OCTA are only just being realised and will undoubtedly increase as understanding of this technology increases.
Dr Rachel Hiscox is education and clinical affairs manager, UK & Ireland for Topcon (GB) Ltd and an optometrist with experience in hospital and private practice. With thanks to Tim Cole for providing the OCT images included in this article.
References
1 Ames, A., 3rd (1992). Energy requirements of CNS cells as related to their function and to their vulnerability to ischemia: a commentary based on studies on retina Can J Physiol Pharmacol 70 Suppl: S158-64.
2 Pournaras, C.J., et al. (2008). Regulation of retinal blood flow in health and disease Prog Retin Eye Res 27(3): 284-330.
3 Zhang, H.R. (1994).Scanning electron-microscopic study of corrosion casts on retinal and choroidal angioarchitecture in man and animals Progress in Retinal and Eye Research 13(1): 243-270.
4 Kolb, H., Simple Anatomy of the Retina, in Webvision: The Organization of the Retina and Visual System, H. Kolb, E. Fernandez, and R. Nelson, Editors. 1995: Salt Lake City UT.
5 Maleki, N., et al. (2011). The effect of hypercarbia and hyperoxia on the total blood flow to the retina as assessed by magnetic resonance imaging Invest Ophthalmol Vis Sci 52(9): 6867-74.
6 Hayreh, S.S. (1975). Segmental nature of the choroidal vasculature Br J Ophthalmol 59(11): 631-48.
7 Lange, C.A. and J.W. Bainbridge (2012). Oxygen sensing in retinal health and disease Ophthalmologica 227(3): 115-31.
8 Alm, A. and A. Bill (1972). The oxygen supply to the retina. II. Effects of high intraocular pressure and of increased arterial carbon dioxide tension on uveal and retinal blood flow in cats. A study with radioactively labelled microspheres including flow determinations in brain and some other tissues Acta Physiol Scand 84(3): 306-19.
9 Ruskell, G.L. (1997). Peripapillary venous drainage from the choroid: a variable feature in human eyes Br J Ophthalmol 81(1): 76-9.
10 Cogan, D. (1963). Development and senescence of the human retinal vasculature. Doyne memorial lecture. Trans Ophthalmol Soc UK 83: 465-91.
11 Grossniklaus , H., et al. (2013).Anatomic alterations in aging and age-related diseases of the eye Invest Ophthalmol Vis Sci 54(15): Orsf23-7.
12 Bindewald-Wittich, A., et al. (2006). Two-photon-excited fluorescence imaging of human RPE cells with a femtosecond Ti:Sapphire laser Invest Ophthalmol Vis Sci 47(10): 4553-7.
13 Grunwald, J., et al. (1993). Effect of aging on retinal macular microcirculation: a blue field simulation study Invest Ophthalmol Vis Sci 34(13): 3609-13.
14 Ikuno, Y., et al. (2010).Choroidal thickness in healthy Japanese subjects Invest Ophthalmol Vis Sci 51(4): 2173-6.
15 Margolis, R. and R. Spaide (2009). A pilot study of enhanced depth imaging optical coherence tomography of the choroid in normal eyes. American Journal of Ophthalmology 147(5): 811-5.
16 Cringle, S.J., et al. (2002). Intraretinal oxygen consumption in the rat in vivo Invest Ophthalmol Vis Sci 43(6): 1922-7.
17 Linsenmeier, R.A. (1986). Effects of light and darkness on oxygen distribution and consumption in the cat retina J Gen Physiol 88(4): 521-42.
18 Kimble, E.A., R.A. Svoboda, and S.E. Ostroy (1980). Oxygen consumption and ATP changes of the vertebrate photoreceptor Exp Eye Res 31(3): 271-88.
19 Linsenmeier, R.A. and R.D. Braun (1992). Oxygen distribution and consumption in the cat retina during normoxia and hypoxemia J Gen Physiol 99(2): 177-97.
20 Caprara, C. and C. Grimm (2012). From oxygen to erythropoietin: relevance of hypoxia for retinal development, health and disease Prog Retin Eye Res 31(1): 89-119.
21 RCOphth. Royal College of Ophthalmologists. Diabetic Retinopathy Guidelines 2012. 2012 30th June 2016]; Available from: http://www.rcophth.ac.uk/page.asp?section=451
22 Stefansson, E. (2001).The therapeutic effects of retinal laser treatment and vitrectomy. A theory based on oxygen and vascular physiology Acta Ophthalmol Scand 79(5): 435-40.
23 Arden, G.B., J.E. Wolf, and Y. Tsang (1998).Does dark adaptation exacerbate diabetic retinopathy? Evidence and a linking hypothesis Vision Res 38(11): 1723-9.
24 Arden, G.B. (2001).The absence of diabetic retinopathy in patients with retinitis pigmentosa: implications for pathophysiology and possible treatment Br J Ophthalmol 85(3): 366-70.
25 Arden, G.B., et al. (2005).Spare the rod and spoil the eye Br J Ophthalmol 89(6): 764-9.
26 Arden, G.B., et al. (2011).Regression of early diabetic macular oedema is associated with prevention of dark adaptation Eye (Lond) 25(12): 1546-54.
27 Arden, G.B., et al. (2010).A preliminary trial to determine whether prevention of dark adaptation affects the course of early diabetic retinopathy Eye (Lond) 24(7): 1149-55.
28 Feigl, B. (2009).Age-related maculopathy - linking aetiology and pathophysiological changes to the ischaemia hypothesis Prog Retin Eye Res 28(1): 63-86.
29 Stefansson, E., A. Geirsdottir, and H. Sigurdsson (2011).Metabolic physiology in age related macular degeneration Prog Retin Eye Res 30(1): 72-80.
30 McKeague, C., et al. (2014). Low-level night-time light therapy for age-related macular degeneration (ALight): study protocol for a randomized controlled trial Trials 15: 246.
31 Jennings, B.J. and D.E. Mathews (1994). Adverse reactions during retinal fluorescein angiography J Am Optom Assoc 65(7): 465-71.
32 Stanga, P.E., J.I. Lim, and P. Hamilton (2003).Indocyanine green angiography in chorioretinal diseases: indications and interpretation: an evidence-based update Ophthalmology 110(1): 15-21; quiz 22-3.
33 Abbey, A.M., et al. (2015). Optical coherence tomography measurements of choroidal thickness in healthy eyes: correlation with age and axial length Ophthalmic Surg Lasers Imaging Retina 46(1): 18-24.
34 Esmaeelpour, M., et al. (2011). Mapping choroidal and retinal thickness variation in type 2 diabetes using three-dimensional 1060-nm optical coherence tomography Invest Ophthalmol Vis Sci 52(8): 5311-6.
35 Chung, Y.R., et al. (2016). Choroidal thickness in patients with central serous chorioretinopathy: Assessment of Haller and Sattler Layers Retina.
36 Fein, J.G., et al. (2014). Analysis of short-term change in subfoveal choroidal thickness in eyes with age-related macular degeneration using optical coherence tomography Ophthalmic Surg Lasers Imaging Retina 45(1): 32-7.
37 Freitas-Neto, C.A., et al. (2016). Increased Submacular Choroidal Thickness in Active, Isolated, Extramacular Toxoplasmosis Ophthalmology 123(1): 222-4.e1.
38 Huang, Y., et al. (2014). Swept-source OCT angiography of the retinal vasculature using intensity differentiation-based optical microangiography algorithms Ophthalmic Surg Lasers Imaging Retina 45(5): 382-9.
39 Zhang, A., et al. (2015). Methods and algorithms for optical coherence tomography-based angiography: a review and comparison J Biomed Opt 20(10): 100901.
40 Kuehlewein, L., et al. (2015). Optical Coherence Tomography Angiography of Type 1 Neovascularization in Age-Related Macular Degeneration Am J Ophthalmol 160(4): 739-48.e2.
41 Takase, N., et al. (2015). Enlargement of foveal avascular zone in diabetic eyes evaluated by en face optical coherence tomography angiography Retina 35(11): 2377-83.
42 Jia, Y., et al. (2014).Optical Coherence Tomography Angiography of Optic Disc Perfusion in Glaucoma Ophthalmology 121(7): 1322-1332.