Some individuals experience discomfort and anomalous visual perceptual distortions when they observe patterns of stripes with particular spatial characteristics.
What is pattern glare?
The visual system evolved to analyse scenes from nature (figure 1). Natural scenes have a characteristic Fourier power spectrum in which the low spatial frequencies have more power and the high spatial frequencies less, according to a simple function of spatial frequency.1

Figure 1: An image from nature
The most unnatural image is one in which all the contrast energy is concentrated in one orientation, and at a limited range of phases and spatial frequencies, such as the scene in figure 2.
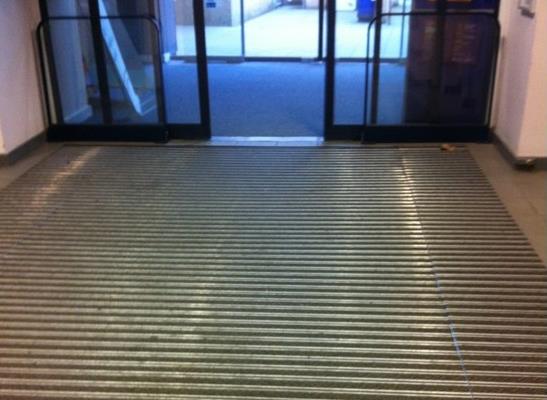
Figure 2: An aversive grating
The image that results approximates a grating and the grating is unpleasant to look at if it has a spatial frequency close to that at which the visual system is generally most sensitive – about three cycles/degree.2 Gratings with these spatial characteristics induce a strong neurological response within the visual system:
- they are readily seen at low contrast.3
- they interfere with vision, masking low contrast images.4
- they induce a visual evoked potential of relatively high amplitude.5
- they induce a large haemodynamic response,6 consistent with the inefficient neural processing suggested by computer models.7
Such gratings also give rise to perceptual distortions of colour, shape and movement.2 The cluster of symptoms of perceptual distortion and discomfort that periodic visual patterns evoke is sometimes called pattern glare. Pattern glare can be appreciated by viewing figure 4. The symptoms of perceptual distortion include colours and shadows within the black and white lines, blurring or bending of the lines and fading of the pattern, sometimes in patches. These perceptual distortions are often accompanied by discomfort and somatic symptoms that can include nausea, dizziness and eye ache.2 In patients with photosensitive epilepsy the pattern can sometimes induce seizures.8
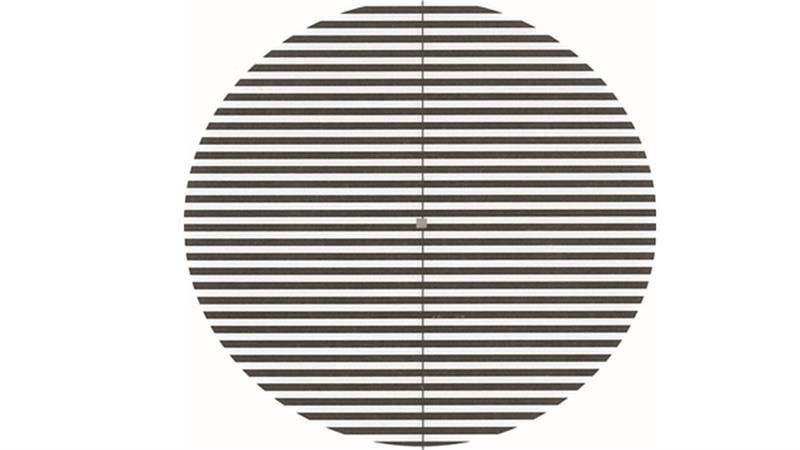
Figure 4: Pattern 2 of the Pattern Glare Test reproduced at reduced size. To appreciate the visual effect, view actual size (diameter 10cm)
Why is pattern glare important?
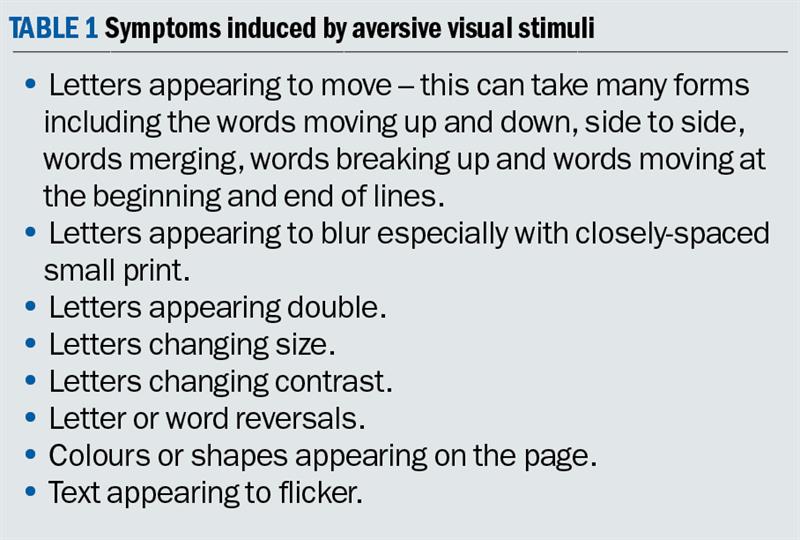
Pattern glare is important in optometric practice because it can be used to quantify an aspect of abnormal visual function in patients who are symptomatic but optometrically normal. The symptoms usually include headaches or discomfort, particularly when reading. The pattern shown in figure 4 is one of the most aversive visual stimuli that patients are likely to encounter in everyday life. In consequence, it may provoke discomfort and distortions that help interpret symptoms that are otherwise experienced only outside the consulting room and often only after an extensive period of reading. Suspicious symptoms that may present are summarised in table 1.
Some readers find individually selected coloured filters helpful for reading.9 Hollis and Allen10 found that asking people about the presence of symptoms of pattern glare predicted a benefit in reading speed with an individually chosen coloured overlay, and it did so better than asking about previous symptoms.
Physiological mechanisms of pattern glare
It is easier to describe the mechanisms that are not responsible for pattern glare than those that are. For example, there are three studies that indicate that pattern glare is independent of the accommodative response. The first study was by Evans et al11 who found no significant relationship between pattern glare and binocular instability (assessed as vergence amplitude). The second study was conducted by Haigh et al12 who directly measured the accommodative response (lag and fluctuations) when participants observed gratings. The gratings were a variety of colours, some comfortable and some less so. The accommodative response was the same for all gratings whether comfortable or not, regardless of the spectral composition of their colours.
Thirdly, Monger et al13 investigated the effect of viewing distance on symptoms of pattern glare, thereby indirectly measuring the effect of accommodation and convergence on symptoms. Grating targets were presented at different viewing distances while the retinal size and spatial frequency of the targets remained constant (0.3, 2.3 and 9.4 cycles per degree). One hundred young adults were asked to grade the presence of 15 symptoms and the results were analysed both with respect to the severity of symptoms and as regards the number of symptoms reported for each target. The list included symptoms of discomfort (pain, discomfort, nausea, dizziness and unease) in addition to visual perceptual distortions (red, green, blue, yellow, bending of lines, blurring of lines, shimmering of lines, flickering, fading, and shadowy shapes among the lines). The number and severity of symptoms varied with spatial frequency but did not change with viewing distance, suggesting that accommodation and convergence were not related to symptoms of pattern glare. This was true for both perceptual symptoms and somatic symptoms.
It is not possible to attribute symptoms of pattern glare simply to uncorrected refractive error, although uncorrected refractive error can lead to similar symptoms. In the study by Monger et al13 all participants were fully corrected.
One possible mechanism for pattern glare is a hyperexcitability of cells in the visual cortex. Georgeson14 proposed that some of the illusions of shape derived not from retinal factors but from inhibitory interactions within the striate cortex. Wilkins et al2 argued that similar mechanisms might apply to illusions of colour and motion, given that these illusions are often integrated with those of shape in a unitary percept. They showed that the patterns that were most aversive and gave the most illusions were those that were also capable of inducing paroxysmal electroencephalogram (EEG) abnormalities in patients with pattern-sensitive epilepsy. More recently Huang et al6,15 demonstrated that the patterns induce a large haemodynamic response in the visual cortex, a response that is abnormally large in individuals with migraine, who are particularly susceptible to pattern glare.2,16
Current methods of examining pattern glare
Pattern glare is usually assessed by the Pattern Glare Test (IOO sales, London).
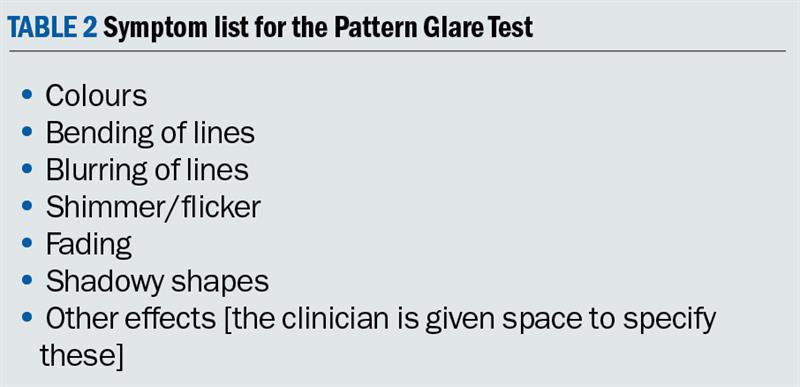
The test was first published in 2001 and reprinted with higher quality in 2003. The test consists of three patterns of horizontal stripes that are circular in outline, of high contrast, have even width and spacing of the stripes, and are viewed binocularly. The patterns have a diameter that subtends an angle of 13.6º at the eye when viewed at 0.4m. The practitioner shows each pattern in turn and asks whether the patient experiences any of the seven symptoms listed in table 2. The number of reported symptoms provides a score for each pattern that is then compared to normal values.17 The normal range of scores is not valid if the practitioner uses a list of questions that differs from that in table 1, and if the methods of asking the questions differ from those used by Evans and Stevenson who collected the norms.17 However, it is worth noting in this study that participants were initially familiarised with the list of symptoms, shown each pattern for five seconds, and asked subsequently to identify the illusions they experienced. This procedure was altered when it became apparent participants looked at the grating for five seconds, answered with respect to the first item in the list and then looked again before answering with respect to the remainder, resulting in a greater overall exposure to the grating. Consequently, the method was changed so that the examiner asked the participants to view the grating for five seconds, turn it over, and then respond with respect to each item on the list.18
Pattern 1 of the Pattern Glare Test (figure 3) has a spatial frequency of 0.3 cycles per degree (cpd) when viewed at 0.4m. It is innocuous, a control designed to detect people who acquiesce to questions from an examiner.17
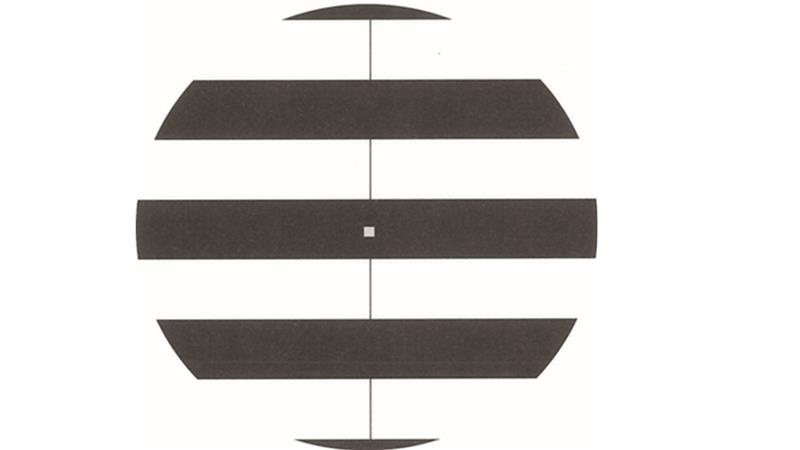
Figure 3: Pattern 1 of the Pattern Glare Test
Pattern 2 (2.3cpd at 0.4m, figure 4) has characteristics similar to a 3cpd pattern that was found to maximally elicit pattern glare,2 and should induce the maximum number of symptoms in individuals who experience pattern glare in everyday life. According to Evans and Stevenson17 it is abnormal to report more than three symptoms for Pattern 2. Of course, the norms apply only when the methods used by Evans and Stevenson are adhered to. As described above, these authors showed the pattern for five seconds and then had the patient report the symptoms from the list. In other studies10 the examiner asked a question concerning the presence or absence of each symptom in turn while the patient observed each grating. It is possible that the number of symptoms elicited by such methods is greater.
The characteristics of Pattern 2 are similar to those most likely to provoke epileptiform EEG abnormalities in people with photosensitive epilepsy.2 For this reason, the Pattern Glare Test should not be used with patients who have a history of seizures or unexplained faints or neurological episodes.
It is difficult to print patterns with high spatial frequency without artefacts. This limits the spatial frequency of Pattern 3 (figure 5). Pattern 3 has a spatial frequency of 13.4 cycles per cm (9.4cpd at 0.4m). Higher spatial frequencies can be obtained by using viewing distances greater than 0.4m, although the subtense of the pattern is then reduced.
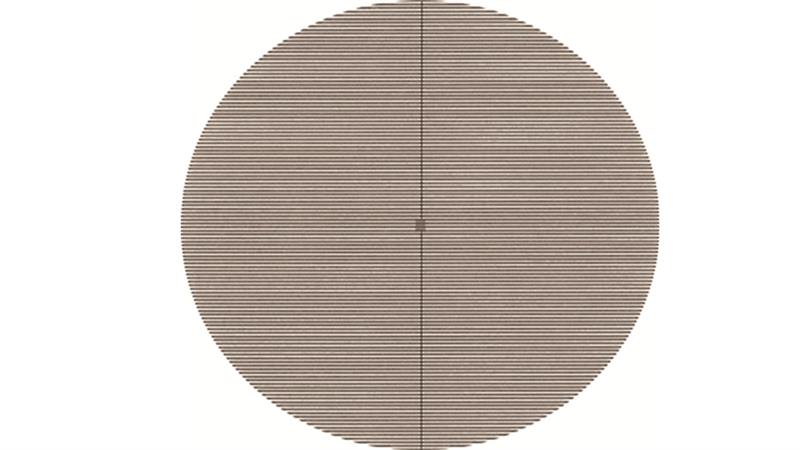
Figure 5: Pattern 3 of the Pattern Glare Test
People who experience low levels of pattern glare may find targets with high spatial frequencies perceptually more unstable than Pattern 2, probably because at high spatial frequencies their reaction to the pattern is more dependent on anomalies of refraction and accommodation than neurological effects.19
What are the shortcomings of current methods?
Viewing distance. If it is used only at 0.4m, the current version of the Pattern Glare Test does not include a test plate with a spatial frequency high enough to study the decrease in illusions typical at high spatial frequencies. The viewing distance is critical in determining the response to Pattern 3 but less critical for Patterns 1 and 2 because of the manner in which susceptibility varies with spatial frequency. If the viewing distance is increased to 0.6m the illusions should be less for Pattern 3 than for Pattern 22 unless the patient has low levels of pattern glare.19 (The difference formula proposed by Evans and Stevenson applies only at the viewing distance they used, which was about 0.4m).
Procedure. In the literature a variety of test procedures have been used. Sometimes the list of effects has been increased by adding symptoms such as ‘unease’; sometimes the pattern has been presented continuously while the examiner asks about the presence/absence of each symptom in turn, thereby exposing the pattern for longer.
How can the test methods be improved?
Since the original Pattern Glare Test was developed, technological advances have led to tablet devices becoming widespread for near vision tasks. Such devices allow much better control of test methods and afford an opportunity to consider ways in which the original test can be improved.
- The test procedure needs to be clearly described and standardised.
- For future versions of the test it might be preferable to list colours separately. Colours are relatively rarely seen and then only in the more severe cases. Including colours as separate items potentially gives the test greater sensitivity, although this will need confirmation with a Rasch analysis.
- It is technically difficult to reproduce high spatial frequency gratings of adequate quality for a 0.4m viewing distance. Although it may be necessary for technical reasons to increase the viewing distance to 0.6m, 0.4m is a more suitable viewing distance for both print and tablets.
- The test could include a series of patterns progressively increasing in contrast. The threshold contrast at which discomfort and perceptual distortions first appear has been shown by Mulleneurs et al20 to provide a useful measure of pattern glare in patients with migraine. This technique was used by Monger et al21 and revealed the effects of colour on pattern glare. Participants were asked to report when they first experienced discomfort from the pattern and the contrast of that pattern was recorded. This measure was better at discriminating a benefit from coloured filters than was the number of illusions, which suggests that the contrast at which discomfort is first reported may be a better measure of susceptibility to pattern glare than the number of illusions seen. This measure should be included in any future test of pattern glare.
A study is under way to produce a new version of the test that takes advantage of modern digital display technologies. It is also planned to produce a paper version for use by practitioners without access to tablet technology, although it is anticipated that before long tablet technologies will become the norm for near vision testing.
Laura Monger was a College of Optometrists postgraduate scholar and was awarded her PhD in 2016 for work on objective correlates of visual stress. Peter Allen and Arnold Wilkins supervised her PhD. Bruce Evans and Arnold Wilkins developed the Pattern Glare Test.
References
1. Field DJ. Relations between the statistics of natural images and the response properties of cortical cells. Opt Soc Am A. 1987;4(12):2379-94.
2. Wilkins AJ, Nimmo-Smith MI, Tait A, McManus C, Della Sala S, Tilley A, et al. A neurological basis for visual discomfort. Brain. 1984;107:989-1017.
3. Campbell FW, Robson JG. Application of Fourier analysis to the visibility of gratings. Journal of Physiology. 1968;197:551-66.
4. Chronicle EP, Wilkins AJ. Gratings that induce distortions mask superimposed targets. Perception. 1996;25:661-8.
5. Plant GT, Zimmern RL, Durden K. Transient visually evoked potentials to the pattern reversal and onset of sinusoidal gratings. Electroencephalography and Clinical Neurophysiology. 1983;52(2):147-58.
6. Huang J, Cooper TG, Satana D, Kaufman DI, Cao Y. Visual distortion provoked by a stimulus in migraine associated with hyperneuronal activity. Headache. 2003;43(6):664-71.
7. Hibbard P, O’Hare L. Uncomfortable images produce non-sparse responses in a model of primary visual cortex, Royal Society Open Science 2015; 2: 140535
8. Wilkins AJ, Binnie CD, Darby CE. Visually-induced seizures. Progress in Neurobiology. 1980;15:86-117.
9. Wilkins AJ Reading through colour. Wiley, 2003.
10. Hollis J, Allen PM. Screening for Meares-Irlen sensitivity in adults: can assessment methods predict changes in reading speed? Ophthal Physiol Opt. 2006;26(6):566-71.
11. Haigh S, Jaschinski W, Allen P, Wilkins A. Accommodation to uncomfortable patterns. Perception. 2013;42:208-22.
12. Evans BJW, Cook A, Richards IL, Drasdo N. Effect of pattern glare and colored overlays on a stimulated-reading task in dyslexics and normal readers. Optom Vis Sci. 1994;71:619-28.
13. Monger LJ, Shah D, Wilkins AJ, Allen P. The effect of viewing distance on responses to the Pattern Glare Test. 2015.
14. Georgeson MA. Psychophysical hallucinations of orientation and spatial frequency. Perception. 1976;5:99-111.
15. Huang J, Zong X, Wilkins A, Jenkins B, Bozoki A, Cao Y. fMRI evidence that precision ophthalmic tints reduce cortical hyperactivation in migraine. Cephalalgia. 2011;31(8):925-36.
16. Marcus DA, Soso MJ. Migraine and stripe-induced visual discomfort. Achives of Neurology. 1989;46(10):1129-32.
17. Evans BJW, Stevenson SJ. The Pattern Glare Test: a review and determination of normative values. Ophthal Physiol Opt. 2008;28:295-309.
18. Stevenson, Sarah, Jane. A normative study of the pattern glare test and an investigation of its optometric correlates MSc thesis (Clinical Optometry). Department of Optometry & Visual Science, City University, London, 2004.
19. Conlon E, Lovegrove W, Barker S, Chekaluk E. Visual discomfort: the influence of spatial frequency. Perception. 2001;30:571-81.
20. Wilkins A, Allen P, Monger L, J, Gilchrist J. Visual stress and dyslexia for the practising optometrist. Optometry in Practice.17(2).
21. Mulleners W, Aurora S, Chronicle E, Steward R, Gopal S, Keoehler P. Self-reported photophobic symptoms in migraineurs and controls are reliable and predict diagnostic category accurately. Headache. 2001;41:31-9.
22. Monger L, J, Wilkins AJ, Allen PM. Pattern glare: the effects of contrast and colour. Font Psychol. 2015;6:165.