In 1972, Essilor introduced its second generation progressive design, the Varilux 2 lens.1 Like the original Varilux design, the principle of the progressive surface can be understood by comparing it with the surface of an elephant’s trunk, but in this case, one whose sagittal sections are no longer circular. Imagine that near the top of the trunk the horizontal sections are shaped like ellipses with one end of the minor axis lying along the meridian line, DN, as shown in figure 1.

Figure 1: Evolving conic sections of the progressive surface of the Varilux 2 design
Moving down along the trunk, the horizontal sections are still elliptical, but the ratio between the major and minor axes decreases, ie the section is less elliptical, the p-values reducing to unity. At the geometric centre of the surface, A, the horizontal section becomes a circle, that is, the major and minor axes of the ellipse have become equal in length and p = 1.
Below the geometric centre, the horizontal section becomes elliptical again, now with one extremity of the major axis lying on the meridian line, DN. As the bottom of the surface is approached, the conic sections continue to evolve from ellipses into a parabola, and eventually, hyperbolae.
The power law for the Varilux 2 design is shown in figure 2 for the lens +2.00 add +2.00. Note that the maximum addition is obtained some 14mm below the geometric centre, G, but that the addition has already increased by about one-tenth of its full value at the geometric centre of the lens.
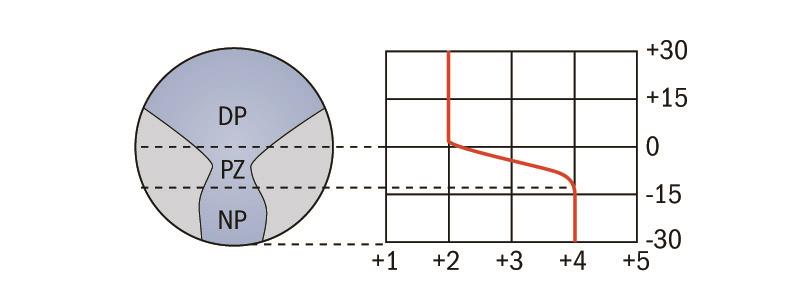
Figure 2: Power law for the Varilux 2 design
With the introduction of the Varilux 2 design, it became usual to apply thickness reduction prism (prism thinning) to the lens, to equalise the thickness at its top and bottom edges.
Since the periphery of the progression surface was flattened in its sagittal sections, compared with the circular sections of its predecessor, the Varilux 2 design was much softer, with less skew distortion. The reduction in distortion was such that the new design was described as being orthoscopic; which means free from distortion.
The iso-astigmatism plot shown in figure 3 for the power, +2.00 add +2.00, indicates that the lens was a soft design, the astigmatism increasing more slowly as the eye moved out of the corridor than with Varilux 1, but is now spread upwards into the distance portion.
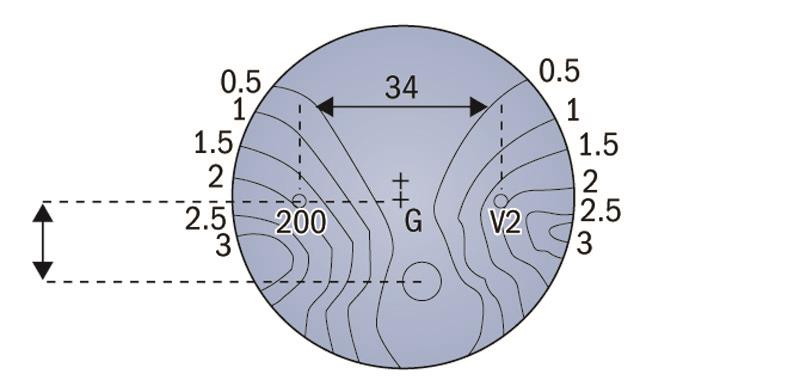
Figure 3: Iso-astigmatism plot, Varilux 2 lens
Two circles were permanently engraved on the lens, 34mm apart, on the horizontal line passing through the geometrical centre. The near addition was engraved under the temporal circle and a trademark under the nasal circle. The fitting point position was 4mm above the geometric centre of the lens and it was recommended that this point be fitted in front of the centre of the pupil of the eye with the head in the primary position. Without doubt, it was the introduction of the soft Varilux 2 design, offering far easier adaptation to progressive lens wear that enabled the use of progressive lenses to escalate to the point where this type of correction for presbyopia soon began to be chosen in preference to bifocal lenses.
The real improvement which came with the Varilux 2 design was that the power in the progression and near portions reduced as the eye rotated horizontally from the centre to the edges of the lens. This softened the design considerably and it will be seen that this feature was adopted by all subsequent, so-called, soft progressive designs.
The introduction of the Varilux 2 design heralded a series of designs from other major lens manufacturers, all eager to capitalise on this new high-turnover lens product. In 1973 American Optical introduced Ultravue, which effectively was a blended bifocal, with a 25mm usable diameter segment. This was followed by the Ultravue 28 and in 1982 by the TruVision AO7 lens designed by John Winthrop,2 which was produced by slumping either glass semi-finished blanks, or glass moulds from which the progressive surface could be cast. The TruVision AO7 design was based upon a trifocal concept where the dividing lines were blended to become invisible during the slumping process as shown in figure 4.

Figure 4: AO TruVision AO7 design
In figure 4, the lines EE′ and FF′ divide the lens into three portions, for distance, intermediate and near. The intermediate portion is progressive in nature and although one would expect to see a visible dividing line towards the periphery of the progressive zone, the sagging process which takes place during the slumping process smoothed out any visible discontinuities. The area of the lens within the section marked AA′B′B is virtually free from astigmatism. The areas ABDC and A′B′D′C′ blend the central area with the outer areas, CDE and C′D′E′, the horizontal curvature being chosen to blend the central portion with the peripheral areas. This ensured there was no surface discontinuity at the junctions of these areas. The outer areas were portions of a surface of revolution whose axis of revolution lies in the vertical meridian. The cylindrical blending at the edge, has its axis of revolution in the vertical meridian, as can be seen from the image of a lined square viewed through the lens, to ensure vertical lines remain vertical when viewed through these zones, even though they will be indistinct. These areas are designed to lie vertically when the lens has been rotated by 10° to provide an inset for the right and left lenses.
Figure 5 shows an iso-astigmatism plot for the TruVision AO7 lens made to the prescription, 0.00 add +2.00 D.

Figure 5: Iso-astigmatism plot TruVision AO7
A lens of similar construction had been patented by Lawrence J Davenport,3 a Canadian whose later 1981 patent4 was assigned to the Younger Optics Company of Los Angeles, California, who introduced the 10/30 design, similar to the AO Ultravue, followed by the Younger CPS.
The first progressive lens to emerge from Germany was the Rodenstock Progressiv R design5 which became available in 1981. Like the Varilux designs, the principle of the surface can be understood by comparing it with the surface of an elephant’s trunk, but again, one whose sagittal sections vary in the progression and near zones from simple circles. Imagine that near the top of the trunk the horizontal sections are circular to provide a wide spherical zone for distance vision (figure 6).

Figure 6: Rodenstock Progressiv R design
Moving down the trunk, in the distance portion, the horizontal sections remain circular. The evolute remains the single point CA. In the progression zone the horizontal sections are described as periodic curves, which are convex in the region of the meridian line, DAN, but become concave towards the edges of the lens. The line CACN is the evolute of the surface between A and N, CP being the centre of curvature of the progressive region of the surface at P. The designers deliberately did not arrange for the surface astigmatism along the line DN to be zero, but claimed advantages in allowing small values of surface astigmatism along this line providing that it remained less than 0.25 D.
The progression length, h, was a total of some 16mm for a surface of addition +2.00 D, the power starting to increase about 2mm above the geometrical centre of the lens and ending 14mm below the geometrical centre. The periodicity of the sagittal sections was optimised to minimise the astigmatism in the nasal and temporal regions of the progression zone and the near portion. An iso-astigmatism plot is shown in figure 7 for the power, +2.00 add +2.00.

Figure 7: Iso-astigmatism plot Rodenstock Progressiv R design
A second design from Germany was to follow in 1983, when Zeiss launched their first in-house designed progressive lens, the Gradal HS.6 Zeiss recognised the importance of symmetrical power distribution in the intermediate and near zones in order to prevent vertical differential prism between a pair of equal power lenses as the eyes were roaming around the visual field. They called this innovation ‘horizontal symmetry’.
The principle of horizontal symmetry is shown in figure 8. Imagine the eyes are viewing point Q on a screen some distance in front. Without lenses, as shown in figure 8a, the visual axes would be directed straight towards Q. When spectacle lenses are mounted before the eyes, the visual axes will take up new directions depending upon the positions of the visual points with respect to the optical centres and the powers of the lenses. Thus, when the eyes are viewing through the points shown in figure 8b, before fusion takes place, in order to obtain a single binocular image, the eyes must overcome any differential prism which exists between the visual points. Ideally the resolved components of the vertical and horizontal differential prism should be virtually the same for each lens. Due to the Minkwitz astigmatism and resulting variation in mean power, the prismatic effect encountered, for example, at points in the right hand area of the right lens (as shown in figure 8), may differ from the effects in the right hand area of the left lens, even when the power of each lens is the same. The horizontal differential prism, δPH, shown in the figure is unlikely to cause the wearer much difficulty, but the vertical differential prism, δPV, may cause discomfort, and the Zeiss patent states one of the features of its new lens was to ensure the vertical differential prism in a pair of lenses of equal powers does not exceed 0.50Δ. Zeiss called this feature ‘horizontal symmetry’ and is a feature they have retained in all their later progressive designs.

Figure 8: Derivation of the term Horizontal Symmetry – Zeiss Gradal HS
Other features of the design given in the Zeiss patent include a meridian line which follows the normal path of convergence, as the eyes rotate from the distance zone to the near zone, and that along this line, the astigmatism is not necessarily zero. The designers considered a small degree of astigmatism (less than 0.50 D in the progressive zone but dropping to zero in the near vision area) was permissible if it enabled other benefits to be obtained in the periphery of the lens. Also, the power of the progressive surface was deliberately reduced in the peripheral regions of the progression and near zones, in order to soften the design, without introducing too much error at the periphery of the distance area. Figure 9a shows an iso-astigmatism plot for a 60mm diameter uncut lens with the specification, 0.00 add +2.00 and figure 9b illustrates an iso-mean power plot for the same design.

Figure 9: Iso-astigmatism and iso-mean power plots for Zeiss Gradal HS design of power, plano add 2.00 D
It can be seen the near power, +2.00 D, reduces to zero as the eye scans horizontally in the lower portion of the lens.
During the 1980s several manufacturers introduced their own progressive lens designs. The French lens manufacturing company, Benoist-Berthiot, had already launched a progressive design in 1968, called Zoom, similar to the original Varilux lens. They were acquired by Essel in 1972 and two years later were joined by another French lens and instrument manufacturer, Guilbert-Routit, to form the Essilor subsidiary, BBGR. Following the success of the Varilux 2 lens, during the 1980s, BBGR launched the New Zoom (known as the Silor Super No Line in the USA, and, subsequently, the Visa (Silor New Super No Line). Iso-astigmatism plots for these designs with powers, plano add +2.00 D are shown in figure 10a and b.

Figure 10: Iso-astigmatism plots for various second generation progressive designs
In 1984, the Graduate design was introduced by Sola Optical (now part of the Carl Zeiss Vision group). The design was known as the VIP lens in the USA (figure 10c).
Vision-Ease, who had bought the Univis lens division (the original producer of the Omnifocal lens described earlier), introduced a new design known as the Unison CV (also known as the Varivue design in some markets), whose iso-astigmatism plot is shown in figure 10d.
It can be seen from figure 10 that these early progressive designs were generally quite hard, offering large distance portions but increasing amounts of Minkwitz astigmatism in the progression and near portions of the lens. Only the Unison CV design shows any reduction in power towards the periphery, in the lower portion of the lens.

Table 1: Progression lengths for Varilux VMD design
Third generation progressive designs
With advancing presbyopia, the amplitude of accommodation reduces and near vision must be restored by an ever-increasing near addition. Essilor’s third generation progressive, introduced in 1988, the Varilux Multi-Design (VMD)7 differed from Varilux 2 in that the surface for each near addition was specifically computed to take into account the different amounts of accommodation available to the wearer. In general, as the near addition increased, the surface became progressively harder to ensure good peripheral vision was maintained in all zones of the lens. It was claimed in the patent the overall effect was to improve physiological adaptation and to reduce the adaptation time required when subjects changed their lenses to higher near additions. Clinical trials on a relatively large number of subjects revealed they had greater visual comfort and also, as their presbyopia increased, they suffered less discomfort with a new higher addition, than with previous progressive designs. Figure 11 shows the different viewing zones of the Varilux VMD design. The area above A1 is the distance vision zone and the area below A2 is the near vision zone. Needless to say, the dashed lines are not visible on the lens. The progression starts at point A3, which lies at the distance d1 below A1, and the power increase finishes at point A4, at the distance d2 below the start of the near vision zone. The prescribed addition power is obtained at point A2 and the power continues to increase by the value δA between A2 and A4. The total length of the progression zone is the distance, D, which varies with the near addition. In fact, all three distances, D, d1 and d2 vary with the near addition, as shown in table 1, whereas D0 remains constant at about 20mm.

Figure 11: Viewing zones of Varilux VMD lens
It can be seen the result of this strategy is to shorten the length of the progression corridor as the near addition increases, in other words to harden the design as the add increases. The power laws for three additions are shown in figure 12.

Figure 12: Power laws for the Varilux VMD design adds +1.00, +2.00 and +3.00
Figure 13a shows an iso-astigmatism plot for a 60mm diameter uncut lens with the specification, 0.00 add +2.00, and figure 13b illustrates an iso-mean power plot for the same design. In reality, the design has a total addition of about 2.25 D (see table 1).

Figure 13: Iso-astigmatism and iso-mean power plots for Varilux VMD lens, 0.00 add 2.00
By the end of the 1980s, it had become understood softer progressive lens designs were generally found to be easier to adapt to, especially by first-time wearers of progressive lenses, and manufacturers turned their attention to designs which allowed the surface astigmatism to spread up into the distance portion of the lens. This had the effect of reducing the astigmatism in the lateral regions of the progression and near zones.
One of the first of this new generation was the TruVision OMNI8 lens from American Optical introduced in 1988, which remains one of the softest progressive lens designs ever produced. The power distribution is based upon the Dirichlet principle which governs, for example, the heat distribution in a piece of metal sheet which has a temperature differential across its surface.

Figure 14: The Dirichlet principle
The Dirichlet principle will be understood from the isotherm lines drawn on a sheet of copper which has first been cooled to 0°C, and then heated to a temperature of 120°C the heat being applied at point A (figure 14). The principle states that the isotherm lines will take the smoothest course over the temperature differential and the heat variation will be as illustrated in the diagram. This principle of a very smooth power flow over the surface was achieved by arranging for the power variation to follow the same general principle as used in an up and down curve multifocal as shown in figure 15.

Figure 15: Power variation for the TruVision OMNI design
Following the Dirichlet principle, the power increases in zones from the DP pole to the NP pole; the poles being about 38mm apart. This more than doubles the distances between the iso-astigmatism contours as predicted by the Minkwitz theorem. An iso-mean power plot for the design is shown in figure 16, together with the power law across the lens resulting from the Dirichlet principle. An iso-astigmatism plot for the lens, 0.00 add +2.00 D is shown in figure 16 showing the very low levels of surface astigmatism achieved with the design. From the Minkwitz theorem, the 38mm distance between the DP and NP poles gives a corridor width of some 19mm before 1.00 D of cylinder is obtained. When the lens was introduced, because the progression length was so long, many practitioners increased the subject’s near addition to allow them faster access to the near portion. Naturally, this resulted in an increase in the Minkwitz astigmatism.

Figure 16: Power law for the TruVision OMNI design, 0.00 add +2.00

Figure 17: Iso-astigmatism plot for the TruVision OMNI design, 0.00 add +2.00
The design principle of the TruVision OMNI lens was made available in three different forms. When the near addition was low, +0.50, +0.75 and +1.00 D, the lens was repackaged as the TruVision PRIMA. Because the addition was so low, the levels of Minkwitz astigmatism were also low and the lens offered wide distance, intermediate and near zones. It was aimed at first-time, progressive lens wearers as a design to which adaptation would be relatively quick and easy (figure 18).

Figure 18: Iso-astigmatism and iso-mean power plots for TruVision Prima, 0.00 add 0.50
The third member of this family, introduced in 1990, was the TruVision Technica which was designed mainly for intermediate and near use but also had a small area on the lens which incorporates the distance prescription. The designer stated the distance zone is only available when the subject looks straight ahead through the distance reference point and the design should only be used to provide occasional distance use. The distance and near reference points are separated by 28mm and the lens is advocated for use at the work station. Like its parent design, the TruVision OMNI, the lens is bipolar in construction with very low areas of surface astigmatism as shown in figure 19.
 Figure 19: Iso-astigmatism and iso-mean power plots for TruVision Technica, 0.00 add 2.00
Other manufacturers were to introduce third generation designs concentrating upon lower levels of surface astigmatism and allowing it to spread up into the distance portion of the lens.
The second generation Rodenstock Progressiv R was designed with a spherical DP surface and, as was shown by its contour plot, (figure 7) was a hard design with a large distance zone, but severe astigmatism in the periphery. The third generation design from Rodenstock was the Progressiv S9 which employed an aspherical DP surface for the positive power range, resulting in a much softer design that could be made in flatter, thinner and more lightweight form, following the philosophy of modern aspheric single vision designs. It was made available in both 1.60 index glass and 1.60 index plastics material in decentred blank form, to assist with the large eye sizes which were in vogue during the 1980s. An iso-cylinder plot for the lens, 0.00 add +3.00 D is shown in figure 20.

Figure 20: Iso-astigmatism and iso-mean power plots for Progressiv S, with add 3.00
During the 1980s, several lens manufacturers started to invest in the expensive CNC machinery required to produce progressive surfaces. A glass design was produced in Israel by Shamir (Shamir Progressive II – 1984) who by 1987 were distributing glass moulds to lenscasters around the world, enabling smaller casting laboratories to produce their own series of progressive lenses.
Similar designs were produced by Sola, the Sola XL10 which was described as a soft aspheric asymmetric design especially suitable for new presbyopes, offering wide distance and intermediate portions and was produced from slumped moulds. Zeiss introduced the Gradal 3, also an asymmetric design offering ease of adaptation for former Gradal 2 wearers.
Progressive designs also started to be produced in Japan. The Hoya Lens Corporation introduced their own design, the Hoyalux 3, a departure from their earlier Hoyalux lenses which had previously been imported from another major lens manufacturer.
Seiko-Epson introduced a soft design, known as the Seiko P1 Mild,11 which exhibited remarkably low levels of surface astigmatism. An iso-astigmatism plot and power law are illustrated in figure 21.

Figure 21: Iso-astigmatism plot and power law for Seiko P1 Mild, Plano add +2.00 Technica, 0.00 add 2.00
Fourth generation progressive designs
In 1992, ongoing major developments in computer aided design and production enabled Essilor to launch their fourth generation design, the Varilux Comfort,12,13 which was to prove a hugely successful progressive lens. In the design of Varilux Comfort, physiological, ergonomic and optical aspects of the way in which spectacle lenses were worn and performed, were taken into account. For example, with age, visual acuity reduces and in order to compensate for this reduction, subjects tend to hold the reading material closer and closer. This, of course, has significance in the positioning of the intermediate channel and near zone.

Figure 22: 1.00 D Iso-astigmatism plot and power law for Varilux Comfort +2.00 add 2.00
It was also recognised that before the onset of presbyopia, when transferring vision from distance to near, the visual axis is lowered by some 60°, 45° of which is accomplished by the head and some 15° by ocular rotation. When wearing bifocal or progressive lenses, this relationship must change since, in order for the wearer to obtain the benefit of the near addition in the lower part of the lens, the eyes must rotate down further behind the lens.

Figure 23: Co-ordinates of meridian line for Varilux Comfort
In the case of bifocals and earlier designs of progressive lenses, the head-eye rotation was forced to change to some 30° each. Owing to the power law of the new Varilux Comfort design, the change in reading posture was less dramatic; this also proved to be helpful in adaptation by new progressive lens wearers. The path of the meridian line was carefully determined and specified in the patent (figure 23) which shows the path of the meridian line from the distance zone to the near zone of the lens. D represents the position of the fitting cross which lies 4mm above the geometric centre of the lens, G. Denoting the near addition by A, the coordinates for point C are specified, in millimetres, as
xC = 0.152A2 – 0.293A + 2.157
yC = 0.340A2 – 0.425A – 6.422
xC and yC being measured from G and the coordinates for point N are specified as
xN = 0.222A2 – 0.438A + 2.491
yN = -14.
The angle, α, which governs the inset of point C from D is specified as
α = 1.574A2 – 3.097 + 12.293 (degrees).
It can be seen that the total inset of point N is made up from two angles, α and ω. The angle ω is specified as
ω = 0.266A2 - 0.473A + 2.967 (degrees).
The surface power at point C on the progressive surface, FC, (which is the mean surface power at C) is specified as
FC = F1 + κA
where κ itself is a function of the addition,
κ = -0.00836A2 + 0.00381A + 0.8977.
The derivation of these functions is not divulged in the patent but it is stated that it is important that at least 85% of the full addition is reached at point C, near the top of the near portion.
Table 2 gives the results of all these functions for near additions +0.50 to +3.50 D from which the power laws can be plotted.

Table 2: Results of functions for near additions
The (x, y) co-ordinates are specified in millimetres from point G and the surface power at point CA given in the last column of table 2 assumes a +5.50 DP curve for the convex progressive surface.
The tight control over the meridian line ensured, among other things, that some 85% of the full near addition is available to allow wearers to view, comfortably, a sheet of A4 paper on the desk before them, and that the full addition becomes available as the subject reads down the sheet. The power laws along the meridian line for various additions are depicted in figure 24 and show that the addition power starts slowly from 4mm above the geometric centre of the lens and also the value reached at point, CA, which lies on the red dashed line in the figure. The full addition is reached some 6mm below this.

Figure 24: Power laws for Varilux Comfort (Adds +0.50 to +3.50)
Figure 25 illustrates iso-astigmatism and iso-mean power plots for the design made to the specification +2.00 add +2.00 for near. The iso-mean power plot indicates quite clearly that, as the eye scans horizontally away from the region around the near reference point, the addition power reduces towards the lens periphery, where it eventually disappears. This feature of the design is shown graphically in figure 26 which shows how the power varies along a horizontal section through the centre of the near zone, where the full addition of +2.00 D is seen to be obtained at the centre of the zone.

Figure 25: Iso-astigmatism and iso-mean power plots for Varilux Comfort +2.00 add 2.00
The patent also discloses how the inset varies with the distance power and the near addition, the amount of inset increasing as the correction for hypermetropia increases and also as the add power increases, and decreases with increasing minus powers and smaller additions.
Following the success of the Varilux Comfort design, several other fourth generation designs appeared on the market during the 1990s including entries from the ophthalmic divisions of other major Japanese optical companies who were previously not well known in the ophthalmic field.

Figure 26: Horizontal power law for Varilux Comfort add +2.00
Additions to the AO range of progressive power lenses were the AO PRO OMNI design, later rebranded simply as the AO PRO, and the short corridor design AO Compact. The AO PRO design is described as an aspheric design with variable geometry (dependent upon the base curve and addition), with a corridor length of 16mm, a decentred blank and built in thinning prism. The AO Compact design was introduced specifically for the demand for progressive lenses which could be used in small frames which had become the trend in spectacle frame fashion towards the end of the 20th century. Its short corridor length of only 13.5mm, enables it to be dispensed in a frame with a small vertical box dimension, an innovation for progressive design which was followed by most of the other major lens manufacturers who soon introduced their own short corridor designs for small frames.
The corridor lengths are shown in figure 27 and a comparison of the distance and near areas for these two designs is given in figure 28 where a typical, shallow-eye oval, lens shape has been placed over each design to show the larger near area provided by the design for small frames. The fitting cross for each lens is located 4mm above the horizontal centre line and assuming a 30mm vertical box dimension for each lens, the AO PRO design provides a near portion of just 3.5mm in depth, compared with 5mm for the AO Compact design. The corridor length for the Compact design is 13mm for adds up to +2.00 D, which represents the distance from the fitting cross to a point where the near addition is 0.12 D less than the stated addition. For higher additions the corridor length increases slightly as shown below.
Up to:
Add 2.00 13.0mm
Add 2.50 13.9mm
Add 3.00 14.5mm
Add 3.50 15.1mm

Figure 27: AO PRO and AO Compact designs
In general, a progressive lens with a short corridor tends to harden the design, narrowing the corridor and allowing slightly higher levels of surface astigmatism to appear in the intermediate and near zones of the lens.

Figure 28: Comparison of near zones for AO PRO and AO Compact designs
The United Kingdom Optical Company located in Lurgan, Northern Ireland also began to develop a progressive lens which they launched in the mid-1990s following a change of company name to Crossbows Optical Ltd. Originally known as the Contour H, a hard design, and Contour S, a soft design, they were produced by slumping from ceramic moulds, produced in-house, by CNC machining. The company also sold the slumped glass moulds to lenscasters who wished to produce progressive lens series. Crossbows later introduced direct CNC machining of the surfaces and their own software, enabling them to produce variable corridor lengths and different lifestyle versions of their designs, for example, suitable mainly for distance vision, or mainly for computer use. Iso-astigmatism and iso-mean power plots for the Contour S design are illustrated in figure 29.

Figure 29: Iso-astigmatism and iso-mean power plots for Crossbows Contour S , 0.00 add 2.00
Hoya’s fourth generation design was based on the older Hoyalux 3 lens. The Hoyalux Wide offered wider intermediate and near vision zones than their previous design (figure 30). Described as a transmission based progressive design, it was offered in CR 39, Hoyalux GP Wide, 1.60 index plastics material, Hoyalux EX Wide and the 1.71 index plastics material known as Teslalid, Hoyalux LX Wide. An iso-astigmatism plot for the CR 39 GP Wide with an addition of 2.00 D is shown in figure 30.

Figure 30: Hoyalux GP Wide design with iso-astigmatism plot, 0.00 add 2.00
The ophthalmic division of the Japanese camera company, Nikon, introduced two series of progressive power lenses during the 1990s, their Presio range and their SV range. The Presio series was described as Presio Dynamic, with corridor lengths of 16mm and Presio Executive, with corridor lengths of 14mm. The two designs in the Nikon SV series were called Excela and Custom. The SV Excela design had a corridor length of 18mm and the SV Excela R, a corridor length of 14mm.
The ophthalmic division of another Japanese company, Asahi Pentax, also introduced progressive lenses in plastics materials. The multilayer, AR coated, uncut diameter was 80mm and the progressive surface was described as an asymmetric soft design.
Rodenstock called its fourth generation progressive design the Progressiv Life lens which was later followed by Progressiv Life 2. Described as a soft design it had similar features to the low base aspheric designs employed for the Progressiv S series. It was claimed that Progressiv Life 2 was easier for wearer adaptation if changing from a previous bifocal correction. Figure 31 illustrates an iso-astigmatism and an iso-mean power plot for the Progressiv Life 2 design.

Figure 31: Iso-astigmatism and iso-mean power plots for Rodenstock Progressiv Life 2, 0.00 add 2.00
In 1995, Seiko-Epson introduced a new version of their progressive design, the Seiko P6, which was produced in CR 39 material with a seven-layer multi-purpose coating applied as a standard feature of the design. This was followed by a 1.67 version, known as the Seiko Genius. The low-base aspheric design enabled the lens to be flatter and thinner. It was also supplied with the seven-layer multi-purpose coating.
Shamir Optical Industries introduced its next generation Genesis progressive lens, designed using ray-tracing techniques (which they called Eye-Point Technology), also of aspheric design to enable thinner lenses to be manufactured. Shamir also introduced a short-corridor progressive design, the Shamir Piccolo which it described as a soft, short-corridor design which was also determined using its Eye-Point Technology. The lens could be fitted into a shallow-eye frame, which enabled a minimum depth below the pupil centre of just 17mm (figure 32).

 Figure 33: Iso-astigmatism and iso-mean power plots for Sola Percepta design, 0.00 add 2.00
The fourth generation design from Sola Optical, launched in 1997, was called the Sola Percepta. Its surfaces were individually designed for the prescription range for which each base curve was likely to be used, the precise surface configuration depending upon the base curve and addition. The base curves were coded as being suitable for myopes, (M), presbyopic emmetropes, (E), or hypermetropes, (H). Unusually for a new product, the Percepta range was released in all materials, CR 39, Spectralite, Polycarbonate and a 1.60 index plastics material called Finalite, in addition to Transitions versions of the CR 39 and Spectralite lenses. Iso-astigmatism and iso-mean power plots are shown for the Percepta design in figure 33.
Professor Mo Jalie is a visiting professor at Ulster University and author of the new edition of Principles of Ophthalmic Lenses.
References
1 Maitenaz BF (1972), US Patent 3687528, Ophthalmic lenses with a progressively varying focal power.
2 Winthrop JT (1977), US Patent 4062629, Progressive Power Ophthalmic Lens having plurality of viewing zone with discontinuous power variations therebetween.
3 Davenport LJ (1959), Canadian Patent 583087, Variable Power Lens.
4 Davenport LJ (1981), US Patent 4274717, Ophthalmic Progressive Power Lens and Method of Making Same.
5 Guilino G & Barth R (1980), US Patent 4240719, Progressive Ophthalmic Lens.
6 Fuëter G & Lahres H (1986), US Patent 4606622, Multifocal spectacle lens with a dioptric power varying progressively between different zones of vision. (German application 3016935, dated 1980.)
7 Dufour M (1989), US Patent 4838674, Multifocal Ophthalmic lens.
8 Winthrop JT (1989), US Patent 4861153, Progressive Addition Spectacle Lens.
9 Guilino G & Barth R (1990), US Patent 4946270, Progressive Power Ophthalmic Lens.
10 Barkan EF & Sklar DH (1987), US Patent 4676610, Method of making Progressive lens and Resulting Article.
11 Shinohara T (1986), US Patent 4580883, Progressive Multifocal Ophthalmic Lenses.
12 Pedrono C (1993), US Patent 5270745, Progressive Multifocal Ophthalmic Lens.
13 Harsigny C et al (1996), US Patent 5488442, Progressive Multifocal Ophthalmic Lens.