So far in this series we have considered the evolution of lens designs. In this article, we will discuss the correct fitting of the lenses to ensure maximum benefit from their design.
Fitting progressive lenses
BS EN ISO 13666:2012, Ophthalmic optics – Spectacle lenses – Vocabulary, gives the following definitions (figure 1):
- 5.24: fitting point – that point on the front surface of a lens or semi-finished lens blank stipulated by the manufacturer as a reference point for positioning the lens in front of the eye.
- 5.25: fitting point position – vertical and horizontal fitting distances and directions of the fitting point from the boxed centre of the lens shape.
- 5.26: fitting point height – vertical distance of the fitting point above the horizontal tangent to the lens shape at its lowest point. (If the lens is bevelled, the periphery is taken to be the peak of the bevel.)
Note that the fitting point position is measured from the boxed centre (ie the horizontal centre line in the case of the vertical fitting distance), whereas the fitting point height is specified, just as for a bifocal segment, from the lower horizontal tangent to the lens periphery. Horizontally, the lens will be mounted at half the boxed centre distance minus the monocular centration distance (CD) for each eye. It is important to realise that the monocular centration distances are measured from the centre of the bridge of the spectacle frame to the pupil centres, rather than the centre of the subject’s nose.
Several methods for fitting progressive power lenses have been put forward by lens manufacturers, often a new routine being suggested for each new design when it is initially introduced. Essentially, in the absence of previous wearer experience, it is important to place the fitting point at the centre of each pupil when the eyes lie in their primary position.
This requires recording the measurement of the monocular fitting point height and centration distance for each eye independently (figure 1).
.jpg)
Figure 1: Measurement of the fitting point height and monocular centration distance or CD (right eye) for a progressive lens
Methods vary from simply dotting the centres of each pupil on the dummy lenses mounted in the frame to the use of photographic recording by sophisticated lens fitting instruments such as the Visioffice instrument illustrated in figure 2. A typical simple fitting routine is as follows.

Figure 2: Lens fitting instrument (Visioffice – courtesy of Essilor)
- Select the final frame the subject is to wear and adjust it to fit properly. As a general guide, the frame should be closely fitting with the smallest possible vertex distance and the correct as-worn pantoscopic angle and should provide adequate depth beneath the centre of the pupil to accommodate the reading zone of the lens. A minimum depth of 22mm is often suggested. However, it should be borne in mind that if the length of the progression zone is 18mm this minimum depth only provides a near zone which is 4mm deep. In addition, there should be at least 10mm between the pupil centre and the upper rim of the frame to provide an adequate distance portion.
- If the frame is empty, attach vertical strips of transparent adhesive tape to each eye to enable the positions of the centres of the pupils to be marked. Otherwise the fitting point positions can be marked on the existing lenses.
- With the correctly adjusted frame in position, ask the subject to look straight into your eyes. If you are both seated, adjust the height of your stool to ensure that your eyes are on exactly the same level as that of the subject. Some practitioners prefer to take the measurements with both standing.
- Direct the subject to look straight into your open left eye and using a fine-tip marking pen and, preferably, a light coloured ink, place a dot in front of the centre of the subject’s right pupil.
- Direct the subject, without moving their head, to look straight into your right eye and place a second dot in front of the centre of their left pupil.
- Remove and replace the frame on the subject’s face and repeat the above procedure, this time without making any marks, to ensure the dots which you have marked lie in front of the centres of the pupils.
Record the fitting point positions and check by means of an appropriate blank sizing chart that the lenses can be obtained from the available blank diameters. When ordering the lenses it is necessary to give the fitting point heights (the heights of the fitting crosses) together with the monocular CDs measured from the centre of the bridge of the frame, which is the reference point for the glazing department. It is very common for the monocular CDs to differ between the right and left eyes. The specification should be written, for example, as 34/32 which indicates that the right eye monocular CD is 34 and the left eye monocular CD is 32. The heights of the pupil centres may also differ for the right and left eyes. Ideally, the fitting point positions should be specified from the horizontal centre line of the frame, such as 4mm above HCL.
It is sensible, whenever possible, to dispense a frame that allows some vertical adjustment of the height of the distance reference point at, or subsequent to, the final fitting. This enables the lenses to be raised or lowered, if this is found to be necessary, to aid adaptation.
Checking progressive lenses
The complete identification of a progressive lens involves the recognition of the type, material, form, powers, centration and fitting point positions for the lens. Semi-visible markings are engraved by the manufacturer of the progressive surface to assist identification of the lens. BS EN ISO 8980 Ophthalmic Optics – Uncut finished spectacle lenses – Part 2: Specifications for progressive power lenses stipulates that the lens should be marked with at least the following permanent markings:
a) Alignment reference markings – two marks 34mm apart, equidistant to a vertical plane through the fitting point or the prism reference point. These normally comprise two small circles, but other markings might be used. When positioned on the horizontal centre line of the uncut, the prism reference point or geometrical centre of the uncut lies exactly midway between these two markings.
b) Indication of addition power in dioptres. BS EN ISO 21987 Ophthalmic Optics – Mounted spectacle lenses stipulates this should be positioned beneath the temporal alignment mark.
c) Indication of the manufacturer or supplier or trade name or trademark. The type of lens can often be determined from the engraved manufacturer’s logo to be found under the nasal horizontal meridian location symbol. Other markings may be included to identify, for example, the material from which the lens is made, or the corridor length when more than one length is available for a given design.
Permanent markings are produced by laser engraving of the progressive surface. With an excimer laser system, the engraving is generated by cold laser ablation of 193nm ultraviolet (UV) radiation. This results in a superior engraving quality considering all cosmetic aspects, without any heat affection and micro cracks. A more compact laser system uses a diode pumped solid state (DPSS) laser to obtain high quality marking at a significantly decreased cost. The system is suitable for visible, invisible, as well as for technical engravings of all kind of spectacle lenses, including CR 39, polycarbonate, high-index plastics materials and mineral glass. The use of a UV DPSS laser source produces high-quality markings very similar to the result obtained from excimer laser engraving.
Figure 3 illustrates typical permanent markings on a progressive lens. Note that the near addition is engraved under the temporal circle, (25 = Add +2.50 D) so that the addition of the lens is known, as well as for which eye the lens is intended. Some manufacturers stipulate which surface should be placed against the lens rest in order to confirm the near addition. In the absence of this specific instruction, the difference between the vertex powers measured at the distance and near design reference points with the progressive surface in contact with the lens rest should be verified.
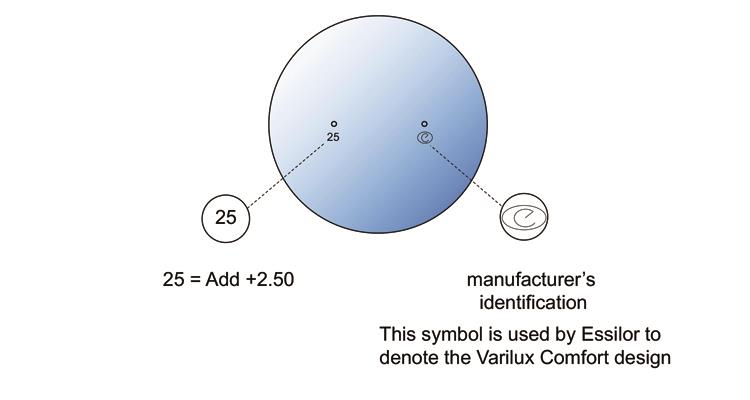
Figure 3: Alignment reference markings on a progressive lens – front view of R eye
In the case of double-surface progressive lenses, unless otherwise instructed by the manufacturer, the addition should be taken as the difference between the back vertex powers of the distance and near portions.
In addition to the permanent markings, the Standard stipulates non-permanent marking should be visible on the mounted spectacle lenses.
a) The alignment reference marking.
b) Indication of the distance design reference point.
c) Indication of the near design reference point.
d) Indication of the fitting point.
e) Indication of the prism reference point.
These markings can be established by soluble inks, decals, electrostatic transparencies, etc. Figure 4 illustrates, in red, typical temporary markings on a progressive lens which, naturally, are removed before delivery to the client.
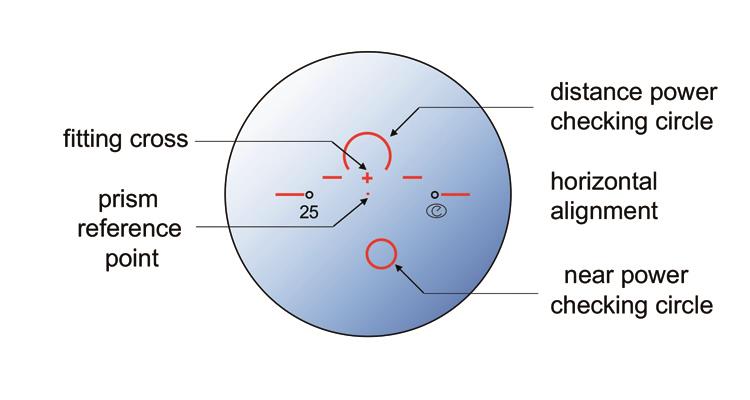
Figure 4: Non-permanent markings (in red) on a progressive lens – front view of R eye
Several manufacturers return completed spectacles from their laboratories with verification powers written alongside the ordered prescription, and prescription values should be checked against these verification powers, bearing in mind the tolerances given in BS EN ISO 21987 Ophthalmic Optics – Mounted spectacle lenses for progressive power lenses.
Checking the quality of the progressive surface
The quality of the progressive surface itself, ie whether it conforms to the design expectation, is more difficult to check. Surface mapping equipment which relies on the mechanical measurement of the surface (figure 5) gives the (x,y,z) data for the surface which has to be converted to surface power by deducing the tangential and sagittal surface powers from the (x,y,z) data.

Figure 5: Mechanical surface measurement (courtesy Carl Zeiss)
Along the meridian line, assuming that the distance portion (DP) and near portion (NP) surfaces are essentially spherical, from the equation for a spherical surface, both the tangential and sagittal surface powers, FT and FS are given by2
FT = FS = (2000(n - 1)z) / (x2 + y2 + z2)
Thus, for a surface worked on a material of refractive index, 1.50, whose (x, y, z) co-ordinates are (20, 15, 3.175) the power of the surface is +5.00 D.
Assuming that the change in curvature along the meridian line in the progression zone can be represented by an oblate ellipsoid as described in part one3 of this series, and the conic parameter, p, has been determined for the surface, the tangential power of the surface is given, from the (x, y, z) data by
FT = (1000(n - 1)r02) / {r02 + z(1 - p)(2r0 - pz)}3/2
If the astigmatism along the meridian line has been eliminated, the sagittal surface power should equal the tangential power. As a general rule, only the lens manufacturer will know the (x, y, z) data for other areas of the progressive surface which is naturally looked upon as proprietary information.
Simple to use lens mapping equipment is now available for in-practice use to measure the results of the topography of a progressive surface and will provide maps of iso-astigmatism and iso-mean power contours over the progressive surface as described in detail in part two1 of this series. For example, the Visionix VX 40 Automated Lensmeter4 (figure 6) uses a Hartmann-Shack sensor to display the iso-astigmatism and mean power plots for progressive lenses under test.

Figure 6: Visionix VX 40 Automated Lensmeter
The Hartmann Test for measuring wavefront error was first developed by J Hartmann in 1904 and was originally used for testing the quality of telescope objectives. The principle of the Hartmann Test is illustrated in figure 7. A Hartmann screen which is an opaque plate drilled with many fine holes (figure 7a) is placed in front of the objective of a telescope as shown in figure 7b and photographic plates positioned either side of the focal plane of the objective lens (figure 7c). Naturally, not much light passes through the mesh of fine holes but after a lengthy exposure time, faint dots appear on the photographic screen (also known as a Hartmann Plate), and their positions on the plate are measured and compared with the positions of the holes which have produced the spots. This method is mostly obsolete now, as the Hartmann-Shack test has replaced it.

Figure 7: The Hartmann test
To overcome the problem of the low light density arriving at the Hartmann Plate, the American scientist, Roland Shack5 suggested that the Hartmann screen be replaced by a series of tiny lenses, of a similar diameter to the holes in the original plate, which would focus light onto the plate, thereby increasing the photon density arriving at the plates. Today, the two plates are replaced by a single CCD, the geometry of whose pixels is precisely known, whereupon any displacement due to the aberrations from the lens with respect to the ideal wavefront, are used to compute the aberrations (in terms of Zernike polynomials), and thence, the wavefront. The information received by the CCD is analysed by an onboard computer, whose software enables it to compute and map the wavefront to produce iso-astigmatism and iso-mean power mappings.
The principle of the Hartmann-Shack Test (also called the Shack-Hartmann Test by some authors) is given in figure 8 which shows a series of tiny lenslets, arranged in a vertical line which will produce a strip of point foci on a screen placed in their common focal plane. Clearly, if the lens diameters are known together with the separation of their centres, and their focal lengths, the exact position of each point focus on the screen is known, and any departure from the ideal position can be recorded.

Figure 8: Priniciple of Hartmann-Shack test
A typical set-up for the Hartmann-Shack sensor is illustrated in figure 9. Collimated light, having passed through the lens under test, arrives at the CCD sensor which records the positions of the stimulated pixels from which the wavefront map can be built up and an analysis made of the lens. Figure 10 illustrates typical output from the Visionix V40 instrument produced by this method where the on-board computer software has converted the point displacements into power and astigmatism plots to illustrate the performance of the lens.

Figure 9: Recording the errors inthe focusing positions in the Hartmann-Shack test
Another analysis method, known as Moiré deflectometry, is employed in larger lens mapping instruments, typical of those used by lens manufacturers for testing the accuracy of the manufactured surface.

Figure 10: Typical output from the Visionix VX 40 Automated Lensmeter
Moiré fringes are formed when two sets of repetitive lines are laid on top of one another with one set of lines slightly rotated with respect to the other (figure 11), the intersection of their lines produces another set of lines which form the moiré fringes. The fringes are illustrated in figure 11 where figure (a) shows a single set of lines and figure (b) shows the result of superimposing a second set of lines upon the first with an angle of 5º between the lines.

Figure 11: Moiré fringes
The distance between the centres of the fringes, M, is given by
M = (d) / (2 sin (θ/2))
where d is the distance between the lines and θ is the angle between the lines. Figure 11a was constructed with the lines 1mm apart and in figure 11b the second grid has been rotated through 5º, so θ/2 = 2.5º. The distance between the fringes is, therefore 11.5mm. Over the length of the grid overlap (about 50mm), four fringes will be visible.
In figure 11c the second grid has been rotated through 14º, so θ/2 = 7º. The distance between the fringes is, therefore 4.1mm and over the length of the grid overlap, 11 fringes are visible.
Production of the fringes can also occur by the shadow technique where the fringes can be observed when the shadow of a single grid is viewed through the grid or by projection where the image of one grid is projected onto the surface and the reflected image viewed through a second grid. The Rotlex Class Plus lens mapping instrument,6 developed from the OMS 400, was one of the first large lens mappers to use Moiré deflectometry, the principle of which is shown in figure 12.

Figure 12: Moiré deflectometry
It is certain that, in the future, other instrument manufacturers will introduce lens mapping instruments to aid the practitioner to view the quality of the progressive surface and to obtain contour plots which show the overall performance of a progressive lens.
Professor Mo Jalie is a visiting professor at Ulster University and author of the new edition of Principles of Ophthalmic Lenses.
References
1 Jalie M, (2016) Progressive power lenses (Part Two), Optician Vol 252, No 6,569 p24-31 .
2 Jalie M, (2016) Principles of Ophthalmic Lenses (5th Ed.) ABDO, Godmersham p43.
3 Jalie M, (2016) Progressive power lenses (Part One), Optician Vol 252, No 6,565 p18-26.
4 Grafton Optical Company, Crown Hall, The Crescent, Watford, WD18 0QW. (grafton optical.com see also visionix.com).
5 Shack RV & Platt BC, (1971) Production and use of a Lenticular Hartmann screen, J Opt Soc Am A 61(5),656.
6 Rotlex, Building 2D, Omer Industrial Park, Omer 84965, Israel (rotlex.com/class-plus).