Look at the cross in the centre of the row of letters shown in figure 1. Without moving your eyes from the cross, how many letters you can identify on either side?

Figure 1: Looking only at the cross, how many letters can you identify on either side?
This simple demonstration reminds us that good visual acuity is limited to a surprisingly small area of the central visual field – in terms of acuity, we all have tunnel vision. The primary purpose of the peripheral retina is to detect and localise objects of interest allowing the oculomotor system to rotate the eyes and place the object on the fovea where it can be resolved and identified. This functional inhomogeneity is so well disguised by the perceptual mechanisms that most people are unaware of it until it is actively demonstrated.
While this design feature of the visual system greatly reduces the quantity of data to be transmitted and processed, having only a small area of high resolution vision does place huge demands on the oculomotor system.
The six extraocular muscles, controlled by a complex series of neural networks, have risen admirably to the challenge, performing a delicate balancing act as the eyes are moved at velocities in excess of 500 degrees per second and positioned with an accuracy of less than one degree.
However, this constant movement of the eyes (and the corresponding movement of the retinal image) introduces a significant perceptual challenge. Anybody who has been made to sit through a home video will be familiar with the nausea induced by the constantly moving image as the amateur cameraman pans the scene in an attempt to capture the joy of the moment. However, our perceptual world remains remarkably stable as the eyes dart around the visual field. This is attributable to a variety of perceptual mechanisms which suppress perception during the eye movement and remap spatial localisation every time the eyes are moved. The sum total of this remarkable piece of design and engineering is a seamlessly integrated and stable perceptual world.
While there is a vast literature on eye movements and the neuro-muscular mechanisms controlling them,1-10 clinical assessment of eye movements and binocular vision is still surprisingly rudimentary. The revolution in ophthalmic instrumentation seems to have bypassed binocular vision and most clinicians still rely on tests such as the motility test and cover test perhaps supplemented with a Maddox rod test and fixation disparity. Useful though these tests may be, they provide rather limited information about such a complex system.
Instruments for measuring eye movements have been used in research laboratories and specialist clinics for many years but their high cost and complexity has limited their uptake in clinical practice. However, with advances in technology, this could be about to change.
A bit of history
The science of eye tracking can be traced back to the early 19th century but one of the first formal observations was made by a French ophthalmologist named Louis Émile Javal in 1879. By simply observing the eyes via a system of mirrors, he noted that the eyes did not sweep smoothly across the page when reading, but rather made a series of short stops on individual words. These short stops became known as fixations while the rapid eye movements from one fixation to another became known as saccades.
In the early 20th century, an educational psychologist named Edmund Huey built one of the first eye trackers. His device consisted of aluminium pointers attached to a rudimentary contact lens. While this was capable of recording eye position on a smoked drum, the subject was unlikely to make natural eye movements while wearing such an invasive device. The first non-invasive eye tracker was developed by Guy Buswell who used beams of light reflected from the cornea onto a photographic plate.
A seminal moment in eye tracking research was the publication of a book in 1967 by a Russian psychologist named Alfred Yarbus.11 In it he summarised the outcome of a number of studies showing the potential value of eye tracking, not only for assessing oculomotor function, but as a way of analysing cognitive function – the underlying hypothesis being that fixation tends to follow attention. This spawned a large number of studies covering a diverse range of disciplines including cognitive science, psychology, neurology, human-computer interaction, reading, driving, marketing, communication systems for the disabled to name but a few.
With increasing interest in eye tracking, attention turned to the development of instruments to underpin this research.
Classification of eye trackers
Eye trackers can be divided into three broad categories:
Devices attached to the eyes: These devices require some form of attachment to the globe itself. Early eye trackers used physical pointers attached to a tightly fitting contact lens. These were difficult to fit, uncomfortable and added inertia to the eye which in turn affected the characteristics of the eye movements recorded.
Another approach was to place the head within a magnetic field and record the electrical potential generated in a coil fitted around the limbus as the eyes moved. These scleral search coil systems were extremely sensitive and were the method of choice for researchers studying the precise dynamics of eye movements.12-14
Electro-oculography: As the cornea is slightly positive with respect to the posterior pole of the eye, the potential difference between skin electrodes placed on either side of the eye reflects the rotation of the eyes in the orbit. By attaching electrodes at the inner and outer canthus and above and below the eye, signals correlating to the horizontal and vertical rotation of the eyes can be recorded. With suitable calibration, this can be related to gaze position. As the electrodes are outside the visual field, this technique has the advantage of being completely non-invasive. However, the cornea-retinal potential tends to drift, particularly as the eye light and dark adapts and this necessitates frequent recalibration and limits this technique to non-quantitative studies.
Optical-tracking: Devices in the third broad category typically use an optical sensor or camera to detect changes in the position of the limbus, iris, pupil or various reflections (Purkinje images).15,16
Limbal-tracking devices typically use infrared (IR) LEDs mounted on a trial frame or spectacle frame to illuminate small areas of the temporal and nasal limbus (figure 2). IR sensors then detect the amount of IR reflected from these areas. As the eye rotates nasally the amount of light reflected from the temporal limbus increases as the low reflectance iris moves out of the collection area while the light from the nasal limbus decreases. The difference between these two signals relates to the horizontal position of the eyes. With suitable calibration, systems based on this technology can be reasonably accurate. However, they require the use of rather invasive goggles and are somewhat fiddly to set up and calibrate.

Figure 2: A limbal tracking system
Most modern eye trackers use IR video cameras or optical sensors to detect the position of the Purkinje images relative to the pupil (figure 3). As the eye moves, the reflections move within the pupil and the vector between the pupil centre and the reflections can be used to compute the gaze direction.
Figure 3: Optical tracking systems often use the position of the Purkinje images relative to the pupil to calculate gaze direction
As IR light is used and the sensors are placed remotely, these systems are completely non-invasive. Furthermore, algorithms are employed to compensate for head position allowing the subject to move reasonably freely within a ‘measurement cube’.
Modern systems are capable of measuring gaze position at rates in excess of 1,000Hz with an accuracy of better than one degree. The high cost of such systems has limited their application to research laboratories and commercial organisations.
However, a number of manufacturers have recently introduced consumer-oriented systems at a much reduced price. The application of these systems is normally restricted to computer games and specific applications. However, working closely with Tobii, one of the leading manufacturers of eye tracking systems, Thomson Software Solutions has created a Clinical Eye Tracker system which, at around a tenth of the price, has opened up the technique to community and hospital optometry practice. Since its launch just over a year ago, over 100 optometric practices, hospital eye departments and universities have installed the system and are reporting excellent results (see later).
The Clinical eye tracker
The Clinical Eye Tracker uses a Tobii eye bar which is attached to the lower bezel of a standard monitor (figure 4). The eye bar incorporates three IR LEDs to illuminate the eyes and two IR video cameras to detect the pupils and the Purkinje images. The bar connects via USB3 to a PC running Windows 7 or later (2.0 GHz quad core Intel i5 or i7, 8GB RAM recommended). The bar samples gaze position more than 60 times per second with an accuracy of better than one degree.

Figure 4: The Clinical Eye Tracker
The system requires a dual monitor arrangement so that the stimuli can be presented on the screen with the eye bar while the results are monitored on the second screen. The control and analysis software has been developed by Thomson Software Solutions.
A recording session commences with a simple calibration procedure where the patient, viewing the screen from approximately 60cm, looks at dots in four corners of the screen until they ‘explode’ (figure 5). This process takes less than a minute to complete.

Figure 5: Calibration takes less than one minute
The test stimulus is then presented on the patient’s screen and the clinician commences the recording. The software includes a huge range of stimuli for investigating saccades, pursuit movements and optokinetic nystagmus. It also includes text to assess reading performance against different coloured backgrounds. Other stimuli can be uploaded to the software in the form of text or images.
Figure 6 shows a set of results obtained while a patient was reading a few rows of text. The horizontal eye position panel shows the typical saw-tooth pattern as the eye makes a series of fixations interspersed with small left-to-right saccades with a larger right-to-left saccade to return to the beginning of the next row.
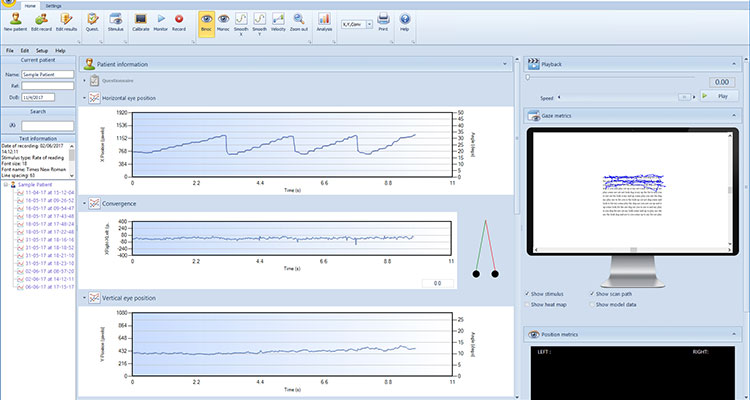
Figure 6: Screen shot of the Clinical Eye Tracker
The convergence panel shows the difference in horizontal gaze position for the right and left eyes. If the two eyes are perfectly aligned in terms of gaze position, this trace remains at zero, while any over or under convergence shows as a positive or negative deviation respectively. This trace is useful for analysing any convergence instability. It can also be used to analyse eye movements during a cover test (see later). The vertical eye position panel shows the vertical gaze position of the eyes as a function of time. In this case it simply shows the small vertical saccades made when moving from one row to the next.
The gaze metrics panel shows the complete X-Y scan path during the recording superimposed on the stimulus. Alternatively, the recording can be replayed in real time using the playback panel. This feature is particularly useful for demonstrating a pattern of eye movements to patients (or their parents).
New users are often struck by the instability of the eyes, even when the patient is attempting to fixate. While there may be an element of instrument ‘noise’, the eyes are actually constantly in motion even when ‘fixating’. These involuntary eye movements known as micro-saccades, drifts and tremor, have been shown to be vital for maintaining perception.
The position metrics panel displays the exact position of the centre of each pupil and the distance of the eyes from the screen at that instant. It also calculates the horizontal and vertical pupillary distance and head tilt.
The gaze position of each eye can be shown independently by selecting Monoc (figure 7). The gaze position of the two eyes should be closely matched as shown. Any significant separation of the two traces suggests convergence instability.

Figure 7: Horizontal gaze position for the right (red) and left (green) eyes while reading
Any disparity in gaze position between the two eyes is also shown in the convergence panel and can be visualised by viewing the graphic to the right of the panel (figure 8).
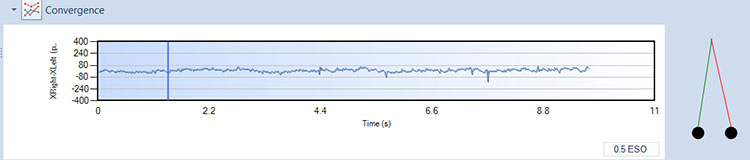
Figure 8: The convergence panel shows the difference in gaze position of the right and left eyes
This ability to evaluate binocular vision while the patient is performing a dynamic task such as reading or searching opens up a new level of understanding of binocular vision anomalies. Most conventional tests assess binocular vision while the eyes are fixing and static. This provides a rather unrealistic assessment of real-world performance where the eyes will be constantly scanning the visual field.
The Clinical Eye Tracker also opens up exciting opportunities for revisiting familiar binocular vision tests. Figure 9 shows the results of an alternating cover test performed on a patient with an exophoria. A bespoke cover has been developed which is opaque to visible light but transparent to IR light which allows the cameras to monitor the position of the ‘occluded’ eye. The trace below shows the eye behind the cover drifting outwards. As the cover is moved to the other eye it makes a saccade to take up fixation while the other eye starts to drift outwards behind the cover. As the test progresses, the exophoria builds and breaks down to an exotropia.

Figure 9: Eye movement recordings during an alternating cover test performed on a patient with an exophoria.
The Clinical Eye Tracker includes a variety of tools for analysing and quantifying eye movements. Figure 10 shows a detailed analysis of the reading eye movements shown in figure 6.

Figure 10: Detailed analysis of eye movements made while reading four lines of text
The software has recognised that four rows of text have been read and automatically identified and measured individual fixations and saccades on each row.
The duration of each fixation during the recording is shown in the histogram on the right of the fixation duration panel and a frequency histogram of these fixation durations is shown on the left.
The size of every saccade is shown on the right of the saccade metrics panel. The short positive bars represent the small left-to-right saccades as the patient shifted fixation from one word to the next. The longer negative bars represent the large right-to-left movement made at the end of each row. The analysis automatically detects regressions (where the patients goes back to re-read a word) and calculates a variety of useful summary statistics.
Eye tracking in practice
Comfortable vision requires optimum refractive correction and optimised binocular vision. Conventional binocular vision tests mainly assess binocular function while the eyes are static whereas the Clinical Eye Tracker assesses binocular vision while patients conduct a variety of dynamic real-world tasks.
Furthermore, conventional tests usually rely on the skill of the clinician to observe and grade any anomalies in eye movements – the Clinical Eye Tracker allows eye movements to be recorded and quantified.
The Clinical Eye Tracker is proving to be a valuable tool for assessing patients with visual stress. Comparing the pattern of eye movements while reading against a white background with performance when reading from a coloured background provides valuable objective evidence for the benefits of colour.
The Clinical Eye Tracker can also be used to assess the effectiveness of prisms and refractive correction while the patient performs a series of demanding visual tasks. The benefits of various forms of vision therapy can also be assessed objectively instead of relying solely on reported symptoms.
Clinical applications
The Clinical Eye Tracker is increasingly being used as a tool in managing reading difficulties with children where it has proved useful in managing accommodation lag anomalies and vergence during reading. It is also the only objective method for identifying patients who benefit from coloured filters.
It is not possible to fully investigate reading performance with conventional clinical tests. The Clinical Eye Tracker is able to record and quantify eye movements and binocular vision while children are actually performing real-world tasks such as reading. This provides new insights into dynamic binocular vision and reading performance.
Conclusion
Eye tracking in clinical practice is at the beginning of a long and exciting journey. In the same way that it has taken a number of years to become proficient at ‘reading’ the images provided by OCTs, it will probably take a while for clinicians to learn how to interpret the various patterns of eye movements which are begin ning to emerge. At this stage, no new interventions are being offered but at least the effectiveness of existing interventions can now be properly evaluated. As researchers and clinicians begin to use this new technology in a clinical environment, it seems highly likely new tests and interventions will begin to emerge and eye tracking will gradually become a key part of the optometric/orthoptic examination.
Professor David Thomson is former professor at City University and is founder of Thomson Software Solutions.
References
1 Carpenter, Roger HS. Movements of the Eyes (2nd ed.). Pion Ltd, London, 1988. ISBN 0-85086-109-8.
2 Hoffman JE. (1998). Visual attention and eye movements. In H Pashler (ed.), Attention (pp. 119–154). Hove, UK: Psychology Press.
3 Huey EB. (1968). The psychology and pedagogy of reading. Cambridge, MA: MIT Press. (Originally published 1908).
4 Jacob RJK & Karn KS. (2003). Eye Tracking in Human-Computer Interaction and Usability Research: Ready to Deliver the Promises. In R Radach, J Hyona, & H Deubel (eds.), The mind’s eye: cognitive and applied aspects of eye movement research (pp. 573–605). Boston: North-Holland/Elsevier.
5 Just MA, Carpenter PA (1980) A theory of reading: from eye fixation to comprehension. Psychol Rev 87:329–354.
6 Pirri F, Pizzoli M, Rudi A, (2011). A general method for the point of regard estimation in 3D space. Computer Vision and Pattern Recognition (CVPR), 2011 IEEE Conference on, 921-928.
7 Rayner K (1978). Eye movements in reading and information processing. Psychological Bulletin. 85: 618-660.
8 Rayner K (1998). Eye movements in reading and information processing: 20 years of research. Psychological Bulletin. 124: 372-422.
9 Riggs LA, Armington JC, Ratliff F. (1954). Motions of the retinal image during fixation. JOSA. 44: 315-321.
10 Riggs LA, Niehl EW. (1960). Eye movements recorded during convergence and divergence. J Opt Soc Am. 50: 913.
11 Yarbus AL. (1967), Eye Movements and Vision, New York: Plenum. (Originally published in Russian 1962).
12 Ferguson RD (1998). Servo tracking system utilizing phase-sensitive detection of reflectance variations. US Patent # 5,767,941.
13 Robinson, DA. A method of measuring eye movement using a scleral search coil in a magnetic field. IEEE Trans. Biomed. Eng. vol. BME-l0, pp. 137-145, 1963.
14 Eizenman M, Hallett PE, Frecker RC. (1985). Power spectra for ocular drift and tremor. Vision Res. 25: 1,635-40.
15 Cornsweet TN, Crane HD (1973). Accurate two-dimensional eye tracker using first and fourth Purkinje images. J Opt Soc Am. 63: 921-8.
16 Cornsweet TN (1958). New technique for the measurement of small eye movements. JOSA. 48: 808-811.