Fundus autofluorescence (FAF) is a non-invasive imaging technique, which detects naturally or pathologically occurring fluorophores, molecules that absorb and emit light of specific wavelengths. Although first described in the 1970s by Machemer et al 1 in the setting of a fluorescein angiography procedure as ‘pseudofluorescence’ observed prior to the injection of fluorescein dye, the FAF properties of the retina were initially viewed as a distraction. It is primarily through the work of Delori in the 80s and 90s that these properties have been shown to be important in the diagnosis and monitoring of disease progression and in the classification of retinal dystrophies.2 As a result of this, new devices and techniques have been developed to begin harnessing the full potential of this approach to retinal imaging.
A Brief History
The invention of the ophthalmoscope in 1850 by Hermann von Helmholtz meant that, for the first time, clinicians were able to view the retina in a living patient. In 1886 Jackman and Webster published the first in vivo fundus photograph and retinal imaging was born. In 1910, the fundus camera was developed by Gullstrand and his concept continues to be used in modern retinal imaging.
The next major development in retinal imaging came in 1961 when two medical students, Novotny and Alvis, first demonstrated fundus fluorescein angiography (FFA) in the human eye. For this technique, a fundus camera is modified by the deployment of narrow band filters to image a fluorescent dye which is injected into the subject’s bloodstream. This fluorescein dye binds to leukocytes and the ocular circulation is imaged to aid in the diagnosis of retinal and choroidal vascular disease.
The introduction of high resolution digital retinal imaging systems in the 1990s saw the addition of indocyanine green (ICG) dye which had long been used in the study of cardiac blood flow. The enhanced sensitivity of digital cameras to the infrared wavelength allowed real time observation of ICG dye in the circulation. This technique currently is mainly used to observe choroidal blood flow. ICG images are therefore complimentary to FFA images, which are primarily used for imaging the retinal circulation.
FAF differs significantly from FFA and ICG in that it is a non-invasive diagnostic imaging technique which can visualise both age and disease-related metabolic changes of the retinal pigment epithelium (RPE) without the need for a dye injection. The relatively low signal strength of FAF is approximately two orders of magnitude less than the peak signal of fluorescein angiography.
What is Autofluorescence?
The natural emission of light by biological structures, subsequent to the absorption of light is termed autofluorescence. Some organelles, specialist subunits within cells with their own specific function (such as lysosomes) possess this characteristic. However, it is not the lysosomes themselves that are directly responsible for this emission, but rather autofluorescent molecules or fluorophores (FL) within them. While there are numerous different fluorophores (such as collagen or melanin) occurring in plants, animals and other organisms such as bacteria, it is the lipofuscin (LF) of the retinal pigment epithelial cells that is the major source of fundus autofluorescence in humans.
In many cell types, the origin of lipofuscin is internal (autophagy), but in the case of the RPE they are mainly derived from the outer segments of photoreceptor cells through the digestion process of phagocytosis. In the eye, the daily process of phagocytosis, whereby the spent outer segment of the photoreceptors is ingested by the RPE, is a critical part of the maintenance process required to maintain vision. Over time, it is suggested that up to 25% of the RPE cells’ volume will be occupied by lipofuscin granules. It has been postulated that this reduction in functional volume of the cells might play a significant role in compromising RPE function.
N-retinyl-N-retinylidene ethanolamine (A2E) is the most clearly characterised fluorescent pigment of lipofuscin. It is derived from vitamin A-aldehyde and ethanolamine and has an excitation wavelength of 430 to 450nm with maximum emission at 560 to 575nm. A2E accumulates in RPE lysosomes and is thought to exert a host of toxic effects on the RPE cells. A2E is implicated in many degenerative retinal diseases and, in particular, age-related macular degeneration (AMD). Irradiation by blue light causes it to undergo photo-oxidation and generates reactive oxygen species. However, A2E accumulation may not be a source of retinal damage, but rather a marker for abnormal visual cycle activity.
Although the eye contains several elements with autofluorescent properties, including the crystalline lens and macular pigments, we are primarily interested in FAF which occurs in response to the irradiation of the retina with light at an appropriate wavelength and the subsequent emission by the FL.
LF has a broad range of excitation (300 to 600nm) and a broad emission spectrum (480 to 800nm). It is therefore possible to carry out FAF using a blue or green light source (figure 1).
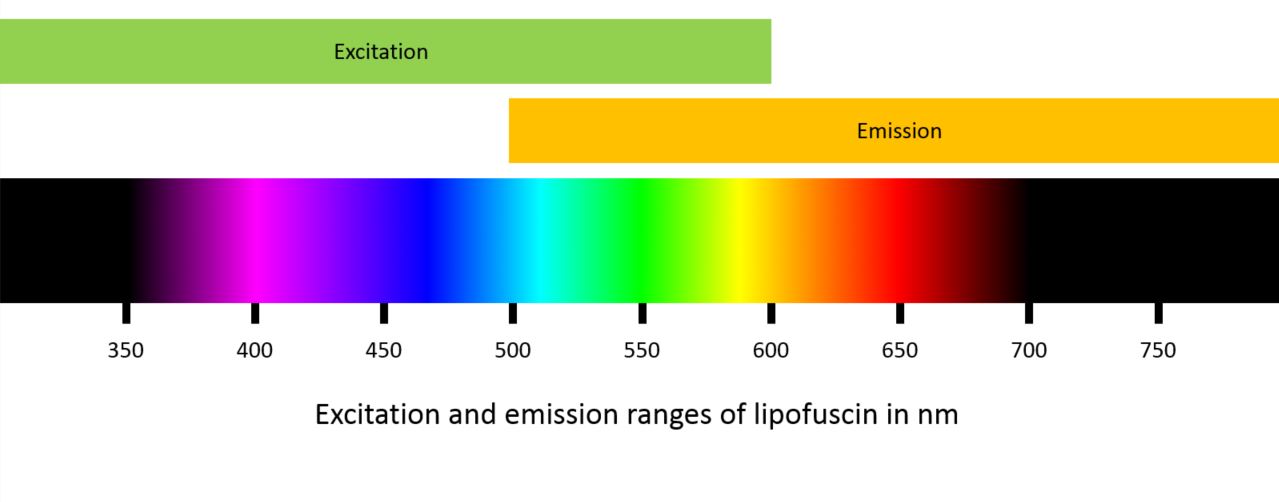
Figure 1: Excitation and emission ranges of lipofuscin
How is it Achieved?
Historically, there have been two primary methods used to record FAF:
- Confocal scanning laser ophthalmoscopy (cSLO), with the key device being the Heidelberg Spectralis which operates in the blue spectrum (488nm)
- Modified fundus photography, which uses excitation filters in the green spectrum (535 to 580nm), recording emission in the yellow-orange spectrum (615 to 715nm).
A recent addition to the list of devices with FAF capability is the Eidon AF (from CenterVue). This so called ‘true colour’ confocal scanner captures images in three different modes; colour using an LED source (440 to 650nm), infrared (825 to 870nm) and FAF using a blue light source (440 to 475nm).
As well as green and blue light, FAF imaging using near-infrared light with very long wavelengths outside of the visible spectrum can also be used. Near-infrared FAF imaging uses light with a wavelength in the region of 790nm, just outside the detection of human vision and excites molecules other than LF, in particular melanin.
The distribution of melanin, found in both RPE cells and melanocytes and primarily distributed at the fovea, provides different information about disease processes. For example, in age-related macular degeneration a decrease in the melanin content of the RPE indicates a high level of disease severity.
Rhodopsin, which is concentrated in the outer segments of photoreceptor cells, is a visual pigment that absorbs the excitation beam, therefore decreasing autofluorescence. Over time and continual exposure to light, it undergoes photo-isomerisation resulting in a reduction of its absorptive capabilities. This so-called bleaching effect is only seen with short wavelength excitation beams resulting in an increase in FAF of up to 30% after exposure.
Blue versus Green Light
The two key approaches to FAF, namely excitation using a blue or green light source, each present their own advantages and disadvantages. Imaging in the green light spectrum provides more detail at the fovea when compared with blue light FAF. This is because the high concentration of macular pigment (xanthophyll), which is predominantly yellow, absorbs blue light resulting in a dark spot at the fovea. It is possible that this dark patch could in some cases be mistaken for geographic atrophy which has a similar appearance when imaged using a blue light source.
Another advantage of longer-wavelength green light is that absorption by the autofluorescent anterior structures of the eye, in particular the crystalline lens, is minimised. The yellow nature of the lens (especially in patients with cataracts) means that a significant amount of shorter wavelength blue light is absorbed. The confocal optics of the blue light cSLO systems and the Eidon AF compensate for the shorter wavelength of the light source by concentrating light detection on a single optical plane. This pinhole approach reduces dramatically scattered light and the interference produced by structures outside of the retina, such as the crystalline lens.
Image Capture

Figure 2a Single frame capture image from the Eidon AF
Most cSLO systems produce an image using real-time averaging, whereby multiple images (up to 16) are captured, registered and then averaged, producing high-resolution, high contrast images. However, although the quality of the resulting images and their ability to illustrate structures that may be relatively weak in terms of their autofluorescence and therefore not visualised using a green light source is undeniable, it may be difficult to acquire useful images in patients with poor fixation due to the relatively long image capture time. In contrast to the averaging approach taken by the cSLO devices, the Eidon AF uses a single frame capture to generate an image (figure 2a) that is similar in appearance to those produced by the scanning laser devices such as the Spectralis (figure 2b).

Figure 2b: Real time averaged image from the Spectralis
Clinical Application of Autofluorescence
Hyper versus hypo
The clinical uses of FAF imaging are many and varied, from mapping the progress of age related macular degeneration to the categorisation of retinal dystrophies such as Best and Stargardt disease. However, in terms of visual presentation, lesions can be described in two key categories:
- Hyperfluorescence
- Hypoautofluorescence.
The appearance of the normal healthy retina when imaged using FAF is illustrated in figure 3, which demonstrates the spatial distribution that corresponds to the intensity of the signal emitted by the LF. This produces dark pixel values where there is low emission intensity and bright values where high intensities of light are emitted by the LF. Typically, the optic disc will appear dark (almost black) due to the complete absence of LF in a healthy subject, as will the retinal vasculature, which blocks entirely the signal being emitted from the RPE.
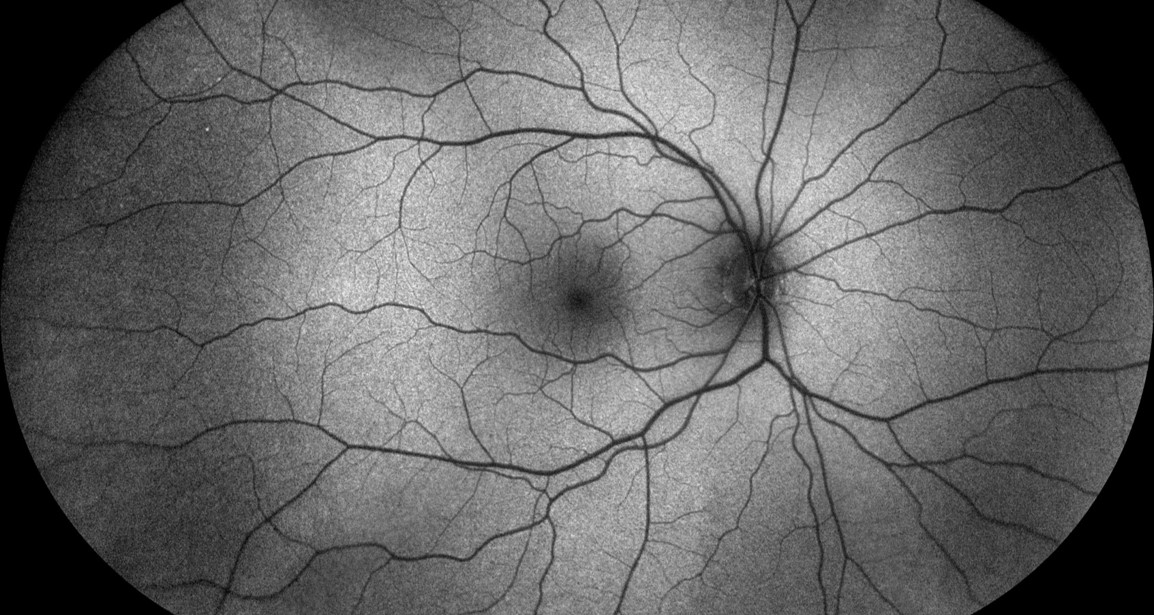
Figure 3: Fundus autofluorescence image of the normal fundus
As described previously, the FAF signal is also greatly diminished in the macula, particularly around the fovea due to the absorption by macular pigment. Although this results in a dark area in images captured using blue light, this phenomenon is much less apparent when a green light source is used (figure 4a and 4b).

Figure 4: Left and right retina using blue light (a) and green light (b)
AMD
The global prevalence of AMD has been calculated at 8·7%,3 and is known to be higher among Europeans compared with Asians and Africans. Both the dry and the wet types of AMD are associated with loss of vision and it is in dry, non-neovascular AMD where FAF imaging has proved to be most useful. Geographic atrophy associated with dry AMD is the second most important aetiology of visual loss with the disease after neovascularisation.
FAF is particularly effective when imaging geographic atrophy (GA) (figure 5), which appears as very dark or black patches of hypoautofluorescence with clear boundaries of hyperautofluorescence demarcating the extent of RPE death.
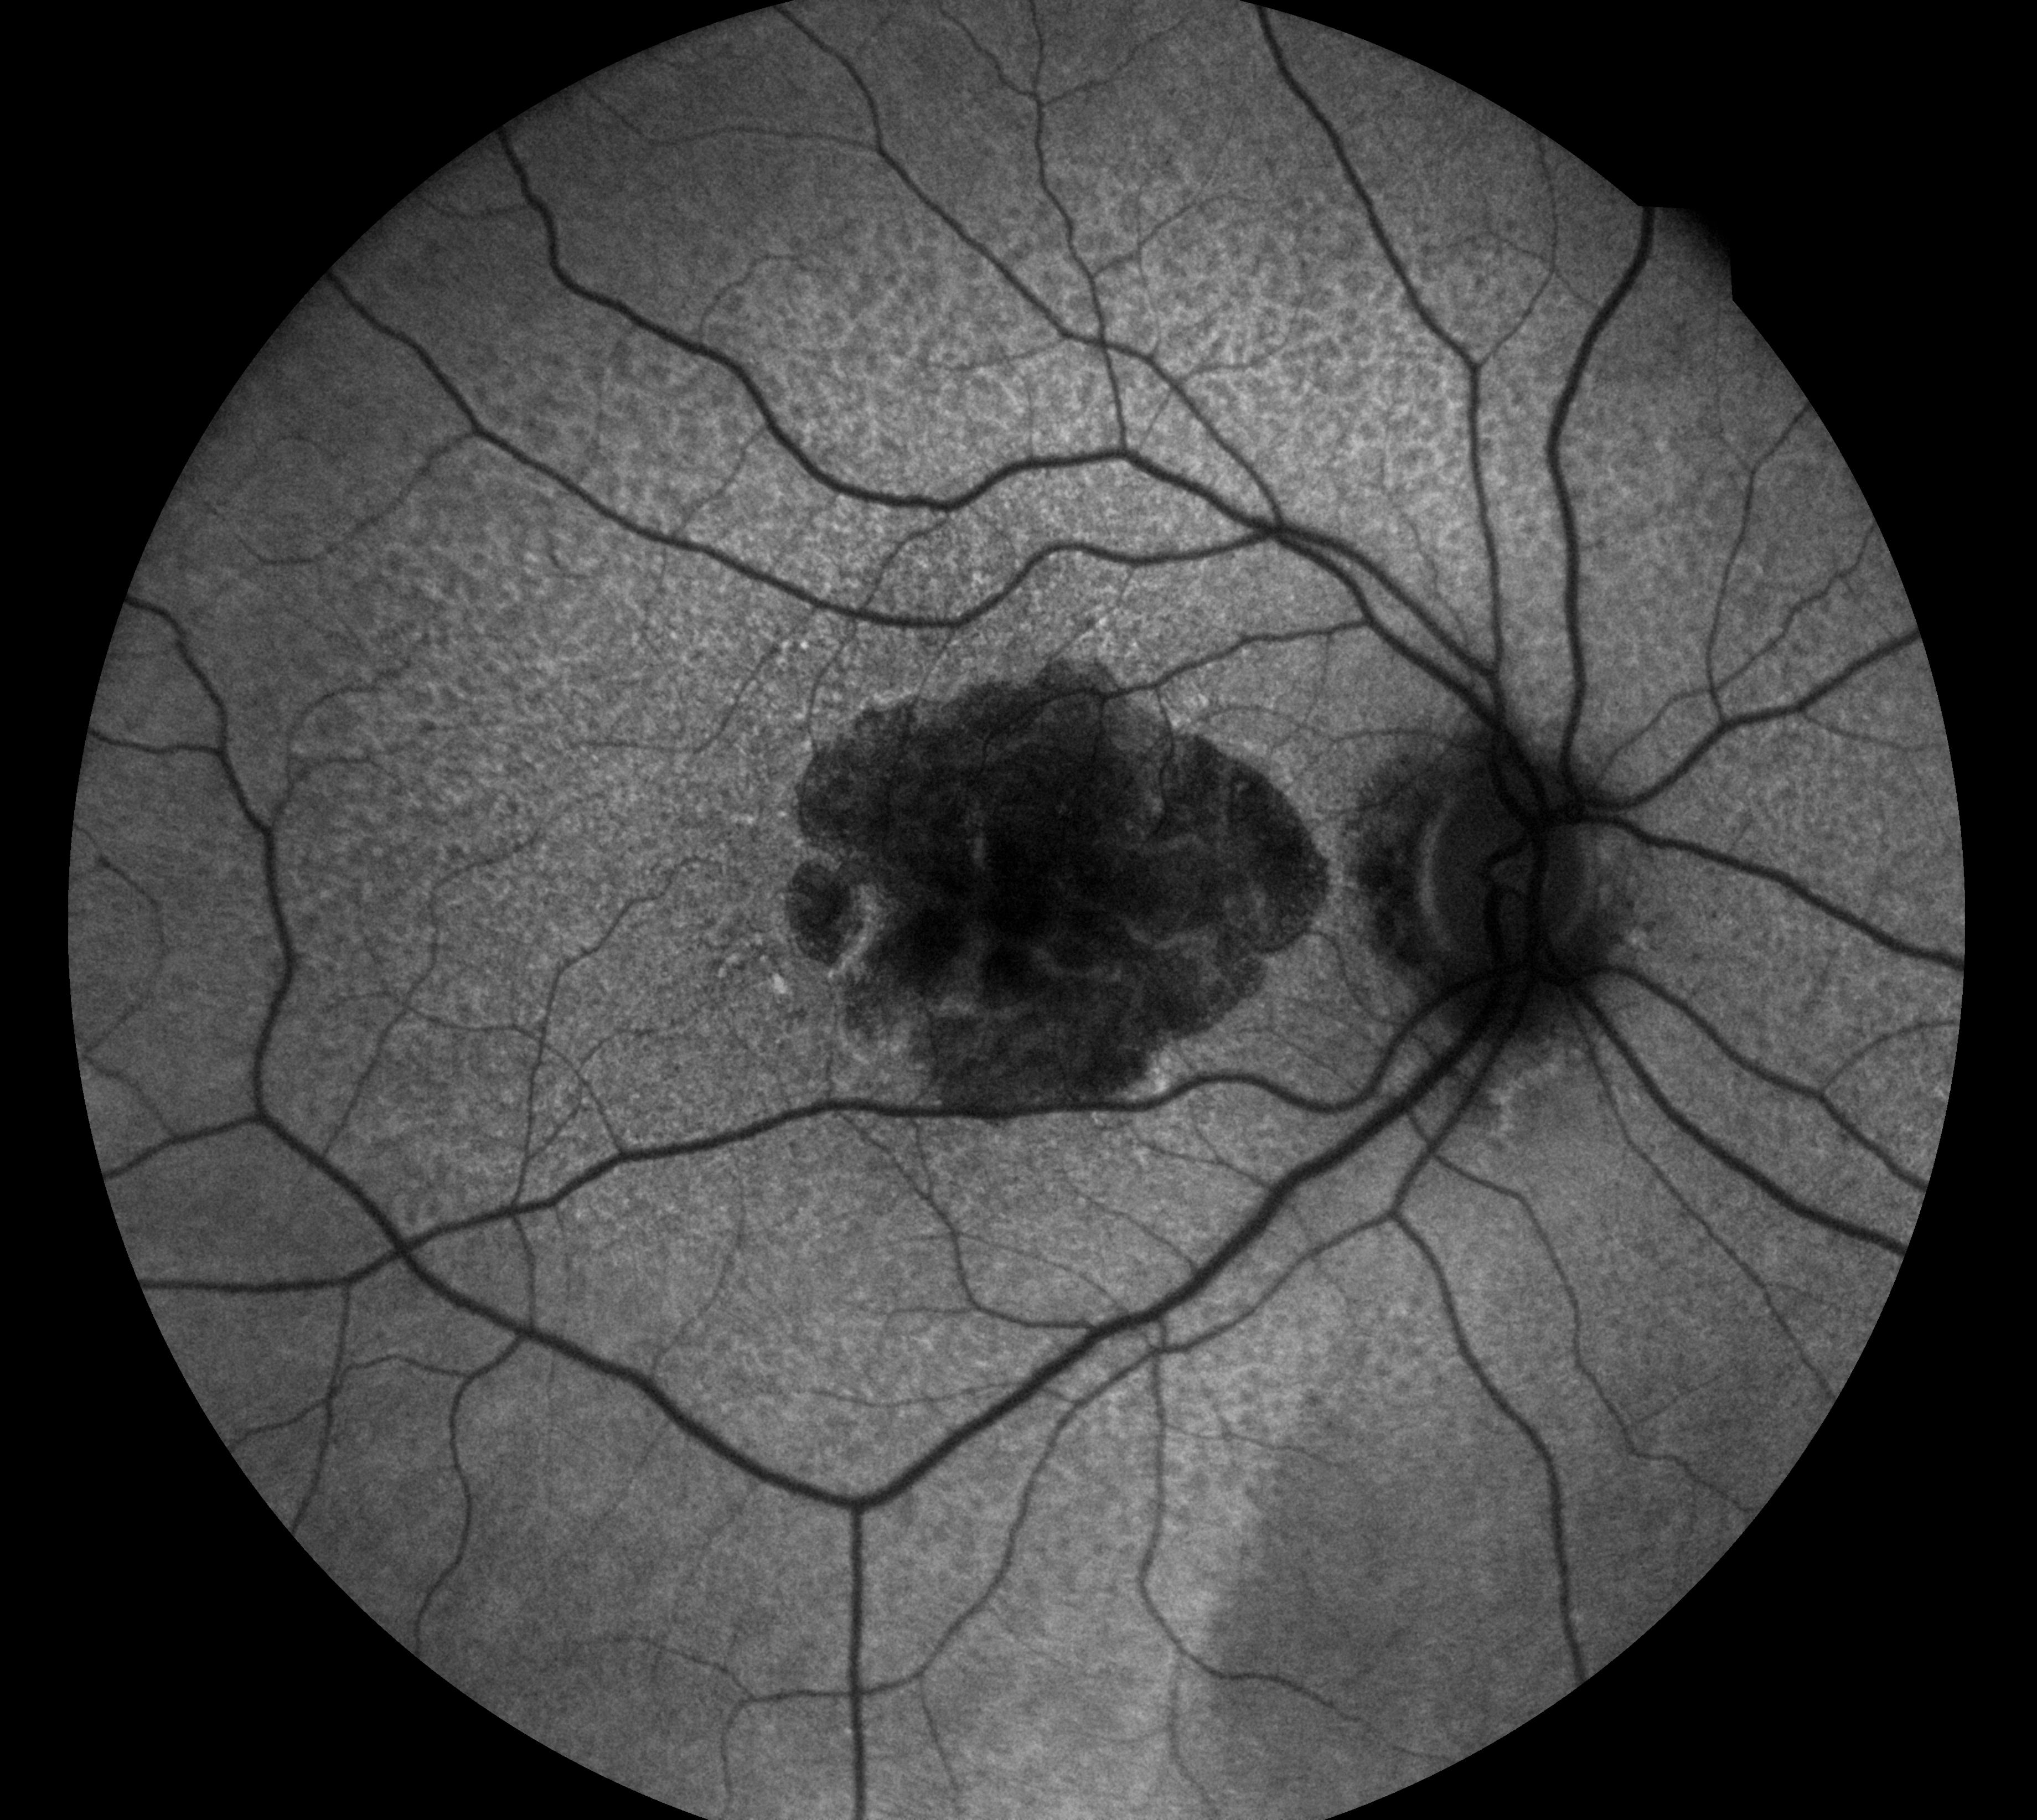
Figure 5: Geographic atrophy
The ability to prognosticate in cases of dry AMD through the sub-classification of GA patterns is a key outcome of FAF imaging and one where the technique surpasses all other methods of retinal imaging currently available. Five distinct patterns in the junction zone in patients with GA have been described. Eyes which do not exhibit any signs of increased FAF are classified as ‘none’. Eyes with increased FAF are divided into two groups relating to the configuration of the increase in FAF around the GA. Where the only increase is at the margin of the existing GA eyes are split into three sub classifications; focal, banded and patchy. In general, such cases usually have a very slow progression over many months or years. Diffuse patterns of GA are subdivided into five different categories; reticular, branching, fine granular, trickling or granular with patchy staining (GPS). In each of these diffuse patterns there will be areas of hyperautofluorescence elsewhere as well as at the margins of the GA. In such cases progress is likely to be very rapid.4
The presence of choroidal neovascularization (CNV) is a defining factor in wet or neovascular AMD and is sub-divided into a number of key types. In type 1, the CNV is located under the RPE, whereas in type 2 (figure 6) and type 3 the neovascularisation is located intraretinally and originates from the deep capillary plexus.
In early CNV, FAF will not detect neovascularisation. This is because the ‘healthy’ RPE and photoreceptors reflect the light source and neither abnormal hyper or hypo-fluorescence is visible. However, in both classic type 2 and occult type 1 CNV the neovascularisation appears hypoautofluorescent (figure 6). In about one third of cases, these areas of hypoautofluorescence may be bordered by hyperautofluorescence associated with photoreceptor cell loss or RPE proliferation, a so-called window defect.
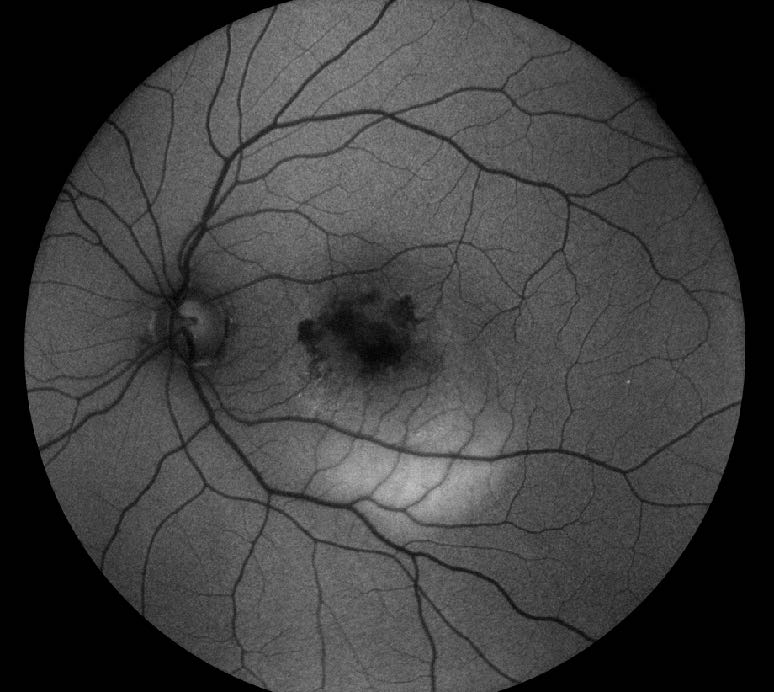
Figure 6: Hypoautofluorescence in choroidal neovascularisation
In about one third of cases of dry AMD, the FAF pattern may predict a conversion to wet AMD, with those cases displaying a patchy pattern of FAF most likely to progress.
Tears in the RPE are a well know complication in neovascular AMD and are visualised well using FAF imaging, appearing as well demarcated areas of hypoautofluorescence where the RPE is absent. There is often an area of adjacent hyperautofluorescence corresponding to the rolled back RPE.
Disc drusen
The appearance of drusen on FAF imaging are varied depending on the size, composition, and health of the overlying RPE and can present both normal hyper or hypoautofluorescent patterns. FAF changes are more likely to be seen in large drusen, which will appear hyperautofluorescent, whereas medium-sized drusen will exhibit hypoautofluorescence at their centre with a ring of hyper-autofluorescence at the outer edge. Small drusen are much less likely to be detected using FAF imaging and regressed drusen may present as spots of reduced autofluorescence preceding GA.
Patients with significant tortuosity of the retinal vasculature will often have associated optic disc drusen, which is not easily visualised using standard colour retinal imaging techniques, but will appear as spots or patches of extreme hyperautofluorescence (figure 7).

Figure 7: Optic disc drusen
The use of FAF imaging highlights not only surface optic disc drusen, but can also be useful in revealing the presence of partially buried disc drusen. Disc drusen are calcified hyaline bodies, congenital and benign anomalies of the optic nerve which are often associated with a variety of ophthalmic and systemic diseases including retinitis pigmentosa, angioid streaks and Usher syndrome.
The classification of macular dystrophies using FAF imaging is well documented, with a whole range of conditions being differentiated by the patterns of autofluorescence they exhibit.
Macular and Retinal Dystrophy
The classification of macular dystrophies using FAF imaging is well documented, with a whole range of conditions being differentiated by the patterns of autofluorescence they exhibit.
Best macular dystrophy (figure 8) is a disease with an early onset, usually in children aged between three and 15 years, and results in the loss of central vision.

Figure 8: Best macular dystrophy
Best disease is characterised by the egg yolk-like (vitelliform) appearance of bilateral macular lesions which are the result of the subretinal accumulation of LF and photoreceptor cell debris. Although disease progression is normally separated into five distinct stages (previtelliform, vitelliform, pseudohypopyon, vitelliruptive, and atrophic), six different phenotypes have been characterised with FAF. These are:
- Normal
- Hyperautofluorescent
- Hypoautofluorescent
- Patchy
- Multifocal
- Spoke-like patterns.
Stargardt disease is the most common inherited macular dystrophy affecting in the region of 1 in 10,000 people. The onset of the condition is usually between the ages of 10 and 30 years although symptoms typically develop before the age of 20. The condition results in a progressive loss of vision and is an atrophic macular dystrophy which manifests as yellow, ill-defined specks around a patch of central degeneration of the RPE and photoreceptor layer in the macula. Using FAF imaging these lesions appear as flecks of hyper-autofluorescence surrounding a dark hypoautofluorescent pattern of choroidal atrophy (figure 9). A peripapillary ring where hyperautofluorescent flecks are absent is highly suggestive of Stargardt disease. While abnormal levels are not high in all Stargardt patients, the amount and pattern of autofluorescence appear to relate well to the extent of loss of visual function.
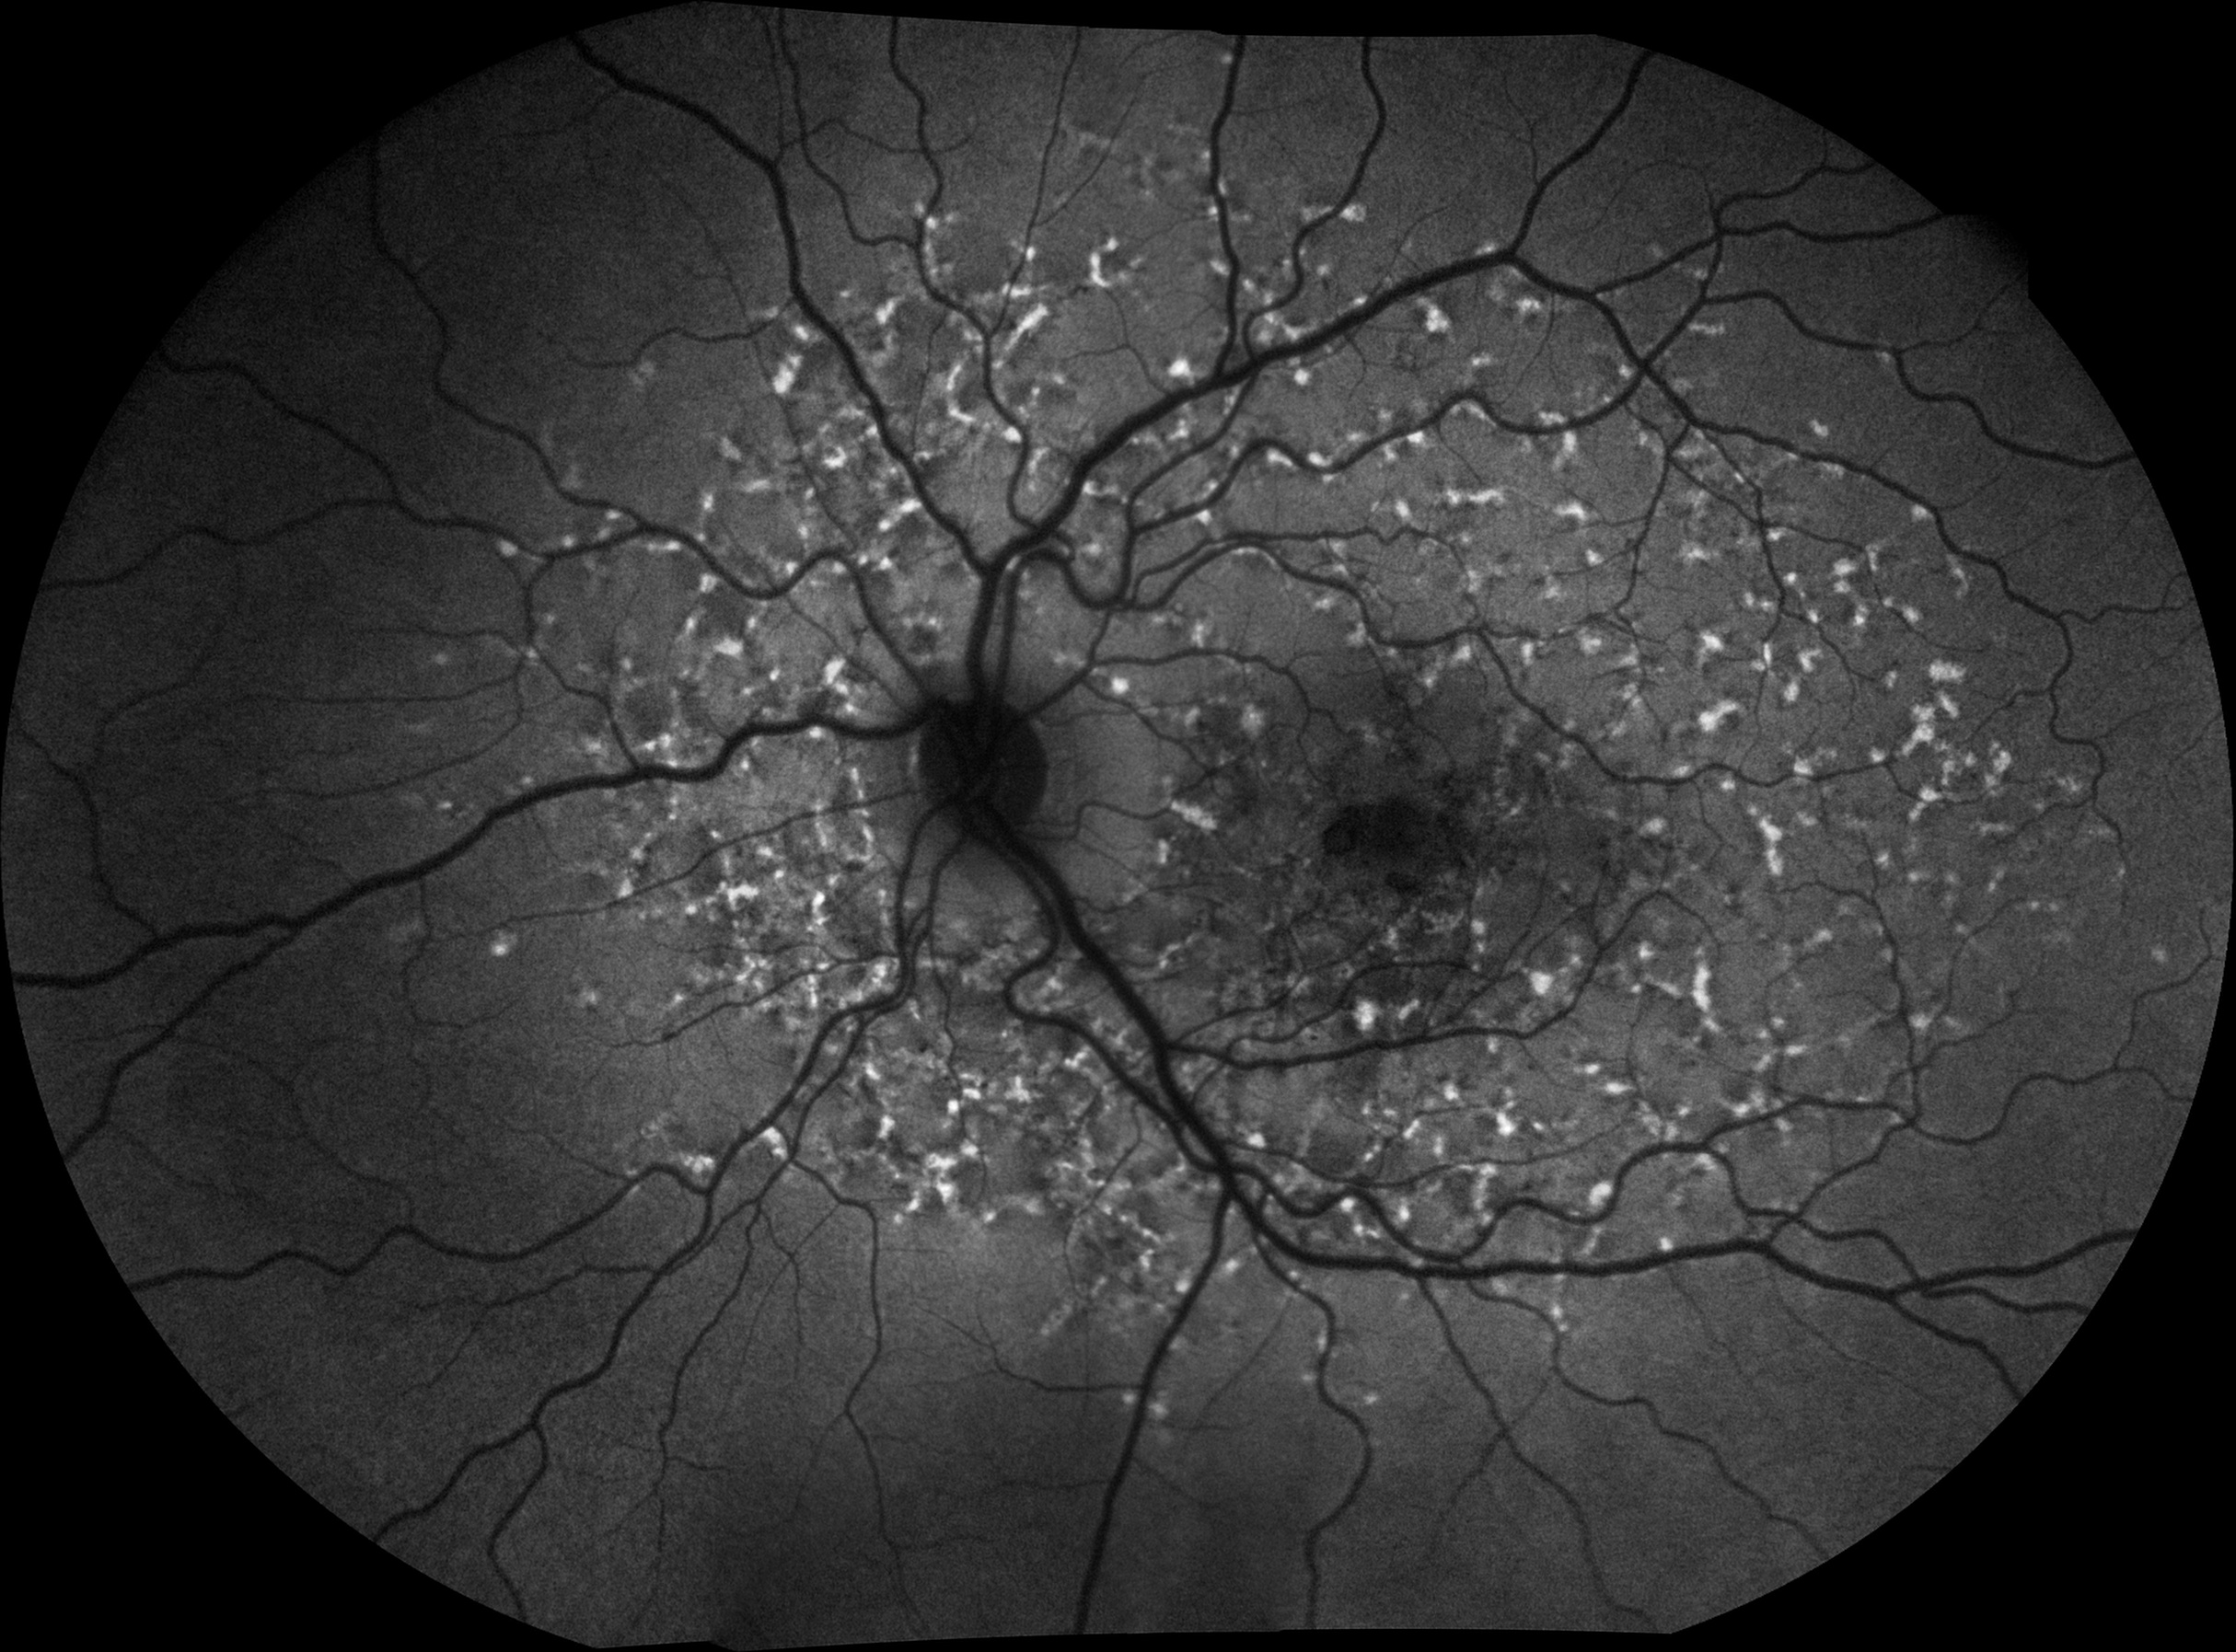
Figure 9: Stargardt disease
The term pattern dystrophy refers to a collection of benign, clinically stable bilateral macular dystrophies usually characterised by a later onset than Best or Stargardt disease. While there are a number of different pattern dystrophies including ‘butterfly’ pigment dystrophy, reticular dystrophy and fundus pulverulentus, it is adult onset vitelliform dystrophy and multifocal pattern dystrophy simulating fundus flavimaculatus which are best suited to FAF imaging.
The FAF pattern in adult vitelliform dystrophy features a small bilateral subfoveal clump which is hyperautofluorescent with subsequent RPE atrophy appearing as hypoautofluorescence. Three distinct patterns of FAF have been described, these are normal, focal followed by patchy, which have been shown to correlate with visual acuity and sensitivity of the retina.5
Multifocal pattern dystrophy simulating fundus flavimaculatus has a similar presentation to Stargardt with irregular hyperautofluorescent flecks at the posterior pole and vascular arcades as well as lesions with central hypoautofluorescence surrounded by a hyper-autofluorescent halo. Multifocal pattern dystrophy can be differentiated from Stargardt by its inheritance pattern, late onset and benign course.
While its use as a prognostic tool in cases of non-neovascular dry AMD and as a means of classification of various macular dystrophies is paramount, FAF imaging has a host of other clinical applications.
Other retinal diseases
Diabetic retinopathy (DR) remains one of the leading causes of visual impairment in the working age population and within 20 years of diagnosis nearly all people with type 1 and almost two thirds of people with type 2 diabetes have some degree of retinopathy.6
FAF imaging in DR is not widely used although a number of small clinical studies have shown its potential. The pathophysiological processes of the disease are understood to activate microglia (glial macrophages) which has been shown, in animal studies, to accumulate more LF than the RPE.7 Well circumscribed area of hypoautofluorescent in patients with diabetic maculopathy, associated with oedema and leakage from microaneurysms have been demonstrated using FAF imaging.
In retinitis pigmentosa, a group of retinal dystrophies characterised by the degeneration of the rod photoreceptors, FAF imaging is considered as a supplemental modality used to both monitor the courses of the disease and help correlate phenotype with genotype.
A hyperautofluorescent ring, known as the Robson-Holder ring, is useful in identifying the border between complete photoreceptor loss outside of the ring and the normal retina within (figure 10). The gold standard for diagnosis and monitoring of disease progression is electroretinography (ERG) which correlates well with the radius of the autofluorescent ring, and in terms of visual function, the more the ring encroaches towards the fovea the greater the constriction of the patient’s visual field.

Figure 10 Retinitis pigmentosa
Other retinal dystrophies, including bull’s eye maculopathy, cone and cone rod dystrophies and Best disease often present with similar hyperautofluorescent rings suggesting a common underlying pathogenesis.
A diverse group of inflammatory chorioretinopathies featuring small yellow-white lesions scattered about the posterior pole are referred to as white dot syndromes. These syndromes, and in particular multiple evanescent white dot syndrome (MEWDS) and punctate inner choroidopathy (PIC), are imaged well using FAF as they produce an increase in signal strength, as a result of photoreceptor loss facilitating a clear view of natural RPE autofluorescence.
MEWDS, which affects young, healthy women, manifests as small white spots in the paramacular and mid-peripheral fundus which show as points of hypoautofluourescence. Although these lesions are seen using ICG angiography and less well using FFA, the non-invasive nature of FAF images make it a useful substitute imaging modality.
PIC also tends to occur in young women but is more associated with existing myopia, and the development of choroidal neovascularisation and subsequent loss of vision. The active lesions are sub-RPE nodules and these can present as hyperautofluorescent spots which change to hypoautofluorescent spots (figure 11) often with a hyperautofluorescent ring (window defect) when they break through the RPE. Subsequent neovascularisation will have a similar appearance under FAF imaging as that of neovascularisation associated with wet AMD.
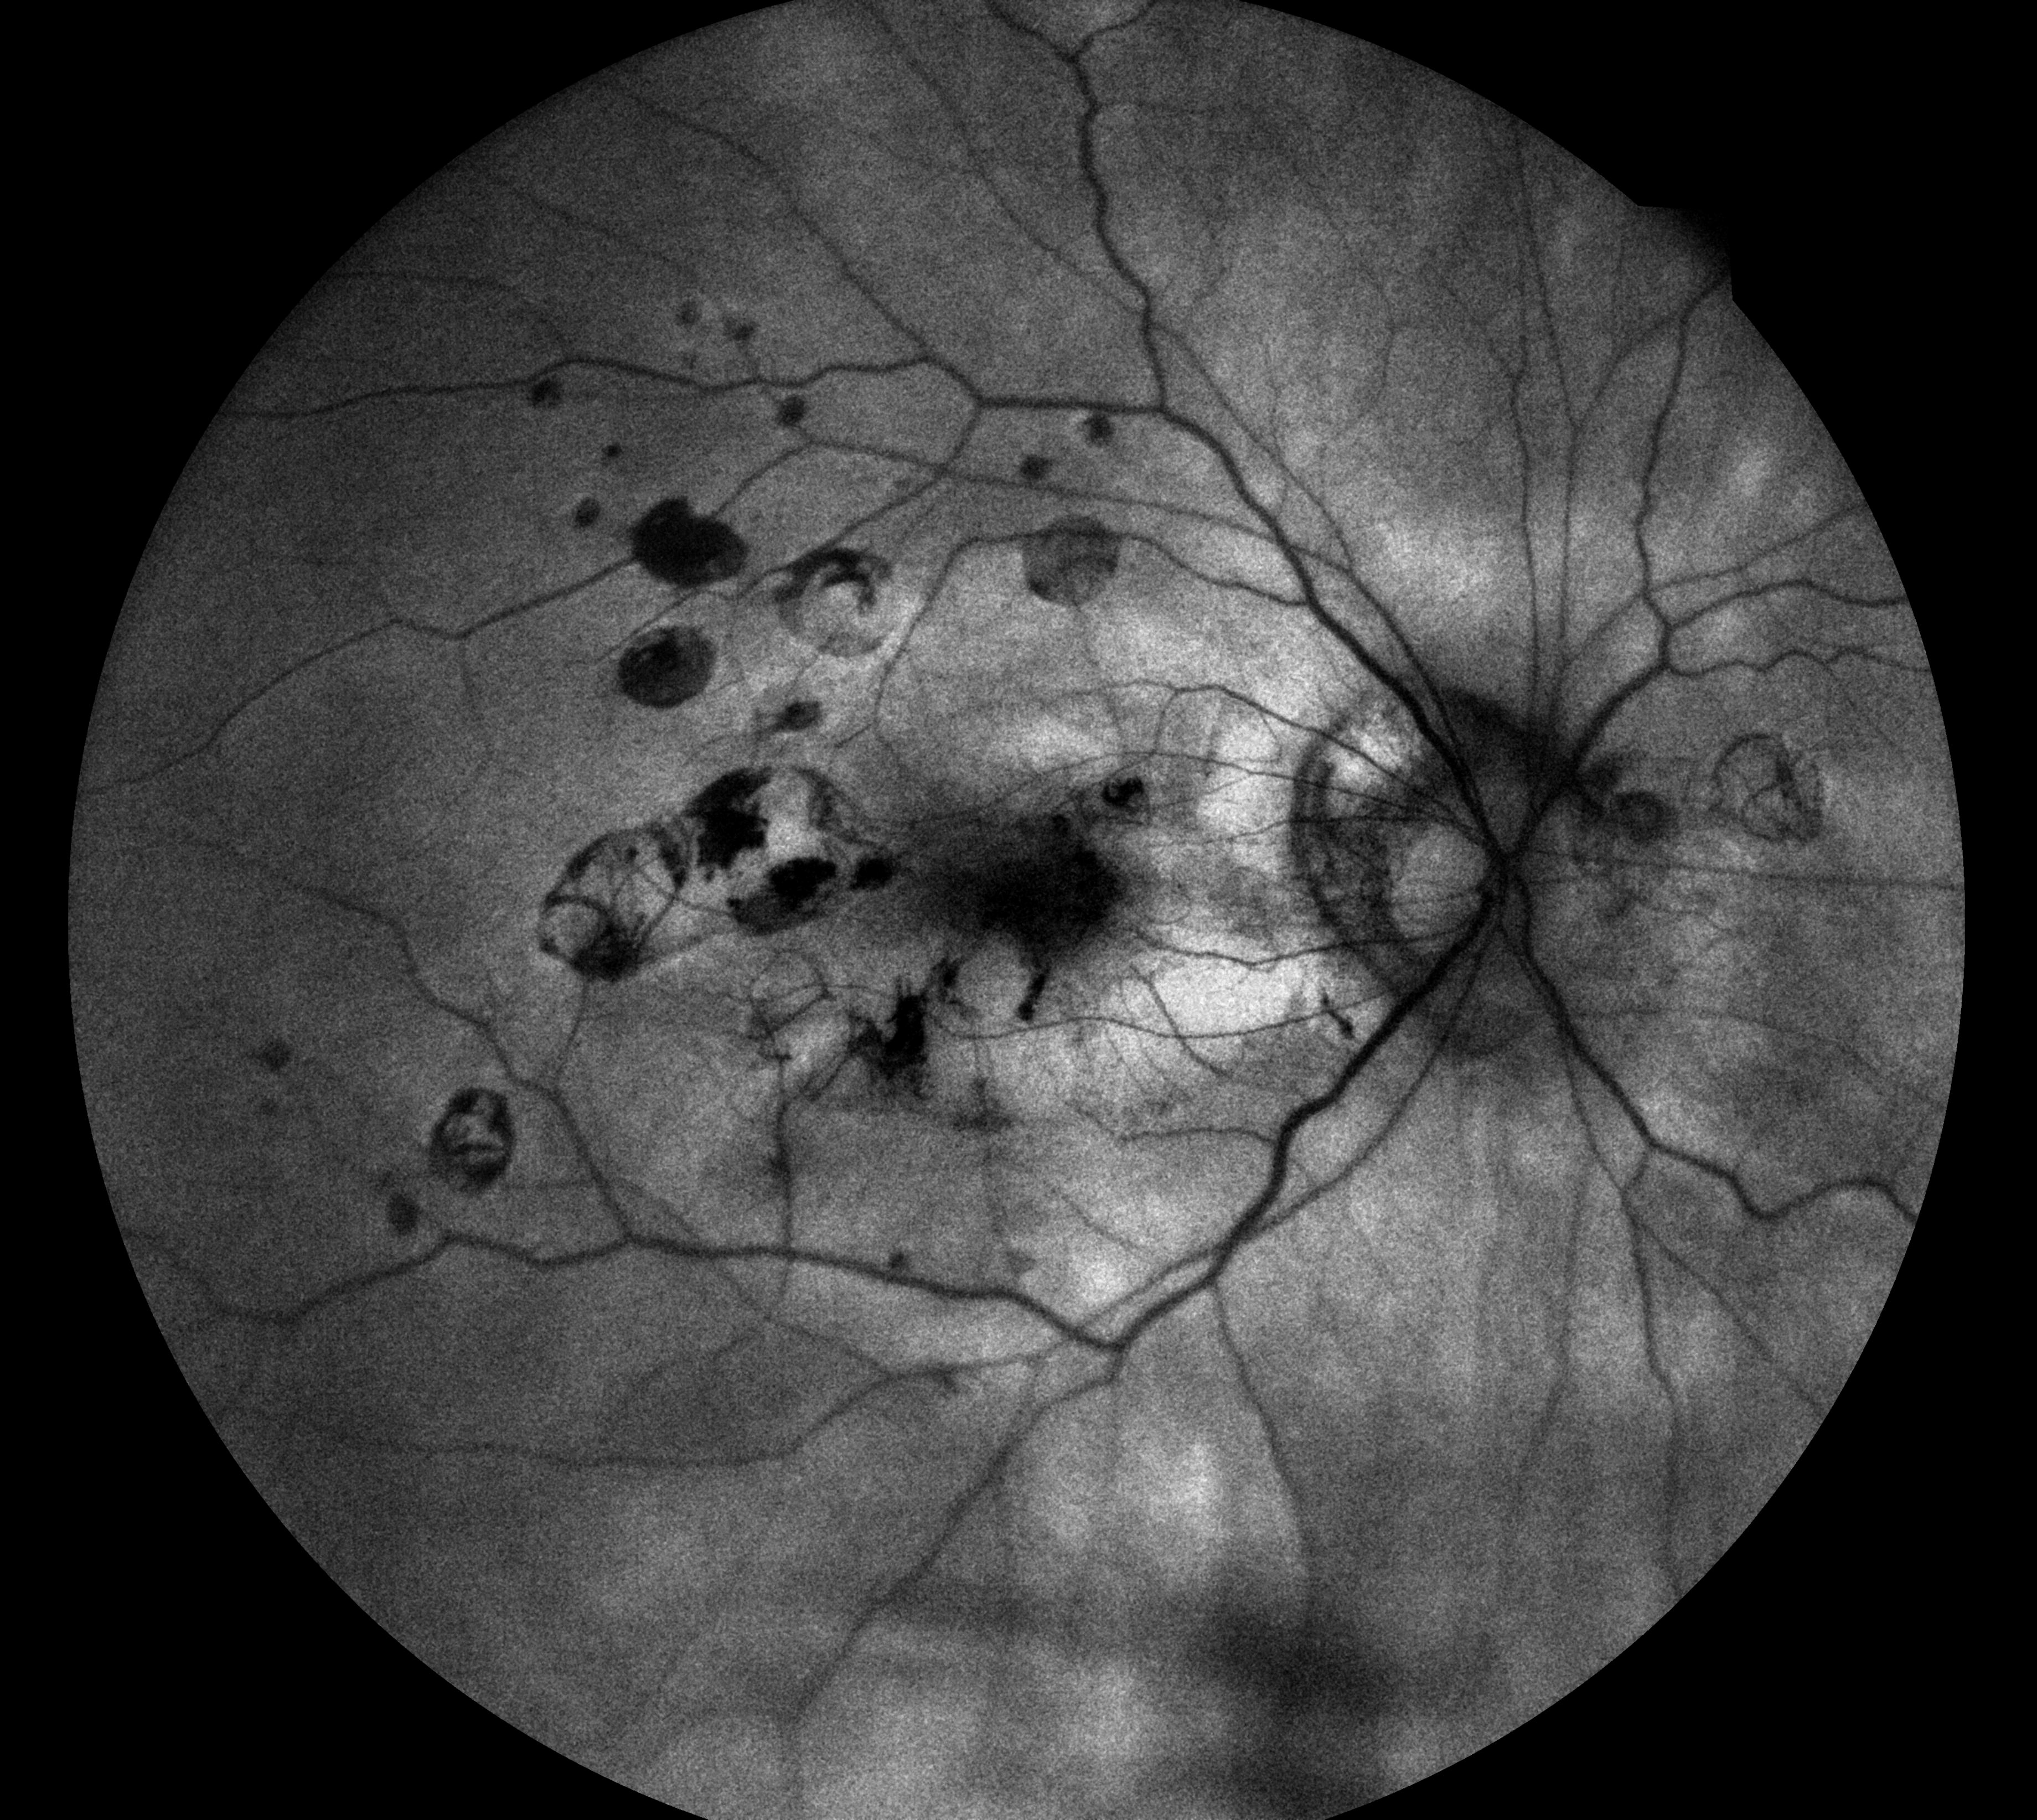
Figure 11a Punctate inner choroidopathy
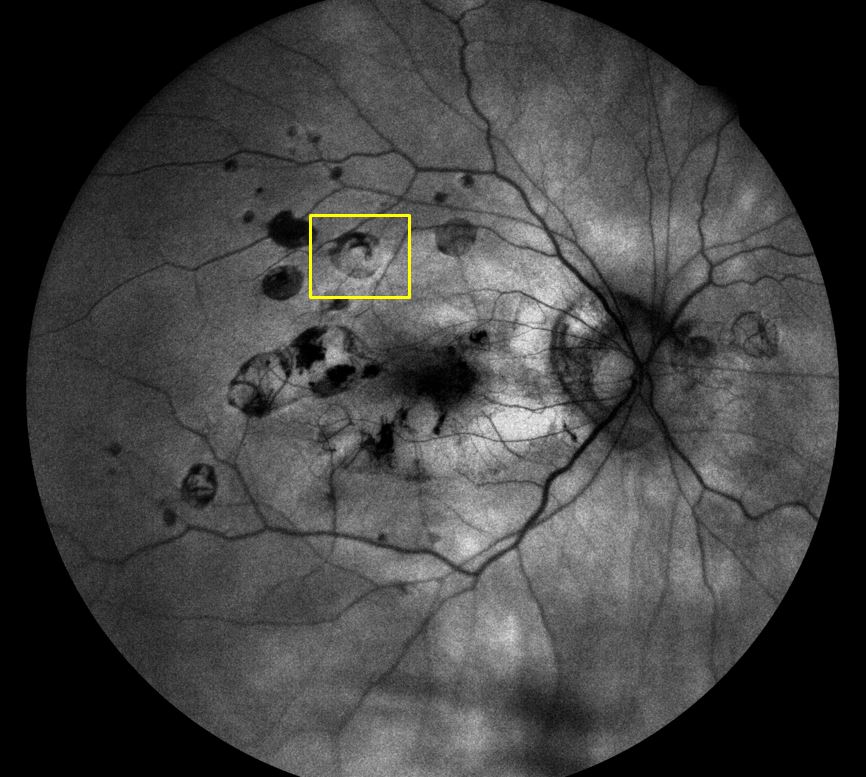
Figure 11b Punctate inner choroidopathy showing window defect
Anti-inflammatory drug toxicity also produces a striking FAF appearance as a full or partial parafoveal hyperautofluorescent ring corresponding to photoreceptor cell damage, decreasing over time as a result of RPE atrophy. Higher doses of hydroxychloroquine can result in a dramatic rise in ocular toxicity causing RPE damage and later manifestations of the condition include bilateral bull’s eye maculopathy.
Alzheimer’s disease
A link between increased levels of LF and the pathogenesis of Alzheimer’s disease (AD) has been proposed, whereby following the death of neurons as part of the aging process, LF accumulates in the extracellular setting resulting in impairment of the tissue and could be the starting point for the development of senile plaque associated with AD. This hypothesis may represent analogies between the pathogenetic processes of AMD and AD.8 Indeed, a pilot study in 2015, which attempted to determine alterations in the retina of AD patients using the technique of fluorescence lifetime imaging ophthalmoscopy (FLIO), identified changes in the retina of patients with AD in relation to Alzheimer-specific markers.9
Final Thoughts
Fundus autofluorescent imaging provides detailed information on the health of the RPE and, because accumulation of LF in the RPE is strongly associated with the daily process of phagocytosis in the eye, provides a reliable picture of photoreceptor damage in a host of different conditions.
Whether used as a means to monitor disease progress such as in retinitis pigmentosa, a tool to prognosticate on the likely course of dry AMD or as a means of classifying retinal dystrophies, a methodology that was once regarded as a novelty is now proving to be an essential tool in the imaging and diagnostic armamentarium.
The development of confocal FAF imaging techniques now means that devices using a blue light source are capable of providing high quality clinical information without incurring some of the degradation resulting from other autofluorescent structures in the eye such as the crystalline lens. And the introduction of new devices such as the Eidon AF with a single rather than averaged approach to image capture will improve patient comfort, reduce image quality problems associated with loss of fixation and reduce the cost of FAF imaging.
On the clinical front, ongoing research into the autofluorescent nature of the eye means that other conditions, such as diabetic retinopathy, will, over time be able to exploit the information recorded by this non-invasive, simple and relatively inexpensive approach to retinal imaging.
Grant Duncan is a medical photographer and experienced retinal grader and Clinical Training Manager at Haag Streit UK.
References
- Machemer R, Norton EW, Gass JD, Choromokos E. Pseudofluorescence – a problem in interpretation of fluorescein angiograms. Am J Ophthalmol. 1970 Jul;70(1):1–10. PubMed PMID: 4987088.
- Delori FC, Dorey CK, Staurenghi G, Arend O, Goger DG, Weiter JJ. In vivo fluorescence of the ocular fundus exhibits retinal pigment epithelium lipofuscin characteristics. Invest Ophthalmol Vis Sci. 1995 Mar;36(3):718–29. PubMed PMID: 7890502.
- Wan Ling Wong, Xinyi Su, Xiang Li, Chui Ming G Cheung, Ronald Klein, Ching-Yu Cheng, Tien Yin Wong Global prevalence of age-related macular degeneration and disease burden projection for 2020 and 2040: a systematic review and meta-analysis. Lancet Glob Health 2014; 2: e106–16.
- Holz FG, Bindewald-Wittich A, Fleckenstein M, Dreyhaupt J, Scholl HP, Schmitz-Valckenberg S. Progression of geographic atrophy and impact of fundus autofluorescence patterns in age-related macular degeneration. Am J Ophthalmol. 2007;143(3):463–72.
- Furino C, Boscia F, Cardascia N, Sborgia L, Sborgia C. Fundus autofluorescence, optical coherence tomography and visual acuity in adult-onset foveomacular dystrophy. Ophthalmologica. 2008;222(4):240–4.
- https://www.diabetes.org.uk/Research/Research-round-up/Research-spotlight/Research-spotlight-diabetic-retinopathy/
- Heping Xu, Mei Chen,Ayyakkannu Manivannan, Noemi Lois, John V. Forrester. Age-dependent accumulation of lipofuscin in perivascular and subretinal microglia in experimental mice. Aging Cell (2008) 7, pp58–68.
- Giorgio Giaccone, Laura Orsi, Chiara Cupidi, Fabrizio Tagliavini. Lipofuscin Hypothesis of Alzheimer’s Disease. Dement Geriatr Cogn Disord Extra 2011;1:292–296.
- Susanne Jentsch, Dietrich Schweitzer, Kai-Uwe Schmidtke, Sven Peters, Jens Dawczynski, Karl-Jurgen Bar and Martin Hammer. Retinal fluorescence lifetime imaging ophthalmoscopy measures depend on the severity of Alzheimer’s disease. Acta Ophthalmol. 2015: 93: e241–e247.