One of the current and key future challenges in healthcare is that of coping with the challenge of Alzheimer’s disease (AD) and associated dementias in an ageing population. Already a range of investigative techniques have been developed to identify Alzheimer’s disease and which include neuroimaging, genetics, blood biomarkers and cerebrospinal fluid (CSF) proteomics. In the latter technique, the distribution of proteins in the CSF is investigated as a marker for a range of clinical conditions as described by Guldbrandsen et al.1 The range of biomarkers for identification of AD is further reviewed by Thal et al.2
In terms of neuroimaging, the use of Pittsburgh compound-B (PiB), which selectively binds to Amyloid beta plaques has found application in Positron Emission Tomgraphy (PET) imaging3,4 where the technique is considered able to identify plaques prior to demonstration of any cognitive deficit. This ‘predictive’ facility is considered of significant value since this provides the potential for targeting future use of medication for slowing the onset of dementia. While not relevant in itself as a mass screening modality, it has a potential role in confirming the diagnostic value of screening techniques such as retinal imaging. Techniques, however, such as neuroimaging, genetics, blood biomarkers and cerebrospinal fluid proteomics are generally not appropriate for population screening for conditions such as Alzheimer’s disease, due to the specialist nature of such investigations and the associated cost.
Clinical Insight
There has been interest for some time in investigating the link between conditions of type 2 diabetes and dementia. Exalto et al5 report the findings of a study of diabetic patients with severe diabetic retinal disease and where there was identified an estimated increased risk of dementia of 42%. This may indicate that the association of microvascular disease in the retina with type 2 diabetes is linked with a corresponding deterioration of the microvascular structures in the brain. Whitmer et al6 report similar findings as part of a longitudinal cohort study of 16,667 patients where levels of incidence of dementia were linked with levels of presentation of type 2 diabetes. Data was abstracted as part of the study between 1980 and 2007 of hospital admission and discharge information. It was identified for one hypoglycaemic event the increased likelihood of dementia was 26%, for two episodes it was 80% and three or more episodes estimated to be 94%. Such ‘case note’ studies, however, are likely to be limited by the quality of clinical information available.
Retinal Measurement Parameters
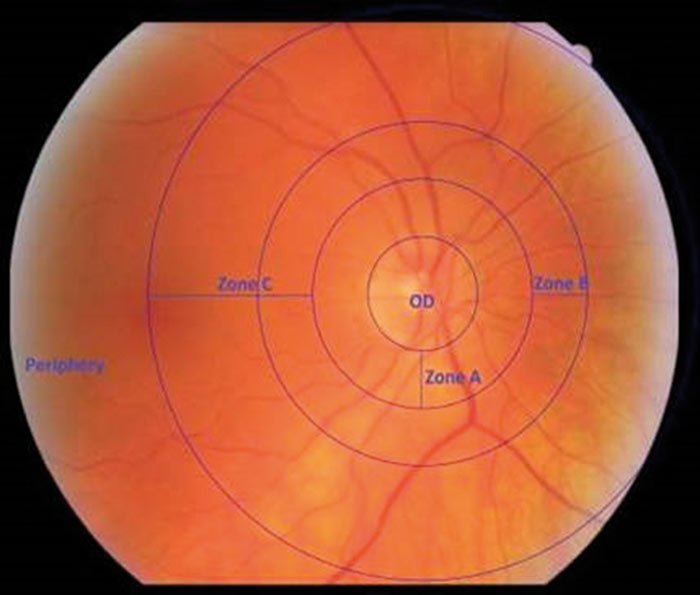
Figure 1: Defines annular zones used by VAMPIRE software. A, B and C. (VAMPIRE – University of Dundee. All rights reserved.)
A key stage of analysis of retinal images is identification of the optic disc diameter in order to identify zone A (0.0 to 0.5 optic disc diameters from disc margin), zone B (0.5 to 1 optic disc diameters from disc margin) and zone C (0.5 to 2.0 optic disc diameters from disc margin) as indicated in figure 1. Table 1 indicates a summary of typical retinal parameters.
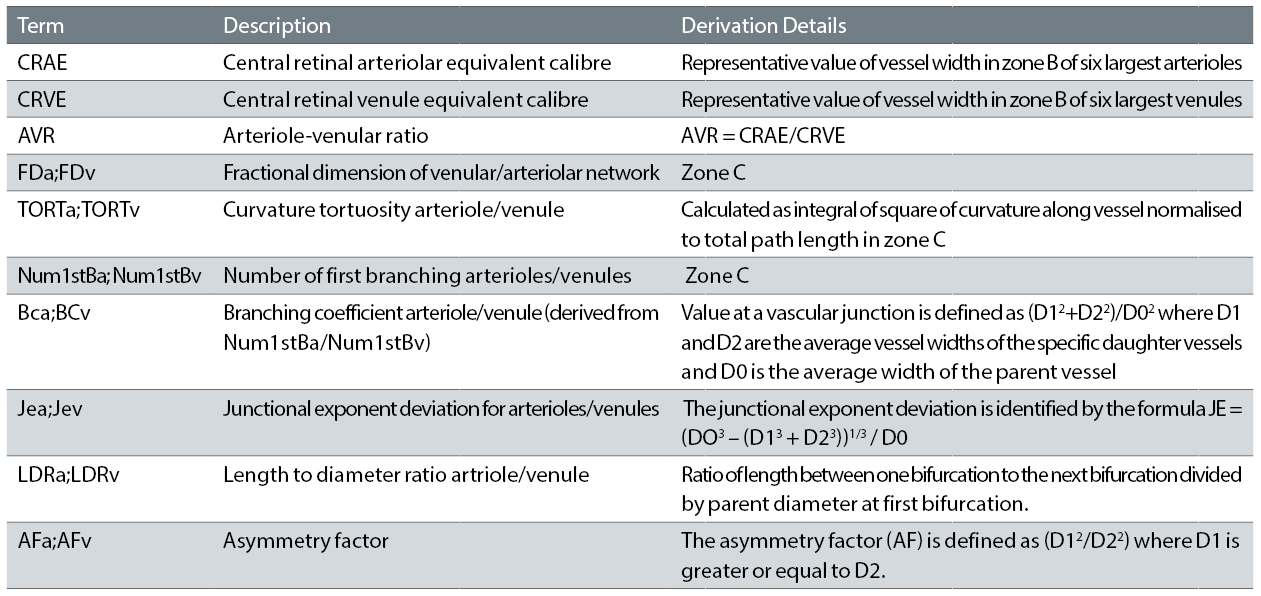
Table 1: Summary of typical retinal parameters reported – after McGrory et al7 and Frost et al 16
While a common set of retinal parameters are typically determined by various software packages, often different algorithms are utilised to determine specific measurements. In terms of vessel tortuosity, a basic measure can be identified as the ratio of the integrated length between selected points divided by the shortest distance between the two points. This is described as the arc-chord ratio factor.8 While this is a simple approach, vessels of obviously different appearance can have a common arc-chord ratio factor. A commonly used algorithm for tortuosity is described by Lisowska et al.9 Based on minimisation of the shear stress of flow across a bifurcation, ideal values for branching coefficient arteriole/venule and junctional exponent arteriole/venule are 1.26 and 0 respectively. The fractal dimension10,11 is identified as a measure of how well the branching complexity of the retinal vascular tree fills two-dimensional spaces and where more complex patterns are reflected in higher values of this parameter.
The Evidence from Vascular Imaging of the Retina
There is increasing interest in techniques to identify the risk of dementia by analysis of the vascular patterns of retinal images. This is encouraged in part by the relative ease with which high quality retinal imaging can now be taken using a range of imaging modalities which include fundus photography and scanning laser ophthalmoscope (SLO). Advances in such imaging technologies, however, present challenges in analysis of the available clinical literature, where in general the diagnostic value of retinal imaging increases with the use of more recent higher quality images.
McGory et al12 describe a systematic review of the relevance of fundus camera imaging as a predictor of dementia. In their study, a core set of 59 relevant studies were analysed in depth. Such studies typically determine a range of retinal parameters which are derived from the vasculature pattern in the retina. Differences in measurement and analytical techniques used between specific studies, however, contribute to challenges in collating results of such studies. Numerous studies included in their systematic review utilise the SIVA (Singapore ‘I’ Vessel Assessment) software product which has been jointly developed by the Singapore Eye Research Institute and the National University of Singapore. The software can automatically calculate a range of retinal vascular parameters including retinal vascular calibre, fractal dimension, tortuosity and branching angle. While the SIVA software has been used by various researchers for assessment of links between retinal vascular parameters and dementia, main areas of research within the Singapore facility relate to investigating links between retinal vascular parameters and cardiovascular disease.13,14 Based on the review of the set of core studies, McGory et al,12 however, indicate that while the potential of the technique is apparent, there is a need to further develop both the measurement methods and available software systems.
In a separate study, McGrory et al7 have investigated a uniform study group based on 683 participants of the Lothian Birth Cohort 1936 at approximately age 73 years. The reduced age variation within the cohort and also the availability of childhood IQ values allowed potentially a more accurate determination of aspects of loss of cognitive function over time. Analysis of data indicated that decreased arteriolar junctional exponent and increased arteriolar branching coefficient values were significantly associated with less cognitive decline, though this result was lost when data was corrected for false discovery rate.15 This indicates at best a weak association between retinal vascular parameters and cognitive decline.
Frost et al16 describe a study which involved one component of healthy controls (n=125) compared with a set of patients with Alzheimer’s disease (n=45). Another component of the study involved patients with elevated levels of amyloid plaques (n=15) and another with normal levels (n=30) as determined by neuroimaging. Significant differences were identified between the Alzheimer’s disease group and the normal control group for 13 out of 19 retinal vascular parameters. Analysis of the second component of the study identified significant differences between the elevated and non-elevated amyloid plaque group for parameters of venular branching asymmetry factor and arteriolar length-to-diameter ratio (LDRa). This indicates the potential of retinal imaging to identify patients at greater risk of developing Alzheimer’s disease.
The VAMPIRE (Vessel Assessment and Measurement Platform for Images of the REtina)17 (https://vampire.computing.dundee.ac.uk) system is a specific software package developed as part of an international collaborative project involving academic centres in the University of Edinburgh, University of Dundee, Universita degli Studi Di Palermo and Universita degli Studi di Verona. VAMPIRE was the first software package to be used for analysis of images within the UK Biobank (http://www.ukbiobank.ac.uk/) which contains a large repository of retinal images.18 Figure 2 shows the quadrants identified by VAMPIRE in addition to concentric annular zones around the optic disc.

Figure 2: Indication of quadrants identified by VAMPIRE software (VAMPIRE – University of Dundee, all rights reserved)
Figure 3 indicates the user interface of VAMPIRE version 3.1.
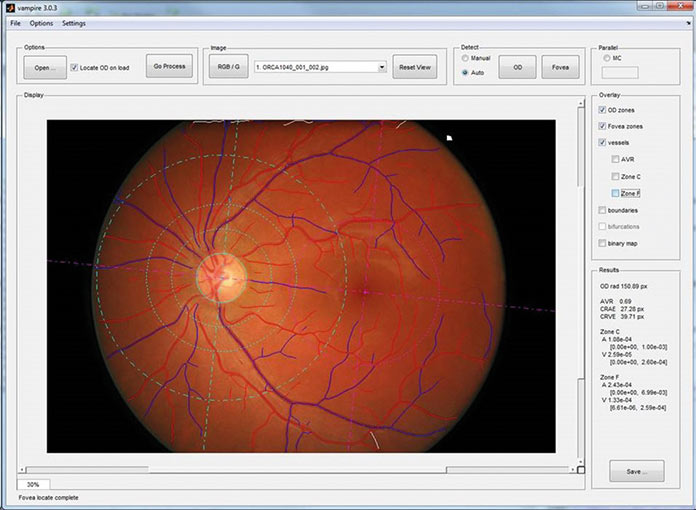
Figure 3: VAMPIRE 3.1 user interface (VAMPIRE – University of Dundee, all rights reserved)
Cameron et al19 describe how the established software facility of VAMPIRE for analysis of fundus camera images has been expanded to process the optical coherence tomography and scanning laser ophthalmoscope modalities of the Heidelberg Spectralis. The key data utilised in this analysis is that of the scanning laser ophthalmoscope image and where as part of the study, key parameters successfully determined on a set of 78 images were AVR, CRAE, CRVE, arteriolar tortuosity, and venular tortuosity. The classification of vessels as artery or vein is performed automatically, then corrected by an operator efficiently using the specialised VAMPIRE interface. The further development of this scanning laser ophthalmoscope modality, however, is likely to be highly significant for the future development of diagnostic algorithms involving retinal images.
Some limited studies have been published which compare the performance of specific retinal analysis software packages. Downie et al20 describe, for example, a comparison of the IVAN (Interactive Vessel ANalyzer) package with the VAMPIRE system (both systems being freely available) where a total of 41 eyes from 21 patients were analysed. In this study comparison was made of calculations of central retinal vein equivalents (CRVE), central retinal artery equivalents (CRAE) and arteriolar:venular ratio (AVR). Correlation coefficients between the retinal parameter values computed using IVAN and VAMPIRE were judged to confirm the suitability of both packages.
Vickerman et al21 describe various aspects of the functionality of VESGEN (VESsel GENeration) which is a system for analysis of vascular patterning in 3D and 2D in tissue structures. VESGEN, a system developed by NASA, has been identified with specific analysis of diseases and treatments such as diabetic retinopathy, cardiovascular disease, and animal models of progressive retinopathies, gastrointestinal inflammation with probiotic protection, angiogenesis in cancer, healing, and normal development. It can be surmised that NASA has developed such software to investigate the response of the human circulatory system to prolonged period of weightlessness in space. VESGEN can, in particular, readily identify the arterial and vascular vessels within the retina in the form of vascular and arterial trees but has found application essentially in diverse areas within life sciences. While there appears to be no studies using VESGEN to correlate changes in retinal characterises with dementia, the package may prove of value in tracking early changes of retinal vasculature associated with the onset of accelerated cognitive loss. Parsons-Wingerter et al22 describe the utilisation of VESGEN in the study of progression of diabetic retinopathy, where episodes of angiogenesis/neovascularisation and vascular dropout were observed, largely due to remodelling of arteries and followed by remodelling of veins.
Nerve Fibre Layer Thickness
Kesler et al23 report the investigation of measurement of thickness of the retinal fibre layer using optical coherence tomography (figure 4) in a group of age-matched controls (n=24), a group with mild cognitive impairment (n=24) and one with Alzheimer’s disease (n=30). There was a significant difference between the mild cognitive impairment group and the Alzheimer group compared with the control group with measurements taken from the inferior quadrants of the optic nerve head. The differences in relative thinning of the nerve fibre layer between the mild cognitive impairment group and the Alzheimer’s group, however, were not significant. In addition, the degree of thinning in the nerve fibre layer in the Alzheimer’s group did not appear to correlate with the relative degree of cognitive impairment within the group.

Figure 4: A retinal nerve fibre layer thickness map using Heidelberg Spectralis
Moreno-Ramos et al24 describe the findings of a study (10 patients in each group) involving patients with Alzheimer’s disease, dementia with Lewy bodies, dementia associated with Parkinson’s disease and cognitively normal age-matched controls. There was identification of a significant decrease in retinal nerve fibre layer thickness for the groups with the specific types of dementia compared with the control group. In addition,
correlation was identified between the degree of retinal nerve fibre layer thickness thinning and determination of cognitive deterioration as determined by the Mini-Mental State Examination and the Mattis Dementia Rating Scale. This latter finding, however, was not confirmed by the study undertaken by Kesler et al.23
Thomson et al25 describe a systematic review and meta-analysis of the relationship between the retinal fibre layer thickness and groups with various degrees of cognitive impairment. In separate studies comparing Alzheimer’s disease with healthy controls and mild cognitive impairment compared with healthy controls, significant differences were again identified and which confirm the measurement of nerve fibre layer thickness as having diagnostic potential. The authors, however, reference weaknesses of such clinical studies, namely the inclusion of false positive diagnoses of both mild cognitive impairment and Alzheimer’s disease and undiagnosed levels of cognitive impairment within ‘healthy controls’. In addition, the authors indicate that further clinical investigation is required to determine age-weighted values of nerve fibre layer thickness which distinguish between Alzheimer’s disease, mild cognitive impairment and controls. It is likely, however, the values of nerve fibre layer thickness will not be used as a single measure of possible cognitive impairment, but as one of a range of calculated retinal parameters. In addition, the increasing resolution of OCT images as the imaging technology matures is likely to improve the reliability of determinations of nerve fibre layer thickness.
Summary
The development of techniques for the use of retinal imaging to predict or identify the presence of specific types of reduction of cognitive function is revealed as a major challenge in terms of the quality of images, the objective identification of the cognitive status of the patient and the methods of statistical analysis. The level of computational complexity involved in the array of automatically generated parameters by analysis packages such as VAMPIRE, IVAN and SIVA etc, is only likely to be appreciated by the experts in image processing and statistical analysis. The specific definitions of the retinal vascular parameters, however, with the possible exception of fractal dimension, can be relatively easily appreciated.
It is likely that as techniques become more established, longitudinal studies will be undertaken where patients are monitored over extensive time periods. This would be relevant, for example, in studies of emergent medication to slow or even arrest loss of cognitive function.
One of the potential sources of error in vascular imaging of the retina is referenced by McGrory et al7 in the context of variations in vessel size/characteristics within the cardiac cycle, though no studies objectively measure the potential level of variation this may introduce. In such investigations it would be appropriate to synchronise image capture with specific phases of the cardiac cycle.
It is also relevant to indicate that novel approaches are also being investigated26 relating to direct non-invasive detection of discrete retinal amyloid deposits where these have been shown to be correlate with the development of Alzheimer’s disease.
Dr Douglas Clarkson is development and quality manager at the department of clinical physics and bio-engineering, Coventry and Warwickshire University Hospital Trust.
References
- Guldbrandsen A, Vethe H, Farag Y, Oveland E, Garberg H, Berle M et al. In-depth Characterization of the Cerebrospinal Fluid (CSF) Proteome Displayed Through the CSF Proteome Resource (CSF-PR) . Molecular & Cellular Proteomics : MCP. 2014;13(11):3152-3163. doi:10.1074/mcp.M114.038554.
- Thal LJ, Kantarci K, Reiman EM, Klunk WE, Weiner MW, Zetterberg H et al. The role of biomarkers in clinical trials for Alzheimer disease. Alzheimer Dis Assoc Disord 2006; 20:6-15.
- Rowe CC, Ellis KA, Rimajova M, Bourgeat P, Pike KE, Jones G et al. Amyloid imaging from the Australian Imaging, Biomarkers and Lifestyle (AIBL) study of aging. Neurobiol Aging 2010; 31: 1275-1283.
- Morris JC, Roe CM, Grant EA, Head D, Storandt M, Goate AM et al. Pittsburgh compound B imaging and prediction of progression from cognitive normality to symptomatic Alzheimer disease. Arch Neurol 2009; 66: 1469-1475.
- Exalto LG, Biessels GJ, Karter AJ, Huang ES. Quesenberry CP, Whitmer RA. Severe Diabetic Retinal Disease and Dementia Risk in Type 2 Diabetes. Journal of Alzheimer’s disease : JAD. 2014;42(0 3):S109-S117. doi:10.3233/JAD-132570.
- Whitmer RA, Karter AJ, Yaffe K, Quesenberry CP Jr, Selby JV. Hypoglycemic episodes and risk of dementia in older patients with type 2 diabetes mellitus. JAMA. 2009;301(15):1565-72. doi: 10.1001/jama.2009.460
- McGrory S, Taylor AM, Kirin M, Corley J, Pattie A, Cox SR et al. , Retinal microvascular network geometry and cognitive abilities in community-dwelling older people: The Lothian Birth Cohort 1936 study. The British Journal of Ophthalmology. 2017;101(7):993-998. doi:10.1136/bjophthalmol-2016-309017. Issue 1, pp 49–57
- Lotmar W, Freiburghaus A, Bracher, D, Albrecht Von Graefes Arch Klin Exp Ophthalmol. Measurement of vessel tortuosity on fundus photographs, Arch. Klin. Ophthalmol. 1979; 211(1): 49-57. https://doi.org/10.1007/BF00414653
- Lisowska A, Annunziata R, Loh GK, Karl D & Trucco E. 2014, An experimental assessment of five indices of retinal vessel tortuosity with the RET-TORT public dataset. in 2014 36th Annual International Conference of the IEEE Engineering in Medicine and Biology Society, EMBC 2014. IEEE, pp. 5414-5417, 36th Annual International Conference of the IEEE Engineering in Medicine and Biology Society: ‘Discovering, Innovating, and Engineering Future Biomedicine’, Chicago, United States, 26-30 August. DOI: 10.1109/EMBC.2014.6944850
- Mainster MA. The fractal properties of retinal vessels: embryological and clinical implications. Eye 1990; 4(1): 235–241.
- Ţălu Ş, Stach S, Călugăru DM, Lupaşcu CA, Nicoară SD. Analysis of normal human retinal vascular network architecture using multifractal geometry. International Journal of Ophthalmology. 2017;10(3):434-438. doi:10.18240/ijo.2017.03.17.
- McGrory S, Cameron JR, Pellegrini E, Warren C, Doubal FN, Deary IJ, Dhillon B, Wardlaw JM(5), Trucco E, MacGillivray TJ. The application of retinal fundus camera imaging in dementia: A systematic review. Alzheimer’s & Dementia: Diagnosis, Assessment & Disease Monitoring. 2016; 6:91-107. doi: 10.1016/j.dadm.2016.11.001.
- Liew G, Mitchell P, Rochtchina E, Wong TY, Hsu W, Lee ML, Wainwright A, Wang JJ. Fractal analysis of retinal microvasculature and coronary heart disease mortality. Eur Heart J 2011;32:422-9.
- Cheung CY, Zheng Y, Hsu W, Lee ML, Lau QP, Mitchell P et al. Retinal vascular tortuosity, blood pressure, and cardiovascular risk factors. Ophthalmology 2011;118:812-8.
- Benjamini Y, Yekutieli D. The control of the false discovery rate in multiple testing under dependency. Ann Stat 2001;29:1165–88.
- Frost S, Kanagasingam Y, Sohrabi H, Vignarajan J, Bourgeat P, Salvado O et al., Retinal vascular biomarkers for early detection and monitoring of Alzheimer’s disease. Translational Psychiatry. 2013;3(2):e233-. doi:10.1038/tp.2012.150.
- Perez-Rovira A, MacGillivray T, Trucco E, Chin KS, Zutis K, Lupascu C et al. (2011). VAMPIRE: Vessel Assessment and Measurement Platform for Images of the REtina. In 2011 ANNUAL INTERNATIONAL CONFERENCE OF THE IEEE ENGINEERING IN MEDICINE AND BIOLOGY SOCIETY (EMBC) (pp. 3391-3394). NEW YORK: IEEE. DOI: 10.1109/IEMBS.2011.6090918
- MacGillivray TJ, Cameron JR, Zhang Q, El-Medany A, Mulholland C, Sheng Z et al., Suitability of UK Biobank retinal images for automatic analysis of morphometric properties of the vasculature, PLoS One 10(5), e0127914 (2015).
- Cameron JR, Ballerini L, Langan C, Warren C, Denholm N, Smart K et al. Modulation of retinal image vasculature analysis to extend utility and provide secondary value from optical coherence tomography imaging,"Journal of Medical Imaging 3(2), 020501 (2 May 2016). http://dx.doi.org/10.1117/1.JMI.3.2.020501
- Downie E, Tokarev J, Afshin Divani A, Koozekanani DD, Comparison of two free retinal vascular measurement software packages: IVAN and VAMPIRE, Invest. Ophthalmol. Vis. Sci. 2015; 56 (7) : 3320.
- Vickerman MB, Keith PA, McKay TL, Gedeon DJ, Watanabe M, Montano M et al. VESGEN 2D: automated, user-interactive software for quantification and mapping of angiogenic and lymphangiogenic trees and networks. Anat Rec (Hoboken). 2009; 292(3):320-32. doi: 10.1002/ar.20862. 2010 Jan; 51(1): 498–507
- Parsons-Wingerter P, Radhakrishnan K, Vickerman MB, Kaiser PK. Oscillation of angiogenesis with vascular dropout in diabetic retinopathy by VESsel GENeration analysis (VESGEN). Invest Ophthalmol Vis Sci. 2010; 51(1):498-507. doi: 10.1167/iovs.09-3968.
- Kesler A, Vakhapova V, Korczyn AD, Naftaliev E, Neudorfer M.Retinal thickness in patients with mild cognitive impairment and Alzheimer's disease. Clin Neurol Neurosurg. 2011;113(7):523-6. doi:10.1016/j.clineuro.2011.02.014.
- Moreno-Ramos T, Benito-León J, Villarejo A, Bermejo-Pareja F. Retinal nerve fiber layer thinning in dementia associated with Parkinson's disease, dementia with Lewy bodies, and Alzheimer's disease. J Alzheimers Dis. 2013;34(3):659-64. doi: 10.3233/JAD-12197
- Thomson KL, Yeo JM, Waddell B, Cameron JR, Pal S. A systematic review and meta-analysis of retinal nerve fiber layer change in dementia, using optical coherence tomography. Alzheimer’s & Dementia : Diagnosis, Assessment & Disease Monitoring. 2015;1(2):136-143. doi:10.1016/j.dadm.2015.03.001.
- Koronyo Y, Biggs D, Barron E, Boyer DS, Pearlman JA, Au WJ et sl., Retinal amyloid pathology and proof-of-concept imaging trial in Alzheimer's disease.JCI Insight. 2017; 2(16). pii: 93621. doi: 10.1172/jci.insight.93621.