Optical coherence tomography angiography (OCTA) is a relatively new, non-invasive imaging technique that detects the motion of erythrocytes in order to visualise blood flow and capture images of vessels in the retina and choroid.
Background
Historically, vascular abnormalities associated with a range of ocular diseases have been imaged using an invasive dye-based approach such as fluorescein angiography (FA), primarily used to image the retinal vasculature and indocyanine green angiography (ICGA), typically employed to image the choroidal circulation. However, both FA and ICGA require an intravenous injection of a contrast agent (dye) and both procedures can have potentially serious side-effects. The emergence of OCTA may provide a safer more repeatable and less time-consuming alternative to dye-based techniques in the diagnosis and management of a several important eye conditions.
The rapid growth in the deployment of OCTA since the launch of the first commercially available system in 2014 has matched the expansion of the now ubiquitous standard optical coherence tomography (OCT) technology. The growth of that particular methodology over the past 25 years has reached a point where OCT is now the mainstay of both ophthalmic and optometric practice.
As more and more clinical applications of OCTA imaging technology are demonstrated and improvements in acquisition speed, resolution, field of view and artefact removal are applied to the growing number of commercially available systems, it can only be a matter of time before OCTA also becomes an indispensable part of the armamentarium of the eye care professional.
A Brief History
Developed by James Fujimoto and his team at the Massachusetts Institute of Technology (MIT) in the early 1990s,1 with its roots in the telecommunications industry, OCT technology has seen
considerable advances over the ensuing quarter of a century. From the commercialisation of that first, time domain (TD) OCT by Humphrey Systems (now Carl Zeiss Meditec) in 1996 as the OCT1,2 through improvements in acquisition speed brought about by the development of Fourier/spectral domain (FD/SD) systems in 20023 right up to more recent improvements in both speed and resolution made possible by the application of swept-source (SS) technology. However, although functional extensions to OCT in order to accommodate imaging of the vasculature have been explored in the past, such as Doppler OCT, a process that images blood flow by evaluating phase differences between adjacent A-scans, limitations in this techniques ability to image slow flow in small blood vessels and perpendicular blood flow have led to a search for alternative methodologies for in vivo imaging the retinal and choroidal vasculature.
Early descriptions of OCTA were made by Barton et al using adapted laser speckle analysis for TD OCT, Makita et al 4 who, in 2006 outlined an OCTA approach using SD-OCT and by An et al 5 using optical microangiography (OMAG). However, it was the technique first described by Jia et al in 2012,6 a team which included Fujimoto, Huang and other members of the original MIT OCT team, that was the first to be applied to a commercially available system. Their split-spectrum amplitude decorrelation algorithm (SSADA) was adopted by OptoVue and applied to the AngioVue OCTA System launched in 2014.
Since then, the majority of ophthalmic equipment manufacturers have gone on to develop their own OCTA systems based on a variety of different algorithms and techniques, these are detailed in table 1.
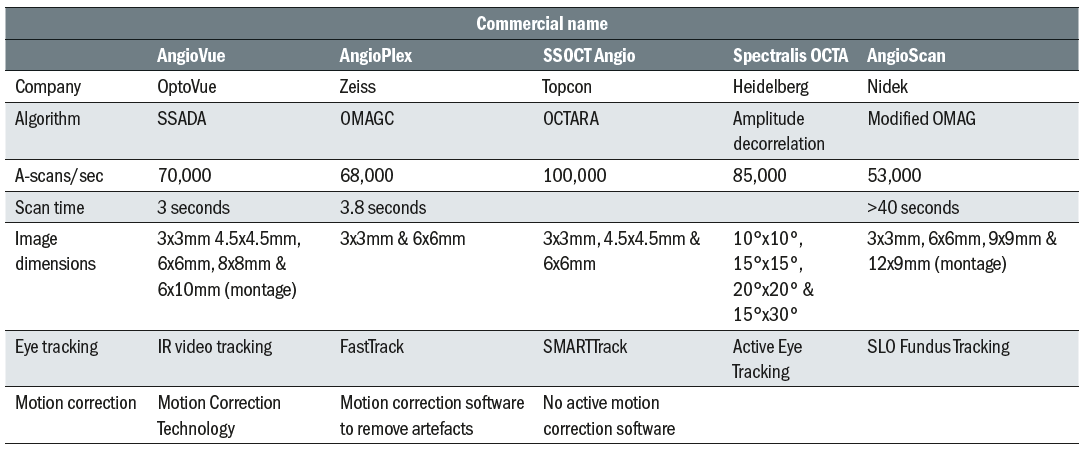
Table 1: Details of main commercially available OCTA systems. Data sourced from company web pages and product brochures
Technological Principles
OCTA relies on the detection of motion as blood flows through the retinal and choroidal vessels, generating changes in the OCT reflectance signal. In order to do this OCTA requires repeated scans at the same location within the tissue and the fast scanning speeds offered by both SD/FD and SS OCT systems facilitate this. OCTA images are then generated by complex software which compares the data from repeated B-scans on a pixel by pixel basis.
OCTA applies motion contrast imaging to high-resolution volumetric blood flow information in order to generate angiographic images quickly and without the need for an invasive dye injection. The technique compares the signal from sequential B-scans, representing red blood cell movement, taken at the same cross section point. Because flowing red blood cells (erythrocytes) demonstrate greater variation in the OCT signal between repeated scans when compared to static tissue the technique allows the construction of a detailed map of blood flow (figure 1).
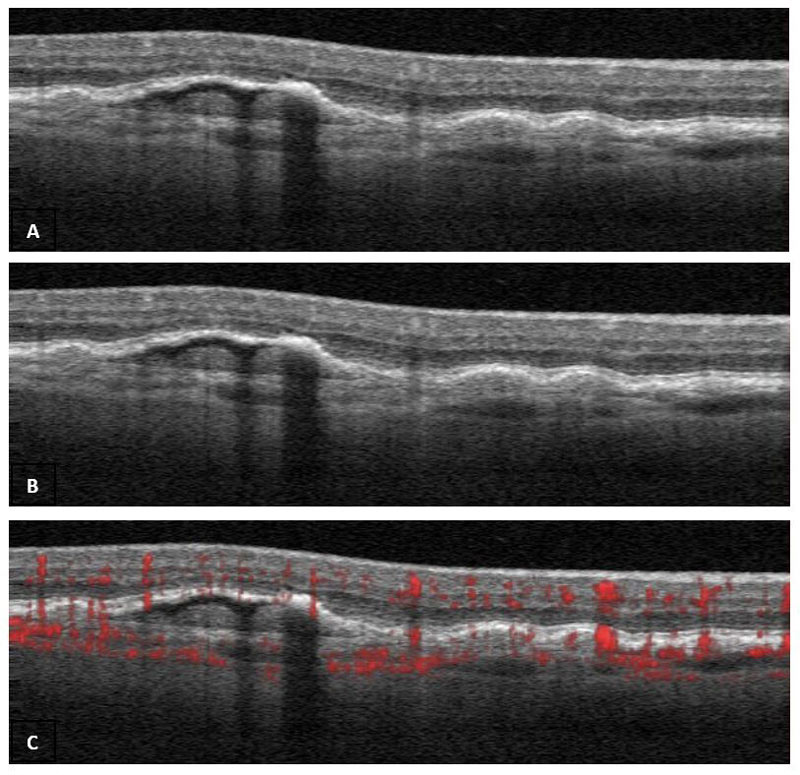
Figure 1: Scan B subtracted from Scan A to produce Scan C with detail of blood flow in red
In simple terms, OCTA generally utilises one of two basic methodologies: amplitude decorrelation or phase variance and, on occasion, a combination of both.
Amplitude decorrelation, analyses amplitude changes in the OCT signal, an example of this is the aforementioned SSADA algorithm (Optovue AngioVue), which splits the OCT spectrum into narrower bands (spectra), performing the repeated B-scan correlation separately, thereby reducing the predominant axial bulk-motion noise. The average intensity decorrelation detected in each band is used to significantly reduce the signal to noise ratio, albeit at the expense of axial resolution. However, because the flow signal in the ocular fundus is predominantly in the transverse rather than axial dimension, when constructing en face angiograms this reduction in axial resolution is of less importance. As a result, the SSADA algorithm is optimal for imaging transverse retinal and choroidal blood flow.
Topcon developed the OCTA Ratio Analysis (OCTARA) algorithm which is based on swept-source OCT and an intensity ratio calculation rather than amplitude decorrelation. Because OCTARA does not require spectrum splitting it preserves axial resolution. Again, the approach uses multiple OCT B-scans acquired at the same position extracting signal changes derived from blood flow and is particularly efficient in detecting low blood flow in the microvasculature. An advantage of SS-OCTA imaging is the very fast scanning speed, which allows a larger scan area compared with other OCTA scans for the same acquisition time. Use of a longer wavelength also results in greater light penetration beyond the RPE and therefore enhanced imaging of the choroid.
Early OMAG OCTA (3D optical micro-angiography) utilised phase variance in sequential OCT A-scan signals. In order to compensate the bulk tissue motion the technique applied a constant modulation frequency to the interferograms formed between the reference and sample beams thus separating the moving elements of the OCT signals from the static ones. The Zeiss AngioPlex OCTA system deploys a more recent version of the OMAG algorithm (OMAGC – Optical Micro Angiography Complex) which uses both amplitude and phase in the OCT signals to show the blood flow within the tissue.
The depth-resolved nature of OCTA facilitates the construction of a 3D dataset which, using powerful post processing methods, can then be automatically or manually segmented to provide a detailed 2D en face representation of the vasculature at different depths, from the outer retina to the choriocapillaris (figure 2).
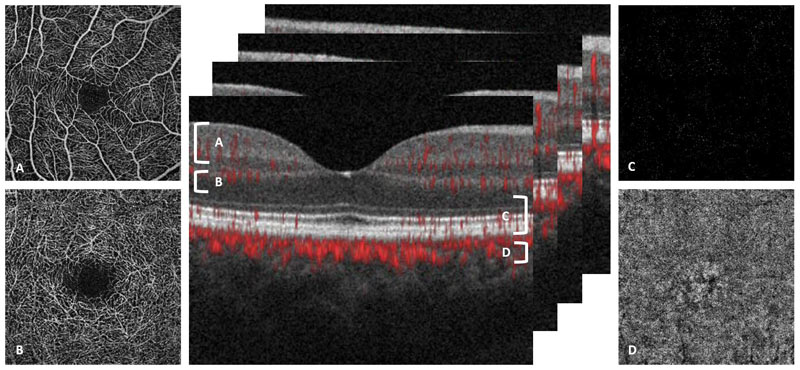
Figure 2: 2D en face representations of the vasculature at different depths associated with four segmentation slabs. A superficial capillaries, B deep capillaries, C outer retina and D choriocapillaris
While semi-automated and manual segmentation techniques are sometimes applied, particularly when significant retinal pathology is present and causing distortion of anatomical features or landmarks, there are specific automated segmentation boundaries that are commonly used. These include the inner limiting membrane (ILM), the nerve fibre layer (NFL), the inner plexiform layer (IPL), the inner nuclear layer (INL), the outer plexiform layer (OPL), the retinal pigmented epithelium (RPE), and Bruch’s membrane (BM). A specific example of how and where automated segmentation is applied in a commercial system (Opfigtovue AngioVue) to generate OCTA images of four distinct vascular plexuses is a follows:
- Superficial plexus (3 μm below the ILM to 15 μm below
- the IPL)
- Deep plexus (15 - 70 μm below the IPL)
- Outer retina (70 μm below the IPL to 30 μm below the RPE)
- Choroid capillary (30 - 60 μm below the RPE)
Recent advances in how the vascular plexuses in the eye are defined 7 have led to the development of additional automated segmentation parameters, with the systems now automatically defining up to eight distinct layers.
As well as using segmentation to generate en face images at different tissue levels, OCTA produces a variety of scan sizes centred on different parts of the retina/choroid. Most commercially available systems will produce scans centred on either the fovea or the optic disc, drawn from a 3D block with scan sizes ranging from 3x3mm to 9x9mm, or up to 12x12mm using image montage software.
OCTA Quantification
In order to ensure the objective evaluation of retinal and choroidal abnormalities it is important to have repeatable methodologies and parameters of OCTA quantification. Vessel density, as well as area of flow (perfusion) and non-flow (avascularity and non-perfusion) have all been utilised in order to quantify the extent or limits of certain conditions.
Vessel density is defined as the percentage area in which blood vessels are present in a given OCTA image, in the case of the AngioVue this is divided into nine equally sized squares (figure 3). Vessel density has been used to evaluate a variety of scenarios including; whether a reduction in parafovea superficial vessel density is predictive of future diabetic retinopathy severity,8 to determine if patients with mild POAG could be differentiated from pre-perimetric glaucoma eyes9 and to evaluate changes to the vessel density in superficial and deep retinal plexuses in patients with AMD.10
Figure 3: Vessel density defined as the percentage area in which blood vessels are present in nine equally sized squares in a 3x3mm macula centred scan of the superficial capillaries
The quantification of non-flow using OCTA is perhaps best illustrated using changes to the foveal avascular zone (FAZ) (figure 4). In conditions such as diabetic retinopathy OCTA has demonstrated superior ability over FA to accurately mark out the vessels surrounding the FAZ and monitor an increase in size of the FAZ often associated with reduced visual acuity prognosis. OCTA has also demonstrated larger FAZ sizes as well as FAZ remodeling and subtle capillary non-perfusion in diabetic patients with no clinical evidence of diabetic retinopathy.11
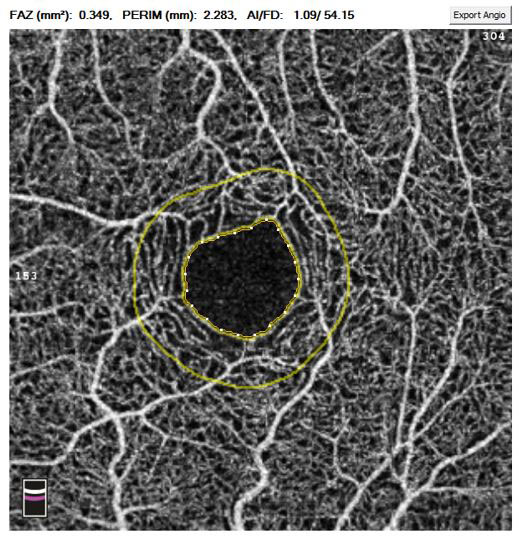
Figure 4: The quantification of non-flow using OCTA at the foveal avascular zone (FAZ) in a 3x3mm macula centred scan of the superficial capillaries
Flow index, which includes information about both vessel area and blood velocity in the vessels is another metric which is commonly obtained from en face angiograms. However, flow index cannot be regarded as a true volumetric measure of blood flow because of the saturation effect of the flow signal inherent in high flow velocity in vessels larger than capillaries.12 As a result, flow index demonstrates greater sensitivity in detecting physiologic and metabolic change but is less useful for diagnosing and monitoring vascular pathology.
Although vessel density, flow and non-flow were often manually calculated by the operator, most commercially available OCTA systems now provide image analytics and quantification software as part of their scan review functionality.
Comparison of OCTA with dye-based angiography
Both FA and ICGA are invasive, time-consuming imaging techniques which carry significant risks for the recipient. While the ability of OCTA to capture useful images to assist in the detection and management of a variety of conditions is not in question, there are significant differences between OCTA images and those produced by dye-based techniques, and when compared side by side, each method has distinct advantages and disadvantages over the other.
OCTA carries little or no risk to the patient when compared with dye-based examinations. While both FA and ICGA have a host of associated side-effects, from the relatively minor such as temporary tissue discolouration, headache or nausea to potentially very serious adverse reactions including hypotension, anaphylaxis or cardiac arrest, OCTA carries no greater risk than other non-invasive ophthalmic examinations. This means that OCTA is highly repeatable with multiple examinations over a relatively short period of time, even on the same day being possible. In addition to the risk of side-effects, dye-based angiography is contraindicated in certain patients such as during pregnancy or in those suffering from kidney disease, OCTA has no such contraindications.
The ability to capture OCTA images in a matter of seconds is another major advantage of this techniques when compared with the extended time required to complete a dye-based examination, 10-30 minutes depending on the circumstances and clinical requirements. As well as being time consuming FA and ICGA can be relatively expensive, particularly when staffing is taken into account. Whereas OCTA can be undertaken by a single, relatively junior member of staff with minimal training, dye-based techniques require highly trained and skilled technical staff as well as a doctor or, as is more often the case now, a nurse to deliver the intravenous injection and supervise the procedure.
When compared with the relatively narrow field of view achieved with OCTA the (ultra)wide field images that can be achieved with dye-based angiography mean that both FA and ICGA continue to play a significant role in ophthalmology. FA in particular remains the gold standard for the detection of both choroidal neovascularization (CNV), as well as retinal neovascularization such as neovascularization of the disc (NVD) and neovascularization elsewhere (NVE) associated with diabetic retinopathy. However, these techniques produce 2D images of ocular circulation, with limited and indistinguishable depth penetration or segmentation thus restricting their utility for detailed investigation of the retinal and choroidal vasculatures. Furthermore, in dye-based techniques some retinal or choroidal pathology can be obscured by areas of hyper-fluorescence as a result of leakage or pooling and by media opacities such as cataracts.
As previously described, the 3D depth resolved nature of OCTA facilitates segmentation of the various layers of the retina and into the choroid. This ability allows for the presentation of 2D en face image slabs of specific layers of vasculature, a major advantage over the relatively superficial mixed picture produced by FA in particular.
It should be acknowledged, however, that in many circumstances leakage, from neovascularisation or exudation, staining associated with drusen or chorioretinal scarring and pooling in serous detachments visible in FA images is exactly the indicator that the examiner is intending to capture in order to highlight the presence of certain conditions. Because OCTA relies on the movement of blood to generate images it cannot detect leakage, staining or pooling. OCTA can, however, detect neovascularisation, which may be the origin of leakage and accurately locate the level within the tissue at which it is situated.
OCTA Image Artefacts
OCTA imaging is susceptible to a number of different artefacts both during image capture and during image post-processing subsequent to acquisition. An awareness of the main artefact types and their appearance is essential for the safe and effective interpretation of images and the ability to differentiate between anatomical features, signs of disease and artefacts is of paramount importance.
As discussed elsewhere in this article the foundation of all OCTA systems is the rapid acquisition of two scans at the same point in order to determine movement (blood flow) as opposed to static tissue. While these images are captured in rapid succession, up to 100,000 A-scans per second, any significant eye movement between scans will introduce noise into the final image. These motion artefacts are particularly apparent in patients with poor fixation, such as those with AMD, and blinks or even very subtle saccadic movements can have a significant impact on scan quality. In the example shown here (figure 5) the 3 x 3mm fovea centred scan shows motion artefacts generated by both blinks (black bands) and much smaller saccadic motion (white bands).
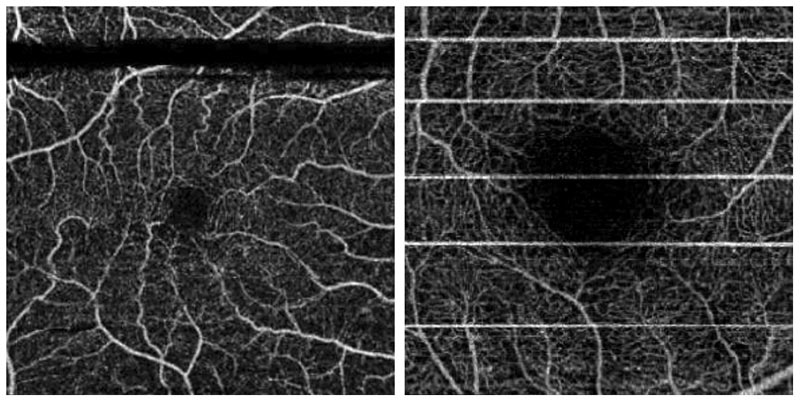
Figure 5: Motion artefacts generated by both blinks (black bands) and much smaller saccadic motion (white bands) in a 3x3mm macula centred en face scan of the superficial capillaries
In order to minimise these motion artefacts most commercially available OCTA systems have developed eye tracking components which allow for subtle movements to be tracked or even facilitate the temporary suspension of scanning for a fraction of a second until the patient’s eye is re-aligned. As well as eye tracking, which forms part of Optovue’s AngioVue Dual Trac system, this technique also employs motion correction technology (MCT) which performs precise pixel level registration in 3D and image merging of two orthogonal scans (Fast X and Fast Y) (figure 6) to further reduce residual motion and improve signal-to-noise ratio.
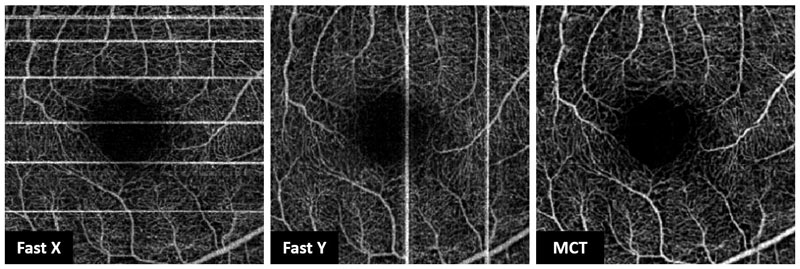
Figure 6: Motion correction technology (MCT) using merged Fast X and Fast Y scans to reduce motion artefacts
Erythrocytes flowing in the superficial vasculature can cast shadows on the deeper layers of the retina. Light that passes through moving blood will meet tissue below these vessels and when it strikes the RPE it can be reflected back to the OCTA device leading to duplication of the superficial vascular pattern on segmented en face images of the deeper layers (figure 7). These projection artefacts can cause miscalculation of vessel density or area of flow, and in some circumstances can be misinterpreted as CNV.
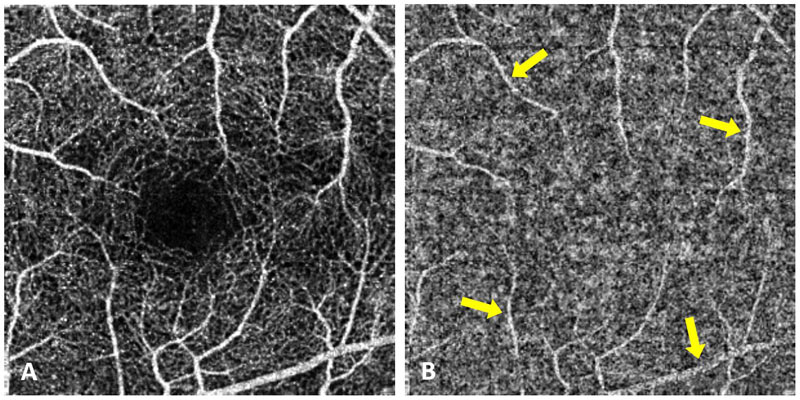
Figure 7: Projection artefacts (yellow arrows) from the superficial scan (A) visible in the deep capillary scan (B)
A number of different solutions to overcome projection artefacts have been implemented including the ‘slab subtraction’ method whereby the superficial flow signal pattern is subtracted from the angiogram of the deeper slab. While this approach will eliminate vessels that are not truly present it will result in an absence of any vasculature at that position thus potentially underestimating the vessel density, particularly in the deep retinal layer. A recent development for projection artefact removal in the Optovue AngioVue system is termed 3D PAR (projection artefact removal), which can identify multiple vessels along an A-scan without assuming pre-defined slab boundaries or slab and vessels numbers. This approach effectively reduces projection in all posterior layers without impacting the true picture of deeper layers (including CNV) and allows for more reliable and reproducible OCTA quantification13 (figure 8).
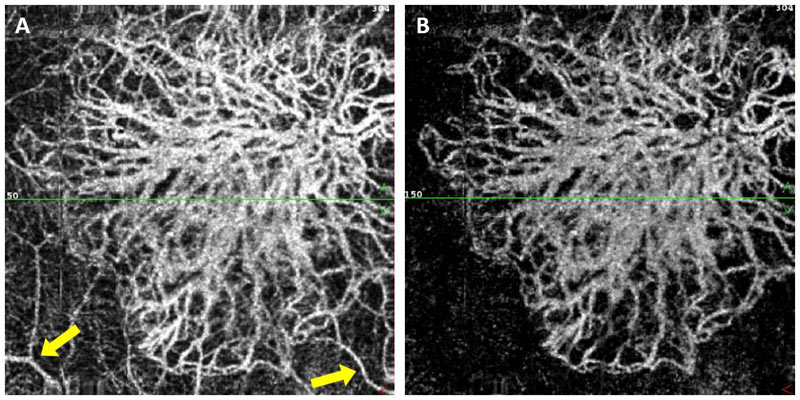
Figure 8: Projection artefacts (yellow arrows) from the superficial layers visible in the deeper layers (A) effectively reduced/removed using 3D PAR while retaining in situ CNV signal (B)
Clinical Applications
Both the retinal and choroidal vasculature are impacted by a range of pathology associated with a myriad of ocular diseases. In conditions such as AMD, diabetic retinopathy, blood vessel occlusions, glaucoma and macular telangiectasia the microvasculature in particular is adversely affected. While dye-based imaging techniques have historically provided the gold standard for imaging and diagnosing such conditions, OCTA and in particular the ability of this technology to non-invasively image blood vessels at different layers within the tissue is already having a significant impact on the diagnosis and management of many of these conditions.
The capillary networks of the retina are arranged into distinct layers. With the superficial retinal capillary plexus, predominantly located in the ganglion cell layer and the radial peripapillary capillary plexus in the retinal nerve fibre layer forming the superficial vascular complex (SVC) and the deep capillary plexus at the inner nuclear layer’s outer boundary, along with a small intermediate layer at the inner nuclear layer’s inner margin, making up the deep vascular complex (DVC). Whereas FA imaging can only effectively detect superficial retinal capillaries OCTA can differentiate between these two complexes and can demonstrate how each is differently affected by certain conditions.
The ability of OCTA to clearly visualise the choroidal circulation is less effective because light is scattered as it travels through the retinal layers with the highly reflective RPE in particular significantly reducing the amount of light reaching the choroidal vasculature.
AMD and CNV
With a global prevalence in excess of 8% AMD is a major source of visual impairment as well as being a considerable financial burden on healthcare budgets. The role of OCTA within this field is expanding rapidly and, in particular the evaluation of choroidal neovascular membranes (CNV), which help define the progression from non-exudative to exudative AMD, to determine their location is a key functionality of this technology. Because the classification and subsequent management of CNV is dictated by its location within the layers of the retina and choroid the segmentation capability of OCTA has revolutionised this process. Type 1 CNV is present below the RPE, type 2 above and type 3, also referred to as retinal angiomatous proliferation (RAP) is identifiable by new vessels extending from the choroid through the retinal layers and forming anastomosis between them.
Approximately four out of five cases of AMD are of the non-exudative dry type and while key feature of this condition include drusen, RPE abnormalities and geographic atrophy some patients with dry-AMD are found to have CNV, which are not yet leaking.14 The early detection of CNV before it alters the normal architecture of the retina or begins to leak is therefore of paramount importance in reducing or preventing vision loss. It should be noted, however, that where geographic atrophy is present OCTA images should be interpreted cautiously as degeneration of the RPE and choriocapillaris can allow for deeper light penetration and subsequent visualisation of the large choroidal vessels, which could be misinterpreted as CNV.
Diabetic Retinopathy
Macular involvement (maculopathy) in diabetic retinopathy will take one of two forms, oedematous or ischaemic. The management of macular oedema associated with DR has in recent years utilised OCT as a key examination technique in determining the presence of fluid. In ischaemic maculopathy FA has been, and remains the gold standard in the evaluation of retinal perfusion. Recently, several clinical findings relating to different stages of DR have been identified using OCTA of the macula. These include areas of expanding non-perfusion identified as a progressive reduction in vessel density in macular OCTA images (figure 9), an abnormally large and expanding FAZ, as well as more subtle signs such as arteriolar wall staining and narrowing, illustrated as intense attenuation of the calibre of the microvasculature and intra retinal microvascular abnormalities (IRMA) appearing as dilated terminal vessels surrounded by areas of capillary loss.15 In addition, OCTA has also demonstrated the ability to highlight both NVD and NVE, signs of disease proliferation although it will not identify leakage from these abnormal vessels.
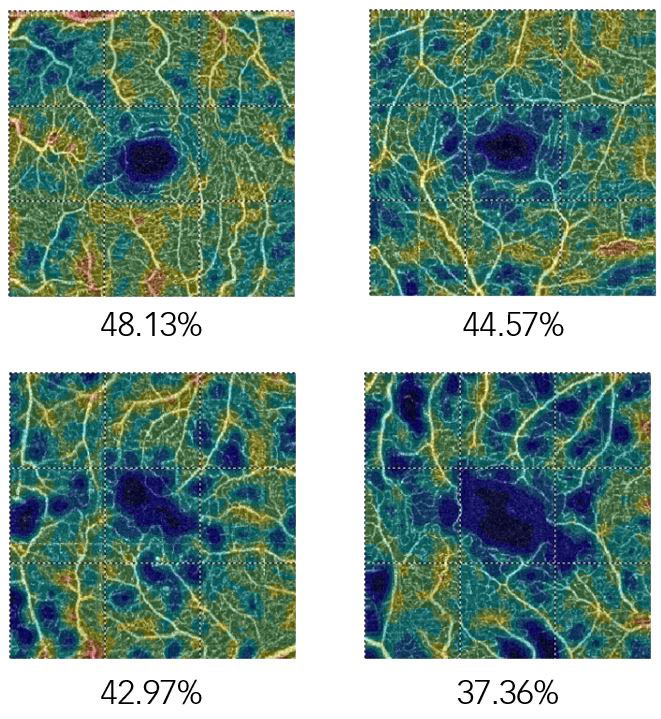
Figure 9: Expanding non-perfusion in a patient with diabetes identified as a progressive reduction in vessel density in macular OCTA images
Glaucoma
A significant and growing body of evidence suggests that changes to the retinal vasculature of people with glaucoma, in both the optic nerve head (ONH) and the peripapillary capillaries plays a role in the subsequent development of the condition.16
A decrease of up to 25% in the flow index of the ONH, strongly correlates with visual field pattern standard deviation and has been demonstrated in a number of studies confirming the ability of OCTA to detect glaucoma and an association with function and structural damage.
The loss of retinal ganglion cells and their axons in the NFL seen in patients with glaucoma is also associated with a reduction in perfusion in the SVC, and OCTA has been used to demonstrate a reduction in both peripapillary flow index and vessel density.17 A relationship between damage to the lamina cribrosa (LC) and a reduction in peripapillary vessel density has also been demonstrated using OCTA and has shown a direct correlation between the location of LC defects and microvascular impairment, raising the possibility of a causal effect.
Other conditions
The use of OCTA in the detection, classification, treatment and management has been demonstrated in a host of other conditions.
In type 1 macular telangiectasia (MacTel) OCTA has identified focal capillary telangiectasias in the DVC as well distortion of the FAZ in the SVC. While in the early stages of MacTel type 2 mild changes have been observed in the DVC while the SVC appears normal.
In vascular occlusions details of changes in both the SVC and the DVC, which cannot be detected using FA have been demonstrated with OCTA. In venous occlusions an enlargement of the FAZ has been observed at the level of both vascular complexes and in arterial occlusions OCTA has been used to image the boundaries of areas of capillary non-perfusion associated with retinal ischaemia.
In inflammatory diseases such as retinal vasculitis OCTA has been used to detect a reduction in parafoveal vessel density, and retinal vascular abnormalities in birdshot chorioretinopathy have been detected with OCTA.
In central serous chorioretinopathy (CSR) OCTA has been used to highlight abnormal blood flow and to monitor treatment response in cases of chronic CSR.
Anterior OCTA
Although commercially available OCTA systems are optimised for the retina and, to a lesser extent, the choroid an emerging area of use is in vascular manifestations of diseases of the anterior eye, with the examination of both the cornea and the iris becoming more widely utilised. In patients with both deep and superficial corneal vascularisation secondary to ocular surface diseases OCTA scans can be obtained which demonstrate good vessel delineation.18 In patients with iris neovascularization (INV), sometimes referred to as rubeosis iridis, OCTA has been used for the detection and classification of NVI, with one particular study demonstrating OCTA to image both normal and pathological iris vessels.19
The future
As the range of conditions which can be successfully imaged using OCTA continues to expand and improvements in image clarity are brought about by advances in the elimination of artefacts, so the ubiquity of this technique will continue to grow. The use of OCTA in the field of glaucoma in particular seems set for enormous growth as does its use for anterior imaging in ocular surface diseases.
Ever faster scan capture, particularly through the development of swept source technology will play a major role in the development of OCTA with the potential for an increase in current speeds by a factor of 10 cited by some industry experts.20
The areas of automated segmentation, measurement and analysis are all set to improve with the development of better, faster software and newly emerging approaches to OCT such as Master-Slave21 will all contribute to opening up an ever-growing number of clinical applications for OCTA.
Eventually, as with OCT before it, the cost of this technology will begin to fall making OCTA an affordable and indispensable tool for both ophthalmological and optometric practice.
Grant Duncan is a medical photographer and experienced retinal grader and clinical training manager at Haag Streit UK.
All images courtesy of OptoVue except figure 8 courtesy of Dr Pravin Dugel, Phoenix, AZ (USA)
References
- D Huang, EA Swanson, CP Lin, JS Schuman, WC Stinson, W Chang, MR Hee, T Flotte, K Gregory, CA Puliafito, and JG Fujimoto. Optical Coherence tomography, Sci, (Online), 254(3035), pp. 1178-1181 (1991).
- AM Zysk, ET Nguyen, AL Oldenberg, DL Marks, SA Boppart. Optical coherence tomography: a review of clinical development fom bench to bedside. Journal of Biomedical Optics 12(5), 051403 (September/October 2007).
- Wojtkowski, MR Leitgeb, A Kowalczyk, T Bajraszewski, and AF Fercher. 2002. In vivo human retinal imaging by Fourier domain optical coherence tomography. J Biomed Opt. 7:457-463.
- Makita S, Hong Y, Yamanari M, Yatagai T, Yasuno Y. Optical coherence angiography. Opt Express. 2006;14:7821–40. [PubMed: 19529151]
- An L, Wang RK. In vivo volumetric imaging of vascular perfusion within human retina and choroids with optical micro-angiography. Opt Express. 2008;16:11438–11452.
- Jia Y, Tan O, Tokayer J, Potsaid B, Wang Y, Liu JJ, et al. Split-spectrum amplitude-decorrelation angiography with optical coherence tomography. Opt Express. 2012;20:4710–25. [PMCID: PMC3381646] [PubMed: 22418228]
- JP Campbell, M Zhang, TS Hwang, ST Bailey, DJ Wilson, Y Jia & D. Huang. Detailed Vascular Anatomy of the Human Retina by Projection-Resolved Optical Coherence Tomography Angiography. Nature Scientific Reports | 7:42201 | DOI: 10.1038/srep42201
- Goøębiewska J, Olechowski A, Wysocka- Mincewicz M, Odrobina D, Baszyńska-Wilk M, Groszek A, et al (2017) Optical coherence tomography angiography vessel density in children with type 1 diabetes. PLoS ONE 12(10): e0186479.https://doi.org/10.1371/journal.pone.0186479
- Akil H, Huang AS, Francis BA, Sadda SR, Chopra V (2017) Retinal vessel density from optical coherence tomography angiography to differentiate early glaucoma, pre-perimetric glaucoma and normal eyes. PLoS ONE 12(2): e0170476. doi:10.1371/journal.pone.0170476
- Toto, Lisa MD, PhD; Borrelli, Enrico MD; Di Antonio, Luca MD, PhD; Carpineto, Paolo MD; Mastropasqua, Rodolfo MD. Retinal vascular plexuses changes in dry age-related macular degeneration, evaluated by means of optical coherence tomography angiography. RETINA: August 2016 - Volume 36 - Issue 8 - p 1566–1572
- de Carlo TE, Chin AT, Bonini Filho MA, Adhi M, Branchini L, Salz DA, Baumal CR, Crawford C, Reichel E, Witkin AJ, Duker JS, Waheed NK. Detection of microvascular changes in eyes of patients with diabetes but not clinical diabetic retinopathy using optical coherence tomography angiography. Retina 2015 Nov;35(11):2364-70.
- Pechauer AD, Jia Y, Liu L, Gao SS, Jiang C, Huang D. Optical coherence tomography angiography of peripapillary retinal blood flow in response to hyperoxia. Invest Ophthalmol Vis Sci. 2015;56:3287–3291. DOI:10.1167/iovs.15-16655
- Miao Zhang, Thomas S. Hwang, J. Peter Campbell, Steven T. Bailey, David J. Wilson, David Huang and Yali Jia. Projection-resolved optical coherence tomographic angiography. 1 Mar 2016 | Vol. 7, No. 3 | DOI:10.1364/BOE.7.000816 | BIOMEDICAL OPTICS EXPRESS 816.
- Jeffrey Ma, Ria Desai, Peter Nesper, Manjot Gill, Amani Fawzi and Dimitra Skondra. Optical Coherence Tomographic Angiography Imaging in Age-Related Macular Degeneration. Ophthalmology and Eye Diseases Volume 9: 1–7. sagepub.co.uk/journalsPermissions.nav DOI: 10.1177/1179172116686075
- Jose Mauricio Botto de Barros Garcia, David Leonardo Cruvinel Isaac and Marcos Avila. Diabetic retinopathy and OCT angiography: clinical findings and future perspectives. Int J Retin Vitr (2017) 3:14 DOI 10.1186/s40942-017-0062-2
- Bonomi L, Marchini G, Marraffa M, Bernardi P, Morbio R, Varotto A. Vascular risk factors for primary open angle glaucoma: The Egna-Neumarkt Study. Ophthalmology. 2000;107:1287–93. [PubMed: 10889099]
- Liu L, Jia Y, Takusagawa HL, Pechauer AD, Edmunds B, Lombardi L, et al. Optical coherence tomography angiography of the peripapillary retina in glaucoma. JAMA Ophthalmol. 2015;133:1045–52. [PMCID: PMC4950955] [PubMed: 26203793]
- Marcus Ang, Kavya Devarajan, Suchandrima Das, Tisha Stanzel, Anna Tan, Michael Girard, Leopold Schmeterer, Jodhbir Mehta. Comparison of anterior segment optical coherence tomography angiography systems for corneal vascularisation. BJO Online First, published on September 22, 2017 as 10.1136/bjophthalmol-2017-311072
- Philipp K. Robertsa, Debra A. Goldsteina, and Amani A. Fawzii. Anterior Segment Optical Coherence Tomography Angiography for Identification of Iris Vasculature and Staging of Iris Neovascularization: A Pilot Study. Curr Eye Res. 2017 August ; 42(8): 1136–1142. doi:10.1080/02713683.2017.1293113.
- 25 Years On, OCT Looks To Future Co-inventor David Huang, PhD, shares the next big thing for today’s big thing. Retina Specialist. Interview 2016. http://www.retina-specialist.com/article/25-years-on-oct-looks-to-future
- Ramona Cernat, Adrian Bradu, Niels Møller Israelsen, Ole Bang, Sylvain Rivet, Pearse A. Keane, David-Garway Heath, Ranjan Rajendram, and Adrian Podoleanu. Gabor fusion master slave optical coherence tomography. Biomed Opt Express. 2017 Feb 1; 8(2): 813–827. Published online 2017 Jan 13. doi: 10.1364/BOE.8.000813