Topography was first described in 1619 when Christopher Schiener described how reflections from glass marbles when viewed in the cornea gave an indication of the shape of the cornea.1 Placido followed this up in the late 19th century by using symmetrical rings reflected in the cornea to measure its curvature.1 2 Today Placido’s disc is still popular, but technology has moved on and now devices are available that measure both front and back surfaces of the cornea.Looking at the shape of the cornea has been vital for fitting contact lenses and monitoring corneal pathology, but as cataract surgery becomes a refractive procedure topography can be an important step in biometry assessment as well as laser refractive surgery and monitoring corneal pathologies. This article will run through the most common maps used in topography and explain how they are used both in optometry and ophthalmology practice.
There are a number of techniques employed by modern topographers which allow them to accurately measure the surface profile of the cornea. These include;
- Placido-base technology
- Scheimpflug technology
Placido-base technology
Placido’s disc is a fairly straight forward concept. The reflected image of a known series of concentric rings is measured. By comparing the difference between the reflected image and the original image measurements, profile readings can be calculated over the whole reflected image (see figure 1).
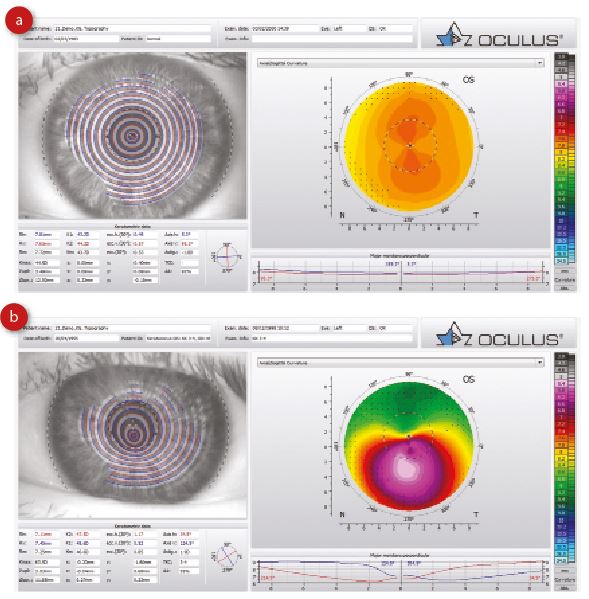
Figure 1: Placido rings reflected from (a) normal cornea and (b) a keratoconic cornea
The downside of Placido is it assumes the visual axis and centre of the pupil are co-incident and that the curvature at this point is zero. Also, Placido topography is actually a measure of the tear film, not the cornea, so tear film abnormalities can affect the image and measurements.
Another disadvantage of Placido is that it only measures the anterior surface of the cornea. This is fine for contact lens practice, for example, but some conditions, such as keratoconus, affect the posterior corneal surface, meaning that a posterior profile measurement helps in their detection and monitoring.
Placido-based topographers comprise the majority of units in optometric practice today. The Topcon CA800, Medmont E300 and Oculus Keratograph 5M are just three examples of currently available Placido-based topographers.
In 1995, Orbtek launched the Orbscan. This is a slit scanning device with a Placido disc that could image both anterior and posterior surfaces of the cornea, so allowing anterior and posterior elevation and corneal thickness to be measured.3 The Orbscan used the principle of best fit sphere to quantify the elevation of the anterior and posterior corneal surfaces above or below a reference sphere.
Scheimpflug Topography
Scheimpflug topography, a variant of projection topography, is an alternative method of measuring corneal curvature, and is utilised by the Oculus Pentacam. Commonly found in hospital corneal departments, the Pentacam was launched in 2004. This anterior segment maging device uses a Scheimpflug camera to clearly image the anterior and poster surfaces of the cornea and lens (figure 2).
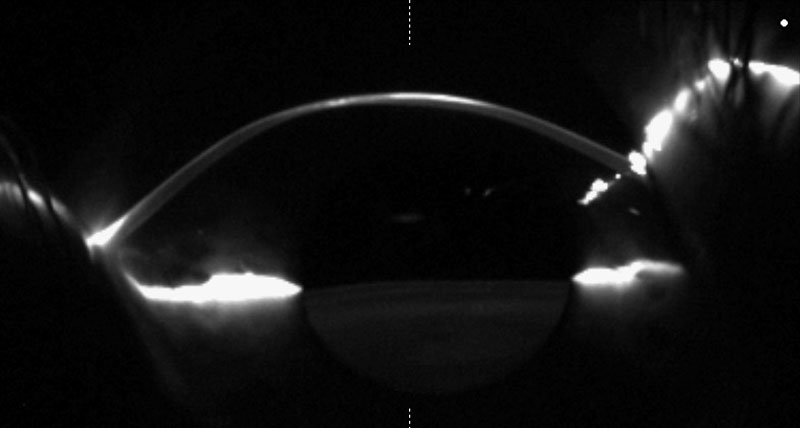
Figure 2 A: Scheimpflug image of a cornea with keratoglobus (see the online version of this article for a video of a cornea viewed through a Scheimpflug camera as non-contact tonometry is undertaken)
The Pentacam is constantly evolving, using research to develop software packages to help the clinician manage their corneal, refractive and cataract patients.
Image Capture
The most important part of topography is to make sure the scan is accurate. A poorly taken scan can sometimes look like the worst pathology. Here are a few key tips:
- On Placido systems, the tear film is the surface where the image is captured. A poor tear film will give a poor result. Ensure the patient is blinking normally up to taking the scan and that the eye is wide.
- Using a finger to hold a lid open will distort the tear film, corneal shape and give poor contour readings. Micropore tape carefully applied to keep the lid out of the way of the image may be a better alternative.
- Placido systems are centred upon the centre of the pupil, whereas some Schiempflug systems (like the Pentacam) centre the scan upon the apex of the cornea (where the first Purkinje image intersects with the cornea).4
- Before looking at any map it is worth giving a thought to the scale being used (figure 3). Absolute scales are good for comparing with other maps as the colour is the same for which ever eye is being viewed. Relative scales spread the colour according to the specific eye being looked at. If reviewing relative scaled maps, play close attention to the numbers not the colours.
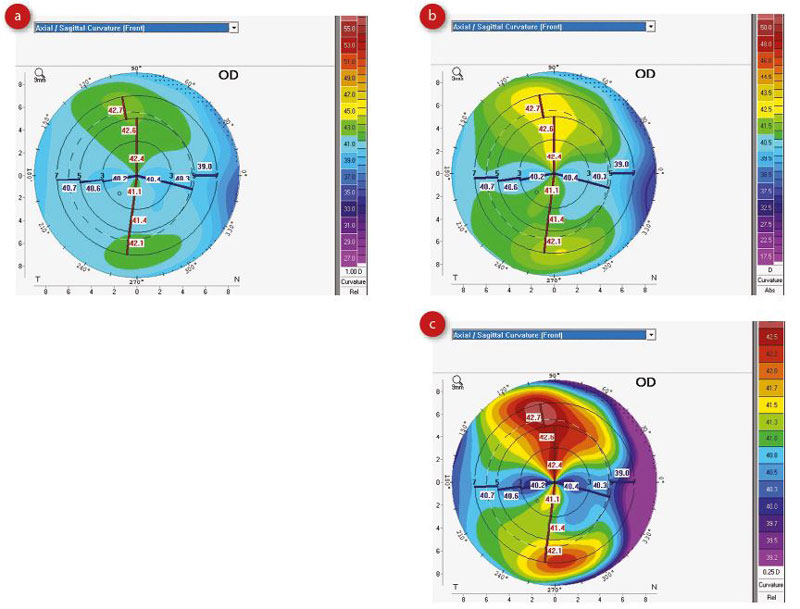
Figure 3: Different sagittal maps (a, b and c) look very different but are actually of the same eye. Note the maps have different scales. Always check the scale before analysing the image.
Understanding the Maps
Sagittal Axial Map
One of the most useful maps on a Placido system is the axial keratometric map or sagittal map. This is the best map for looking at astigmatism. Warmer colours indicate steeper K readings and cooler colours indicate flatter K readings (figure 4). The premise of the map is based on relating all points to a central axis. Values are more accurate in the centre and very useful for planning refractive procedures.
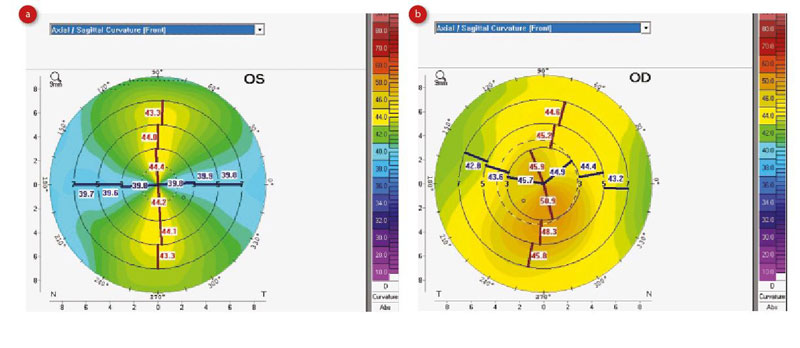
Figure 4: Sagittal maps showing regular contour lines in astigmatism (a) and irregular lines (b)
Tangential Map
For pathology more prevalent in the periphery, the tangential map (which measures local curvature points) may be more useful.
The sagittal, and to some degree the tangential, maps show us that astigmatism is rarely regular. The red lines indicate the steep axis across the various zones, and the blue lines the flat axis. Itis interesting to note, in an abnormal eye, that the axis is not symmetrical across the zones. Often the amount of astigmatism and axis are different when the top and bottom of the map are compared. Also, the flat and steep axis are not always at 90 degrees to each other. This is where we can start to understand aberrations. Simply put, higher order aberrations are the parts we cannot correct with symmetrical sphere and cylinder.
Refractive Power Map
This map is used for understanding the refractive effect of the cornea. Snell’s Law is used to calculate the refractive power, usually assuming a refractive index of 1.3375. Although a sphere has the same power everywhere, spherical aberration means it does not have the same refractive impact everywhere. In the refractive map, a calculation is performed to show the effect of the spherical aberration where the refractive power in the periphery is actually higher.
Corneal Thickness and Relative Pachymetry
Corneal thickness maps show the thickness of the cornea at different points across the cornea. The relative pachymetry maps display the thickness with reference to the normal population.
Renate Ambrosio and Michel Belin have demonstrated how the rate of change in thickness across the cornea is more important than single point pachymetry readings for identifying pathology. Average pachymetry values can be taken from theoretical rings on the cornea radiating out from the location of the thinnest point. These values can be plotted as values or as a percentage thickness increase and then compared to normative values (figure 5).
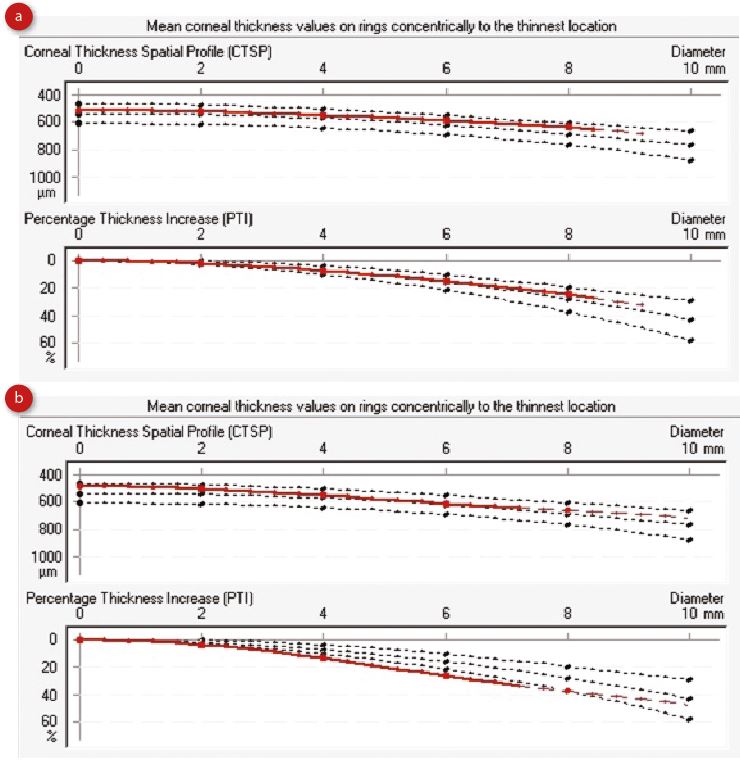
Figure 5: Image thickness progression for( a) a normal eye and (b) post Lasik surgery
Indices
These vary depending on the type of topographer used. However, detailed descriptions can be found in the relevant manual, or by clicking on the indices on screen. Most of the indices are designed to understand the anterior surface of the cornea. Modern topographers that measure the back surface do not have to make such assumptions, but the indices are still widely used today.
Here are a few commonly met indices;5
- Index of Surface Variance (ISV) – simply put, how irregular is the surface. Erosion syndrome, dry eyes, scars all effect this, as does advanced keratoconus
- Index of Height Asymmetry (IHA) – compares the height on the top half of the map with that on the lower half of the map so measuring horizontal asymmetry
- Keratoconus Index (KI) – indicator of likelihood that profile is linked to keratoconus
- Centre Keratoconus Index (CKI) – similar to above but related to central cornea
- Topographical Kerotoconus Classification (TKC) – another indicator of keratoconus based on the Amsler Kruhmeich grading scale6
- Shape Factor (SF) – this is a measure of corneal asphericity. A negative SF normally indicates a post myopic refractive surgery patient where the centre of the cornea is flatter than the periphery.
- Eccentricity (e) – these values are based on the mathematical description of an ellipse, where 0.0 represents a circle and 1.0 represents the maximum flattening in the periphery. Average corneas usually have an eccentricity of about 0.55 (e = 0.55).
- Corneal Irregularity Measurement (CIM) – this is an index which represents the irregularity of the corneal surface. The higher the irregularity index, the more difficult it is to fit the corneal surface with a contact lens. It often can predict irregular astigmatism or visual distortions. Higher CIM values indicate that ocular pathology, such as keratoconus or other pathologies are probable.
Best Fit Sphere or Elevation Maps
With the advent of cameras able to see the posterior surface (Orbscan and Pentacam) it became possible to measure the anterior and posterior surfaces of the cornea. Elevation maps look at the height of areas of the cornea with reference to a theoretical surface. Normally, this surface is the average spherical curve of the cornea fitted so that some of the measured corneal surface is above the surface (warmer colours) and some of the cornea is below (cooler colours), Normally the higher tissue is flatter and the lower tissue is steeper (figure 6).
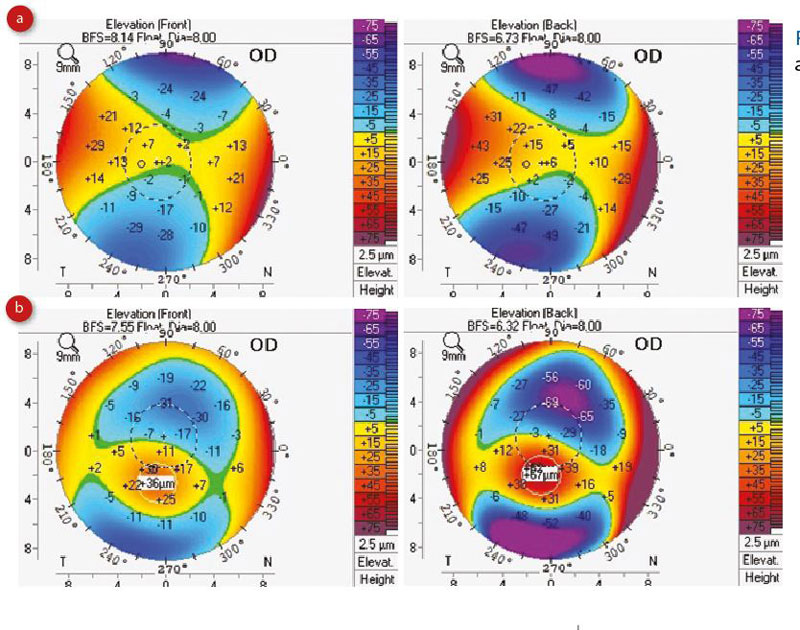
Figure 6: Elevation map of (a) a normal eye and (b) a keratoconic eye
Belin and Ambrosio have released normative data looking at an 8mm area (figure 7).
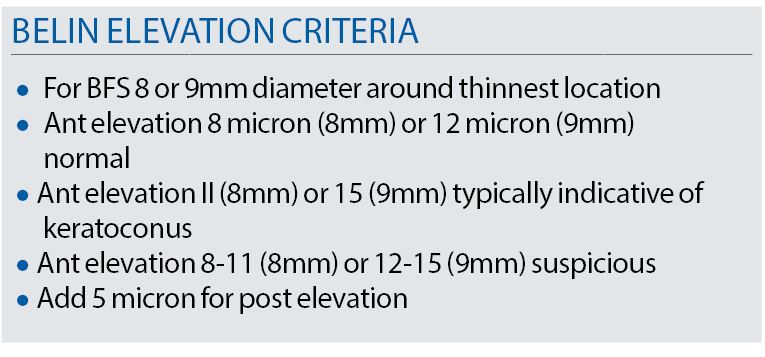
Figure 7
Elevation maps on Placido systems are extrapolated from the curvature data, but are still useful for identifying astigmatism, cones and irregular corneas. Belin and Ambrosio found that, in order to derive a more sensitive report for ectasia, the standard best fit sphere needed to be modified. They identified that sometimes the cone may be under reported when using the best fit sphere and devised an enhanced best fit sphere (figure 8).
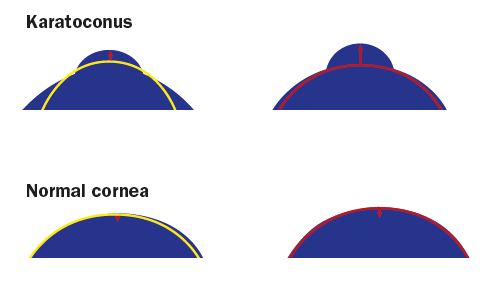
Figure 8: Enhanced best fit sphere
By calculating the best fit sphere (BFS) from more peripheral measurements the height of the cone could be more accurately determined (figure 9).
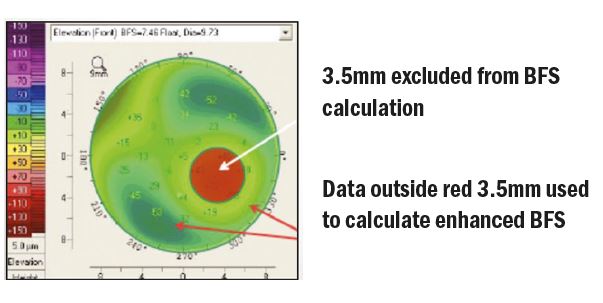
Figure 9: Central readings around the cone are ignored in the best fit sphere calculation. The new enhanced BFS is then refitted to the surface to give more accurate detection of cones.
Also, Belin and Ambrosio described a way of analysing corneal thickness. Rather than just looking at central pachymetry, they considered how the thickness of the cornea changed over the entire cornea from the centre to the limbus. Values are taken
from 22 rings going out from the centre of the cornea. Average readings are then plotted on a graph and compared to normal progression profiles.
The Belin/Ambrosio display also compares five parameters useful for detecting ectasia (figure 10).
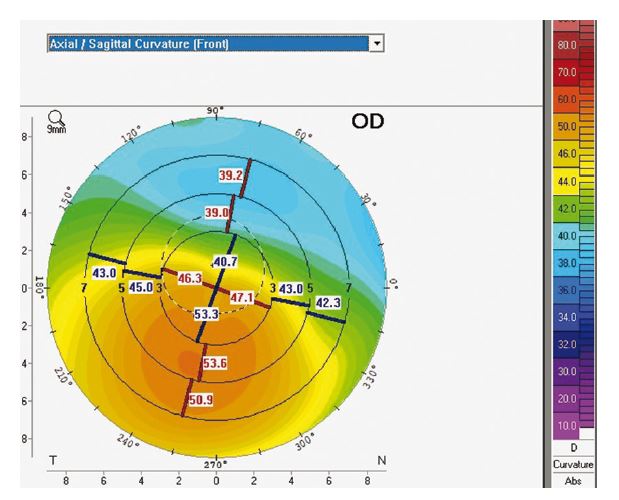
Figure 10: Belin Ambrosio display for enhanced ectasia (BAD)
These are;
- front surface elevation
- back surface elevation
- pachymetry progression
- corneal thickness
- art max (a calculation dividing the thinnest point by the max pachymetry progression)
This gives a give a total D value. The D value can be used to monitor change in a cornea.
IOL Formula
Topography is becoming more common place in biometry for calculating refractive powers for ‘difficult' corneas, as with keratoconics, prior to refractive surgery, high toricity and so on. In order to calculate powers for these corneas, it is necessary to think about K readings. One thing topography teaches us is that K readings are not the same superiorly and inferiorly (figure 11), yet all our calculations are based on assuming they are.
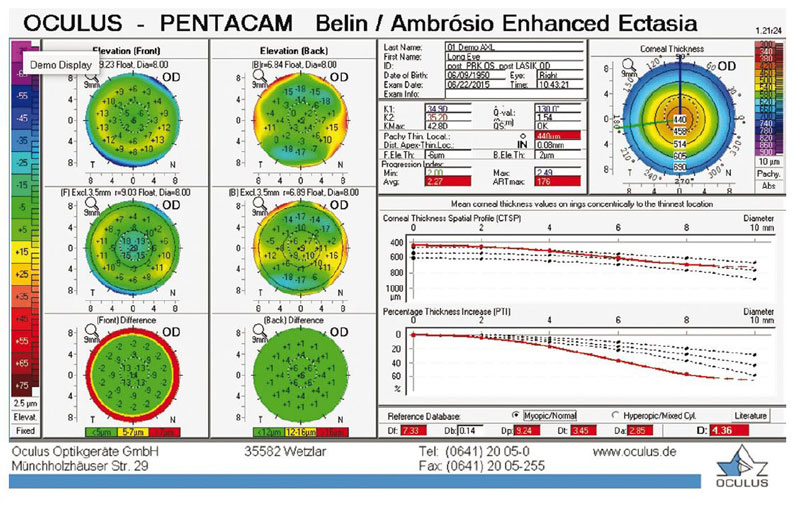
Figure 11 K readings are not always equal superiorly and inferiorly. In this case, the flat K (blue) varies from 40.7 D to 53.3D across the central 3mm zone
The posterior surface has an effect on the refractive outcome of intraocular lenses, especially torics.7 Looking at the axial sagittal map, it is possible to see that K readings can vary a lot around the ring where K readings are measured ( normally 3 to 3.3mm or 2.4mm if using the IOL Master)
The other thing that becomes apparent is that K readings can vary over the corneal surface. So, instruments measuring K readings at differing specific diameters may measure differently. This doesn’t mean the machines are wrong, but possibly indicate an asymmetry on the cornea.
Using reports like the power distribution map (figure 12) can allow a full understanding of the corneal shape.
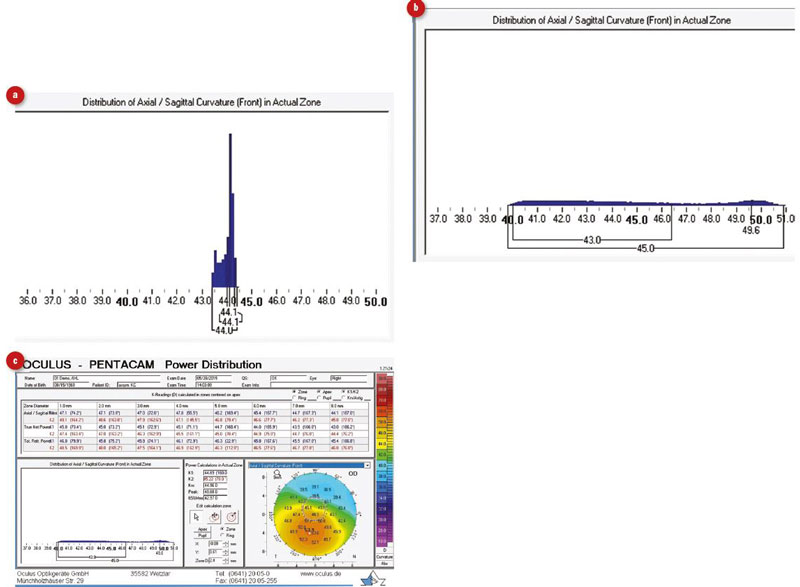
Figure 12: Power distribution maps. The poor distribution also plots the range of K readings within a specified zone. This example shows an optically ‘good’ cornea (a)and one with keratoconus.(b) and thePower Distribution Report (c)
K readings can be taken as an average of points in a set zone (such as a 3mm zone) or the average of points on a ring. Either way, we assume when fitting contact lenses and selecting IOLs that the top of the cornea is equal in steepness to the bottom.
We also assume that the anterior cornea is the same K reading as the one measured through the whole of the cornea. For complex IOL calculation, formulas are now using extended K readings that take into account the front and back surface K readings added together (like a thin lens calculation). This corneal measurement, called the true net power, is used successfully in a post refractive surgery IOL formula called Potvin Shammas Hill. Total corneal refractive power is also calculated using a ray tracing calculation that takes into account the refractive index and refraction at each surface. This is used in toric formulae like the Savini Toric Calculator.
Looking at distribution of Ks for the anterior surface can also come in handy when fitting contact lenses. Some software will show a fluorescein profile, which brings these measurements to life. Whilst not meant to replace a contact lens practitioner, lens fitting software can give an idea of how a lens may sit on the cornea.
Tear Film
Placido Systems take an image of rings reflected in the tear film. Before even taking a reading, an idea can be given of corneal the astigmatism and tear quality (figure 13).
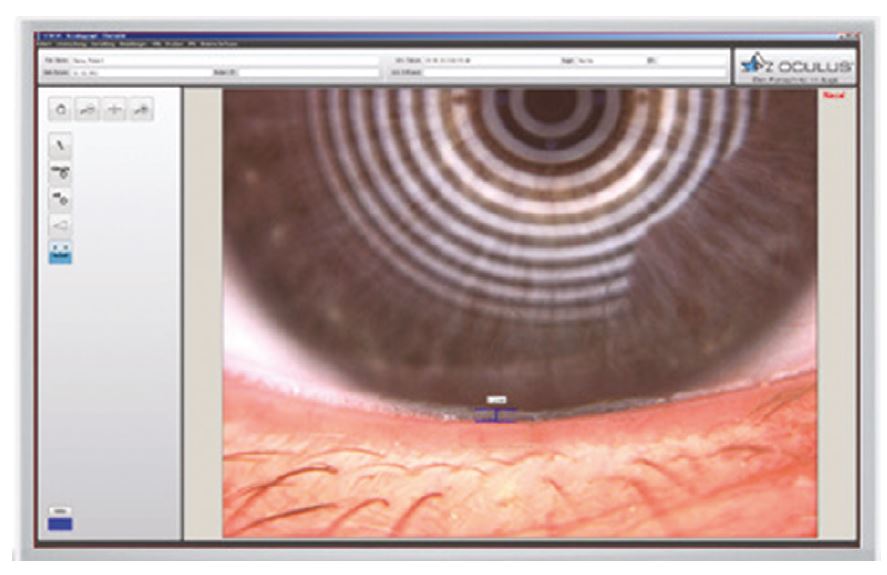
Figure 13: Placido image showing ‘oil slick’ feature of healthy tear film
Even on a basic Placido system, non-invasive tear break up time can be measured by asking the patient to blink and record the time until the ring image becomes distorted. Instruments that don’t rely on Placido, like the Pentacam, don’t measure the tear film but can still be affected by dry eye disease. Epithelial cells can change the shape of the cornea as they dry out or are lubricated.
As 0.1mm radius of curvature change has about 0.50D dioptric effect on refractive outcome, it pays to take a reading before putting any drops into the eye of the patient, and then taking another image some time after.
Baseline readings are vital to all topography, to decide if the shape is real, or caused by environmental influences, (drops, contact lenses, tonometry and so on). So what ever device type used it is recommended to record if any drops are used.
Conclusion
Topography is becoming an essential part of optometric practice, be it contact lens fitting or managing cross-linking in keratoconic patients in a hospital corneal department.
In my experience, most people only use one or two of the many data reports available. Courses, lectures and webinars are available to help. It is fascinating to understand how the cornea works optically and can help you provide the best solution for your patient.
Emma Deighan FBDO is a clinical trainer working in ophthalmology.
References
- Michael W Belin and Stephen S Khachikian. An introduction to understanding elevation-based topography: how elevation data are displayed – a review. Clinical and Experimental Ophthalmology 2008. doi: 10.1111/j.1442-9071.2008.01821.x
- Belin MW1, Duncan JK. Keratoconus: The ABCD Grading System. Klin Monbl Augenheilkd. 2016 Jun;233(6):701-7. doi: 10.1055/s-0042-100626. Epub 2016 Jan 20.
- Kohnen T. Posterior corneal astigmatism. J Cataract Refract Surg. 2013 Dec;39(12):1795. doi: 10.1016/j.jcrs.2013.10.017.
- S. Arba Mosquera, S. Verma, C. McAlinden, Centration axis in refractive surgery, Eye Vis, 2 (2015), p. 4
- BT Lopes, IC Ramos, F Faria-Correia, A Luz, B de Freitas Valbon, MW Belin, R Ambrosio Jr, J Kerat. Ect Cor Sept-Dec, 2012; 1(3):167-172, Correlation of topometric and tomographic indices with visual acuity in patients with keratoconus
- Krumeich JH, Daniel J, Knueel A. Live - Epikeraophakia Keratoconus, J Cataract Refract Surg 1998;24(4):456-63.
- Keratometry versus total corneal refractive power: Analysis of measurement repeatability with 5 different devices in normal eyes with low astigmatism. Sylvia Fityo, Jens Buhren, MD, PhD, Mehdi Shajari, MD, Thomas Kohnen, MD, PhD, FEBO J Cataract Refract Surg, Vol 42, April 2016