During our long days, most of us challenge our visual system with complex and changing situations such as:
- Prolonged near work
- High colour/contrast resolution demand during digital device use for 10 hours a day or more
- Artificial light at work or contrast demands in low-light conditions
- Exposure to air-conditioning in the office and when driving
- Glare while driving and from approaching vehicles when driving at night
- Demands for motion detection and peripheral vision during sport
Figure 1 Visual field and depth perception

We take for granted our ability to perform this large and varied array of tasks seamlessly and efficiently. So, any visual disturbance arising over the course of the day immediately raises our awareness and potentially lowers our vision satisfaction.
The visual system is incredibly complex. Multiple elements capture, focus and process light to make sense of our visual environment. The cornea and crystalline lens are the refractive elements that make up the imaging components of the visual system. Images are transduced by photoreceptors, converting visible electromagnetic radiation into electrical signals. But how the brain translates these signals to perceive the qualities of a scene and objects within it (such as colour, location, luminosity, movement, shape, size and texture) is less well understood.
Even more challenging are attempts to determine the quality of visual perception with a measure of satisfaction. This process is confounded by cognitive factors, linguistics, attention, adaptation, and environment. Visual satisfaction is also influenced by factors such as contrast sensitivity, stereoacuity and visual fields as well as visual acuity.1 And visual discomfort contributes significantly to visual satisfaction, as seen with long-term digital device use, and 3D displays and virtual reality systems.2,3
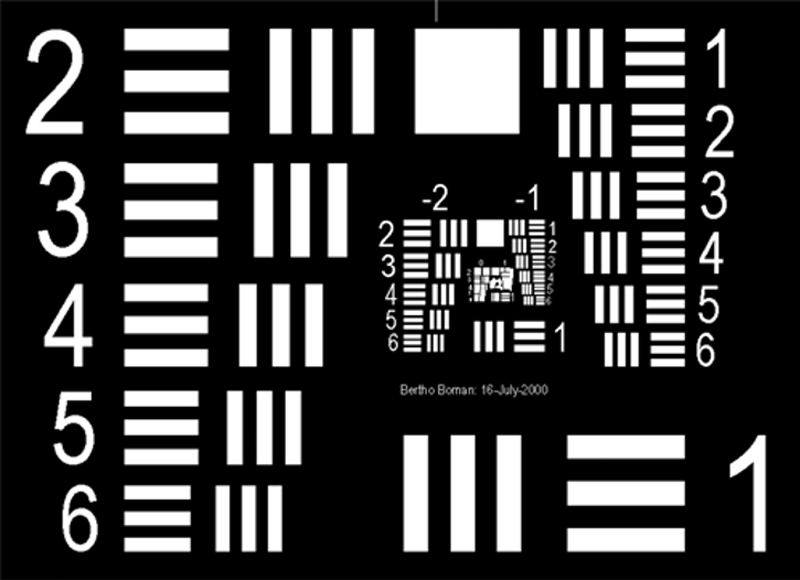
Figure 2a Resolution
Our visual system has evolved to accomplish a specific set of tasks. But changing demands are now challenging our vision more than ever. Today, we may spend more than half of our waking hours in front of digital devices.4 Asthenopic symptoms increase as the amount of near work increases.5 And if most of this near work is with small digital devices (phone or tablet), symptoms may be exacerbated. With these devices, shorter working distances (typically 32cm, but often as close as 19cm) and small font sizes (typically 1.6mm7) require 6/3 acuity for comfortable prolonged reading.6,7
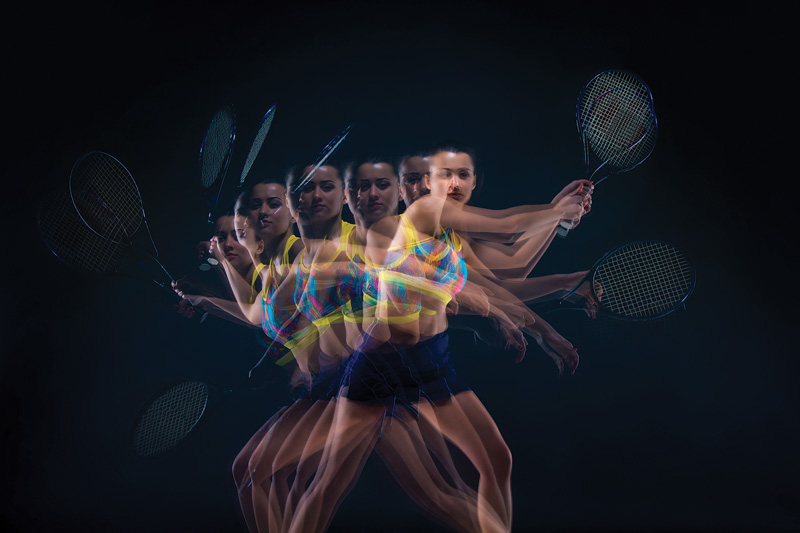
Figure 2b Motion detection threshold
Vision satisfaction also fluctuates throughout the day and with different tasks. Blurred vision, vergence difficulties and accommodative problems are common complaints after prolonged near work; these are mostly related to visual environmental factors, primarily glare, lighting, screen resolution and work station arrangement.8,10
It is hypothesised that vision satisfaction is driven primarily by three dimensions of vision:
- spatial awareness
- discriminating efficiency
- visual endurance
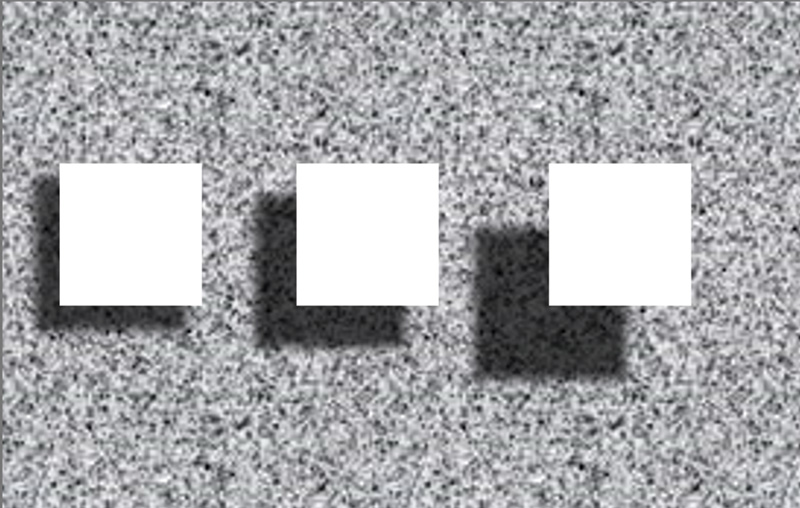
Figure 2c Chromatic contrast

The first two dimensions relate to functional vision and describe our ability to execute the visual tasks that our visual system evolved to perform: near, intermediate and distance tasks, colour, contrast and movement detection. The third dimension – visual endurance – provides a measure of the transient impact of biological and environmental factors on vision satisfaction.
Figure 2d Stereoacuity
Spatial awareness
Spatial awareness refers to the perception of objects in the surrounding environment, understanding their meaning and location, and a projection of their status in the near future.11 While much of this process is cognitive, it is underpinned by two critical elements of the visual system: visual field and depth perception (Figure 1).
In the human eye, field of view (FOV) varies with facial anatomy, giving an asymmetric FOV of approximately 60° nasally, 60° superiorly, 70° inferiorly and 100° temporally.12 As a result, a typical binocular FOV is 135° sagittally and 200° tangentially.13
During visual field testing, sensitivity is determined as a function of field angle (i.e. retinal eccentricity), where the visual field refers to the threshold visual field angle. Sensitivity, in ambient photopic and mesopic lighting, peaks at the fovea and falls off with field angle so that the sensitivity profile appears like a hill, often referred to as the hill of vision.14
Depth perception refers to the ability to assess the distance of objects within the environment. This is largely a monocular phenomenon, driven by cues that include motion parallax,15 optical expansion,16 perspective, texture and blur.14 Of course, binocular vision confers a depth perception advantage over monocular vision. Stereopsis refers to the element of depth that is mediated by binocular vision. Within the binocular FOV, there is an overlap of approximately 120° tangentially where binocular vision occurs.17
Although stereopsis does not improve the performance of all depth-related tasks, it does enhance tasks such as detecting the direction and speed of approach, and the processing speed of depth information.17
Spatial awareness, the first dimension of vision satisfaction, refers to our ability to perceive visual stimuli in the spatial volume of interest.
Discriminating efficiency
Discriminating efficiency is defined as the ratio of correct discriminations to the total number of discriminations, where discrimination refers to the recognition of differences between elements in the environment. While much of this process is cognitive, it is underpinned by some critical capabilities of the visual system: resolution, chromatic contrast sensitivity, motion detection threshold and stereoacuity (figure 2a to 2d).
Resolution refers to the minimum distance at which two points can be distinguished. It is often specified as the minimum angle of resolution in units of arc seconds.18 Other than by colour, an object is distinguishable due to its contrast and geometrical dimensions. Chromatic contrast refers to differences in chromaticity in a scene or image.19 It contributes significantly to the perception of contour and object recognition in natural scenes.20
Motion detection threshold refers to the minimum displacement needed for accurate assessment of direction of motion.21 And stereoacuity is the smallest depth interval a subject can detect; it is specified by the threshold difference in binocular disparity in arc seconds.17
All four measures contribute to the visual system’s discriminating efficiency, the second dimension of vision satisfaction.
Visual endurance
Patients expect the same seamless, comfortable vision at any point in time, any day, regardless of the task or environment. Specifically, they expect a lack of awareness of their spatial and discriminating vision efficiency. However, evolution has given humans an innate capacity to notice changes and to ignore constant, stable stimuli.
Consequently, any biological or environmental factor triggering a change in vision quality immediately raises awareness and is registered as, at best, inconvenience or, at worst, discomfort. In fact, an association has recently been demonstrated between quality of vision and ocular surface sensation.22 Environmental factors affecting vision involve tasks that our visual system has not had time to evolve to, such as prolonged near work, night driving or digital device use.
As we have seen, prolonged near tasks and digital devices present a unique set of issues that also include ocular dryness due to reduced blinking. Night driving issues vary from noticing lane demarcations or reading street signs to the glare from oncoming headlights.
Environmental factors affecting vision relate to dryness-inducing air conditioning whether in a car, office or department store; low humidity as during air travel; as well as sudden changes in luminance such as moving from indoors to outdoors or photostress due to glare from the sun. Diabetes and dry eye have been identified as biological sources of vision fluctuation.23,24 The tear film, another key refractive element in the visual system, can also introduce transient refractive effects when unstable.25,26
Figure 3 The many aspects of functional vision
 Hence visual endurance, the third dimension of visual satisfaction, provides a measure for the expectation of seamless vision across tasks and over time.
To summarise, visual satisfaction is driven by much more than visual acuity alone and encompasses visual endurance as well as many aspects of functional vision (Figure 3).
Key Insights
- Our visual system is challenged by multiple tasks and situations over the course of the day
- Vision satisfaction can fluctuate throughout the day and with different tasks
- Vision satisfaction is driven by spatial awareness, discriminating efficiency and visual endurance
- Many soft contact lens wearers report fluctuating and declining overall satisfaction during the day
- Snellen visual acuity alone may not be a good indicator of vision satisfaction in contact lens wear
- New metrics and in-depth assessment are needed to elicit vision satisfaction in contact lens wear
- Future soft contact lens products should be designed to help address the unmet need for visual endurance over the course of the day
Conclusions
Vision satisfaction is influenced by three dimensions: spatial awareness, discriminating efficiency and visual endurance. Visual acuity alone does not provide a full picture since vision satisfaction relates not only to functional vision but to changing tasks and environments that are challenging our visual system more than ever. As we have seen, contact lens products are not fully satisfying patients’ visual needs, particularly as wearers go through their busy days and experience many different activities.
It is in the area of visual endurance that clinicians currently have the potential to make the biggest impact on patients’ visual satisfaction. Best practice currently would be to ensure that a contact lens accurately corrects the refractive error, including any astigmatism; ensure that the fit is stable and that the optical quality of the lens is optimal. It is very important that the material can support a stable tear film over the course of a long day.
Currently, vision and comfort are the principal measures we use to assess the performance of the lens, and Snellen visual acuity is the usual method of assessing vision. In the future, we may need to consider a wider range of vision metrics, assess visual symptoms in greater depth, and find new ways of monitoring performance across the course of a day’s wear, if we are to help satisfy our patients’ visual needs.
There is also an opportunity for further contact lens innovation to enhance visual performance and drive greater levels of patient-reported visual satisfaction. We look to the future where these needs are fulfilled through advanced designs that may be more adapted or specialised for particular applications.
Philippe Jubin is senior manager Lens Design, John Buch, OD, MS, FAAO is principal research optometrist and Derek Nankivil, BSAE, MSBME, PhD is staff engineer Vision Products at Johnson & Johnson Vision.
This publication is based on the article ‘The Three Dimensions of Vision Satisfaction’ that appeared in the April 2018 issue of Contact Lens Spectrum and is used with permission by PentaVision LLC.
References
- El-Gasim M, Munoz B, West SK et al. Associations between self-rated vision score, vision tests, and self-reported visual function in the Salisbury Eye Evaluation Study. Invest Ophthalmol Vis Sci 2013;54:9 6439-6445
- Rosenfield M. Computer vision syndrome: a review of ocular causes and potential treatments. Ophthalmic Physiol Opti 2011;31:5 502-515
- Kooi FL and Toet A. Visual comfort of binocular and 3D displays. Displays 2004;25:2 99-108.
- Digital eye strain report, Vision Council of America, 2015
- Iribarren R, Fornaciari A and Hung GK. Effect of cumulative nearwork on accommodative facility and asthenopia. Int Ophthalmol 2001;24: 205-212
- Bailey IL. Visual acuity. In: Benjamin WJ (Ed). Borish’s Clinical Refraction. 2nd ed. St. Louis: Butterworth Heinemann 2006. p217-246
- Bababekova Y, Rosenfield M, Hue JE et al. Font size and viewing distance of handheld smart phones. Optom Vis Sci 2011;88:7 795-7
- Birnbaum MH. Optometric Management of Near Point Disorders. Boston: Butterworth-Heinemann 1993. p121-160
- Sheedy JE and Parsons SD. The visual display terminal eye clinic: clinical report. Optom Vis Sci 1990;67:622-6
- Sheedy JE. Vision problems at video display terminals: a survey of optometrists. J Am Optom Assoc 1992;63:687-692
- Endsley MR. Theoretical underpinnings of situation awareness. In: Endsley MR and Garland DJ (Eds). Situation Awareness Analysis and Measurement. Mahwah, NJ: Erlbaum, 2000. p1-21
- Savino PJ and Danesh-Meyer HV (Eds). Color Atlas and Synopsis of Clinical Ophthalmology, Wills Eye Institute, Neuro-ophthalmology. Lippincott Williams & Wilkins, 2012
- Schneck ME and Dagnelie G. Prosthetic vison assessment. In: Dagnelie G (Ed), Visual Prosthetics: Physiology, Bioengineering, Rehabilitation. Springer Science & Business Media, 2011. p385-412
- Swartz S. Visual Perception: A Clinical Orientation. McGraw Hill Professional, 2009.
- Ferris SH. Motion parallax and absolute distance. J Exp Psychol 1972; 95:2 258-263
- Swanston MT, and Gogel WC. Perceived size and motion in depth from optical expansion. Percept Psychophys 1986;39:5 309-326
- Howard IP. Perceiving in Depth. Volume 2: Stereoscopic Vision. Oxford University Press, 2012
- Jenkins FA and White HE. Fundamentals of Optics. McGraw-Hill Book Company, 1976
- Luo MR (Ed). Encyclopedia of Color Science and Technology. Springer Reference, 2016
- Hansen T and Gegenfurtner KR. Color contributes to object-contour perception in natural scenes. J Vis 2017. Mar 1;17:3 14
- Turano K and Wang X. Motion thresholds in retinitis pigmentosa. Invest Ophthalmol Vis Sci 1992;33:8 2411-2422
- Rao SB and Simpson TL. Impact of blur on suprathreshold scaling of ocular discomfort. Invest Ophthalmol Vis Sci 2015;56:2304-2311
- Koffler M, Raskin P, Geyer O et al. Blurred vision: an overlooked initial presenting symptom of insulin-dependent diabetes mellitus. Isr J Med Sci 1990;26:7 393-394
- Koh S. Mechanisms of visual disturbance in dry eye. Cornea 2016;35 Supp1:S83-S88.
- Montés-Micó R, Alió JL, Muñoz G et al. Postblink changes in total and corneal ocular aberrations. Ophthalmology 2004;111:4 758-67
- Koh S, Maeda N, Hirohara Y, Mihashi et al. Serial measurements of higher-order aberrations after blinking in normal subjects. Invest Ophthalmol Vis Sci 2006;47:8 3318