Just as lissamine green has origins in industry (Optician 1.6.18), fluorescein is a synthetic molecule developed to see whether the Danube and Rhine rivers were connected.1,2 It has since had application in identifying macroscopic features, for example in geology in studying volcano formation. Its first use in eye research was to look at defects on the corneal epithelium in the 1880s3 and then in retinal angiography in the 1960s4 and is used to study cerebrospinal fluid leakage.5 It is also used as a refrigerant, as a marker in automobiles to look for leaks and in forensic science. And, if that was not enough, fluorescein has been added to the rivers in Boston on Saint Patrick’s Day as part of the Irish celebrations.
Fluorescence
Fluorescence is the emission of light by a substance that has absorbed light or other electromagnetic radiation. It is a form of luminescence. In most cases, the emitted light has a longer wavelength, and therefore lower energy, than the absorbed radiation. A good example to illustrate this is the absorption of ultraviolet light, normally invisible to the eye, which may excite some surfaces to emit light of a longer wavelength which, now in the visible spectrum, may be seen by the human eye. Fluorescein absorbs most light in the blue spectrum but emits longer wavelength light in the yellow and green spectrum.
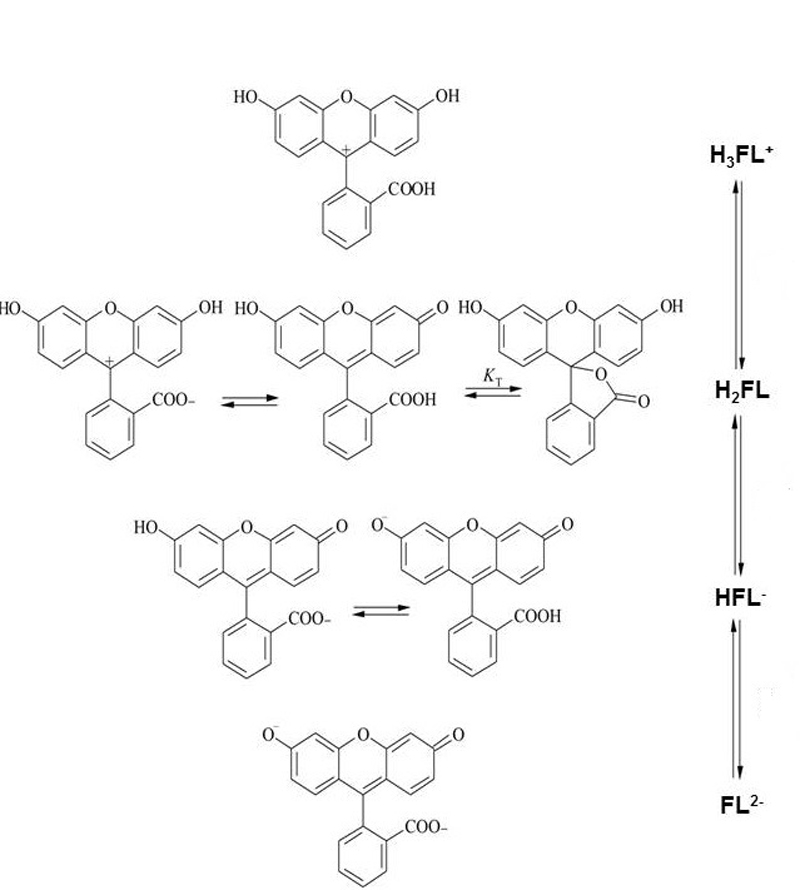
Figure 1 The various forms of fluorescein molecule
Molecular Properties of Fluorescein
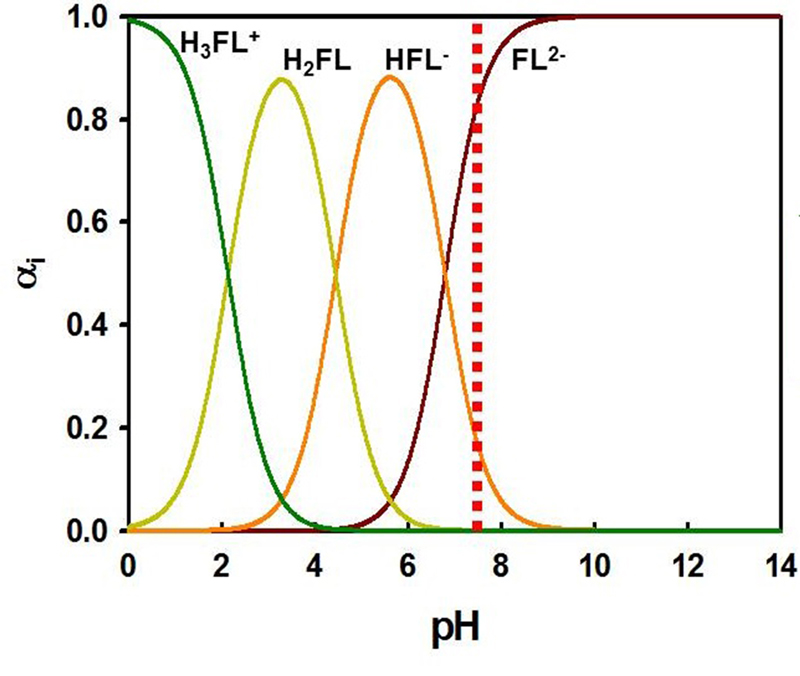
The molecule exists in several forms (figure 1) and the form that is present in any solution depends on a number of factors, the most important of which is pH (figure 2). Assuming a corneal epithelial pH of 7.8, then about 80 per cent of the fluorescein molecules to be found here are in the di-anionic form, the other 20% in the mono-anionic form. Importantly, even small changes in the pH will have a significant impact upon the fluorescence properties of the molecule.
Figure 2 Molecular structure of fluorescein with different pH values. The dotted line represents the pH at the corneal epithelial surface
The disodium salt (termed sodium fluorescein) is an orange/red crystalline powder which has the chemical formula C20H10O5Na2. Its molar mass is 376 and its solubility in water at 15.8C is 50%; in comparison, sodium chloride at the same temperature has a solubility of about 30% in water.6 It is as sodium fluorescein that the dye is used in clinical practice.
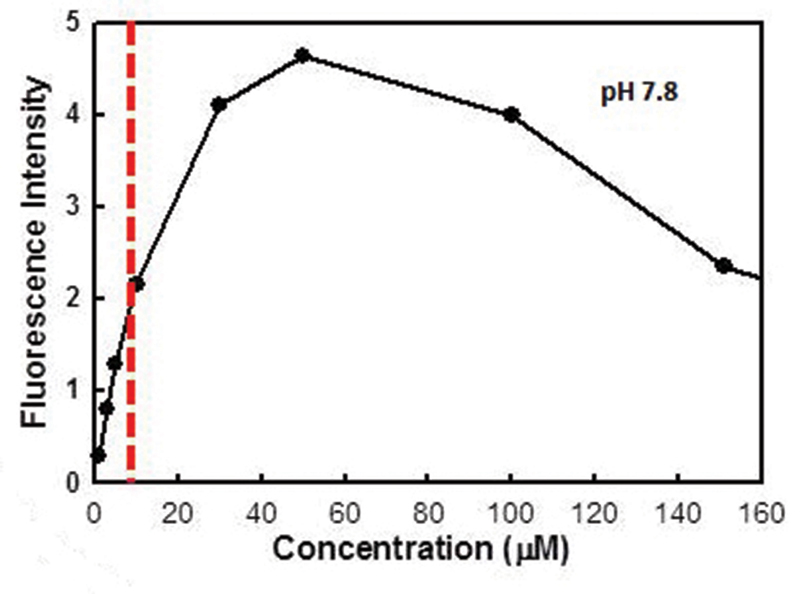
Figure 3 Change in fluorescence with concentration. Note the decrease in fluorescence beyond a certain concentration, known as quenching
Factors Affecting Fluorescence
pH
Clinically, it is possible that differences in local pH across the ocular surface can give rise to different levels of fluorescence intensity. In acidic conditions, the spectral output moves towards the blue end of the spectrum; at alkaline pH, the fluorescence has a more yellowish appearance. At typical ocular surface pH levels (between pH 6.5 and 8), the colour of fluorescence remains constant and is seen in its familiar green appearance.7
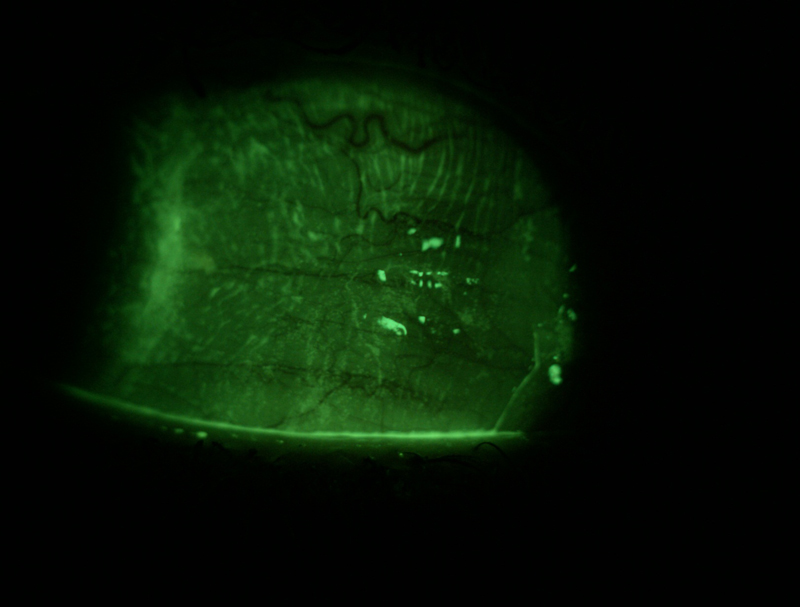
Figure 4 Fluorescein appears brighter where it is present in increased thickness, such as the tear meniscus and conjunctival folds
Concentration
Fluorescein has high visibility at even low concentrations, which is one reason why it has such useful clinical potential (figure 3). The intensity with which the molecule fluoresces increase up to around 0.001% concentration. Above this, the fluorescence decreases and this reduction in intensity at higher concentrations is sometimes called ‘quenching’. Practitioners will be familiar with this from their experience of using more saline to dilute the tip of a fluorescein-impregnated strip to allow better fluorescence of the instilled dye. Concentration also impacts upon the colour of the fluorescence, and higher concentrations, such as at first instillation, will tend towards yellow while the lower concentrations subsequently seen at the ocular surface will appear much greener.
Thickness
Thicker pockets of fluorescein, such as in the tear meniscus or within folds of the conjunctiva, will appear brighter than thinner layers, such as within the pre-corneal tear film (figure 4).
Excitation wavelength
The peak emission from fluorescein is achieved with exciting light at about 495 nm.8 Rachel Peterson examined the performance of a range of different slit lamp biomicroscopes when examining tear film fluorescence.9 They found that most slit lamps, when used with the blue filter in place, emitted a range of wavelengths peaking at about 450 nm, suggesting that most slit lamps provided sub-optimal levels of fluorescein intensity. Two of the instruments she looked at offered emission spectra much closer to the desired 495 nm and, as such, the intensity of emitted fluorescence was greater. Greater standardisation of blue filters has been adopted in modern slit lamp design.
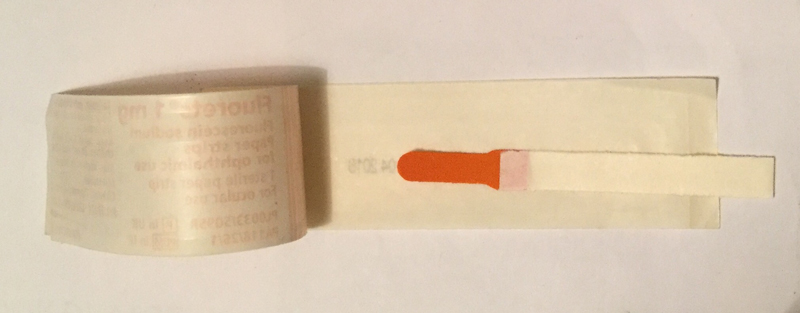
Figure 5 An impregnated fluorescein strip
Clinical Formulation
Fluorescein availability as a multidose solution is not advisable as it is well known to be susceptible to contamination by a range of pathogens, in particular Pseudomonas spp. It is available in solution in single dose Minim form (B&L) as either a 1% or 2% concentration, but the higher concentration at initial delivery causes quenching and peak fluorescence may take as much as four minutes from initial application. For this reason, along with other considerations such as waste and expense, minim use tends to be confined to ophthalmology clinics for use when assessing traumatic abrasion or foreign body location.
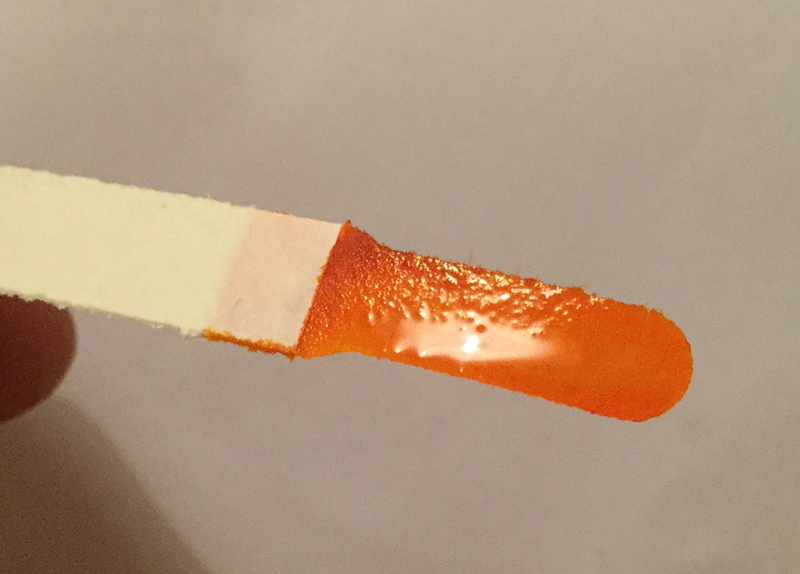
The formulation most used in eye care practice is a fluorescein-impregnated strip (figure 5). This requires the application of a solvent, usually sterile saline, to the impregnated tip and it is important to remember that too great an amount of saline will result in what Peterson termed a ‘saturated fluoret’ (figure 6) which will result in a delay in fluorescence not dissimilar to that of a drop from the single dose unit. Faster fluorescence occurs when the fluorescein strip is shaken to remove excess saline before application.9
Figure 6 A saturated tip
Viewing Fluorescein
Fluorescein has a peak excitation wavelength of 495 nm, whereas the commonly used ‘cobalt blue’ light filters of many slit lamp biomicroscopes have a peak of around 450 nm, as already mentioned. The fluorescence peak is around 515 nm within the pH range of the tear film, so a yellow barrier filter is required for optimum observation and should band pass at around 500 nm.9 The yellow filter will absorb blue light but transmit the longer wavelengths of the ocular surface under view and so maximise the fluorescence and contrast of the tissues under view (see figure 7).
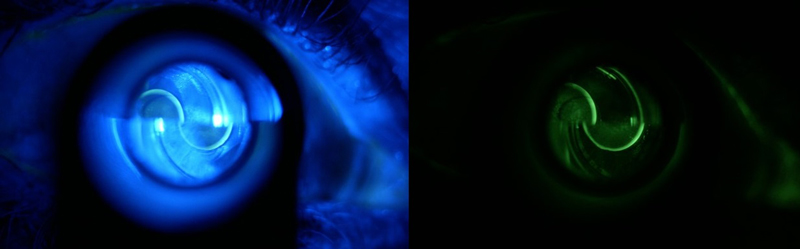
Figure 7 Epithelial damage after contact tonometry viewed under blue light (a) and through a yellow filter (b)
a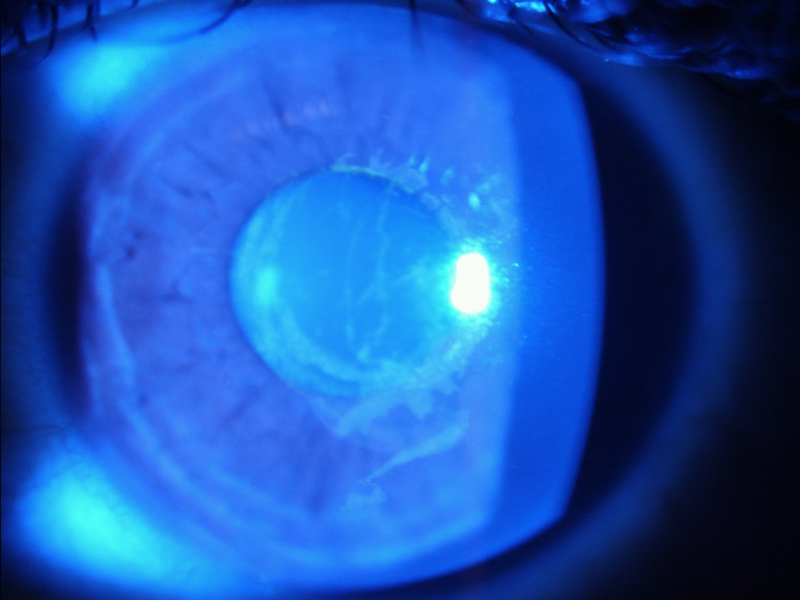
b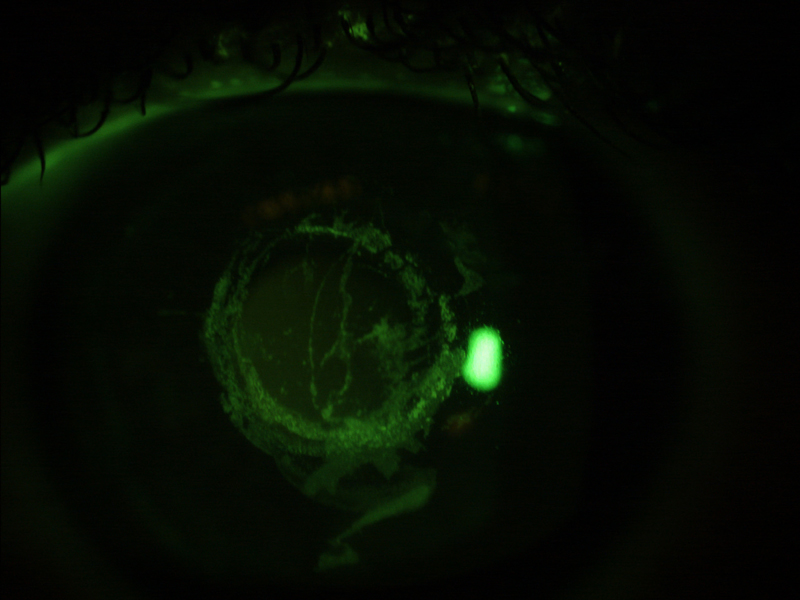
Clinical Applications
Tear quality
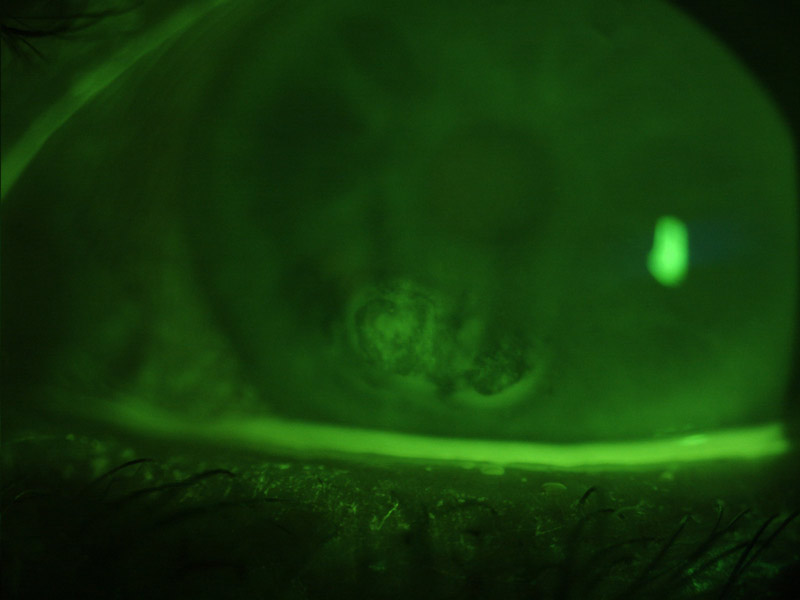
Sodium fluorescein may be instilled to enhance visibility of the tear film, when the test is referred to as the fluorescein breakup time (FBUT). The dye is introduced and, after the patient is asked to blink, the time (in seconds) is recorded for the even surface of the tear film to become disrupted, seen as non-fluorescing areas (figure 8).
Figure 8 Assessment of the fluorescein break up time – darker pockets show the tear film disruption
A problem with the FBUT is that fluorescein reduces the stability of the tear film and therefore the measurement may not be an accurate reflection of its status.10 Since controlling the volume instilled with strips may be difficult, the use of narrow (1 mm) strips and dry sterile applicators have been proposed.
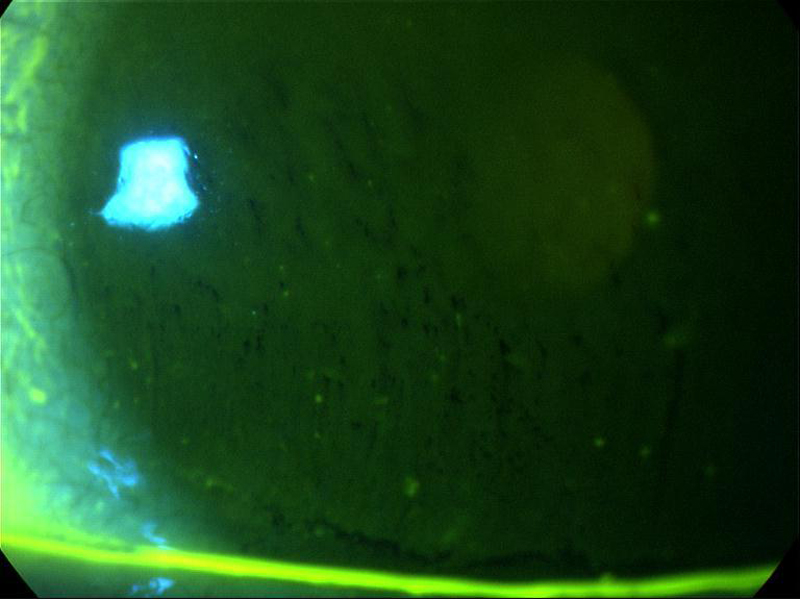
Figure 9 Fluorescein helping to delineate surface irregularity due to scarring
A standardized methodology is also important and instructions are generally given to blink naturally three times and then to cease blinking until instructed. The reference value for DED diagnosis when fluorescein is used ranges from a cut-off time of less than 10 seconds, to less than five seconds when smaller, more controlled volumes of fluorescein are used.10
Surface quality
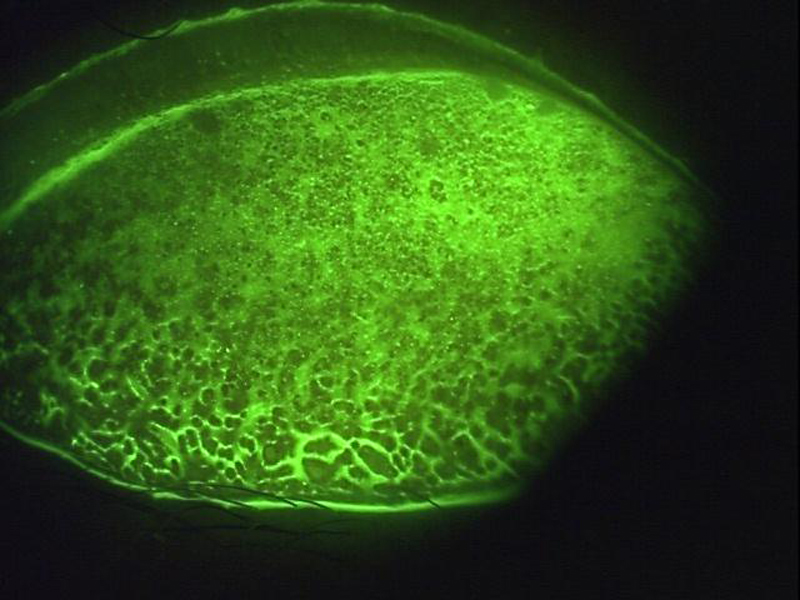
The accumulation of fluorescein in recesses where its higher concentration will appear brighter makes it useful for assessing surface irregularities, such as of a scarred cornea (figure 9) or the palpebral conjunctiva in a papillary response (figure 10).
Figure 10 Papillary response of the palpebral conjunctivae highlighted by accumulation of fluorescein
Staining
The appearance of any stain helps to decide on the underlying cause. A randomised punctate staining is indicative of a generalised epithelial compromise, as might happen with a toxic response to an external agent (perhaps an unsuitable contact lens solution) or as an indicator of tear film compromise. It is worth remembering, however, that the degree of surface staining is a poor indicator of the severity of dry eye disease.10 Figure 11 shows a schematic representation of some typical staining patterns and their underlying cause.
Figure 11 Schematic representation of some typical staining patterns. A – ‘smile’ stain indicative of desiccation; B superior epithelial arcuate lesion of possible mechanical origin; C foreign body tracking; D interpalpebral desiccation or ‘3 and 9 o’clock’ stain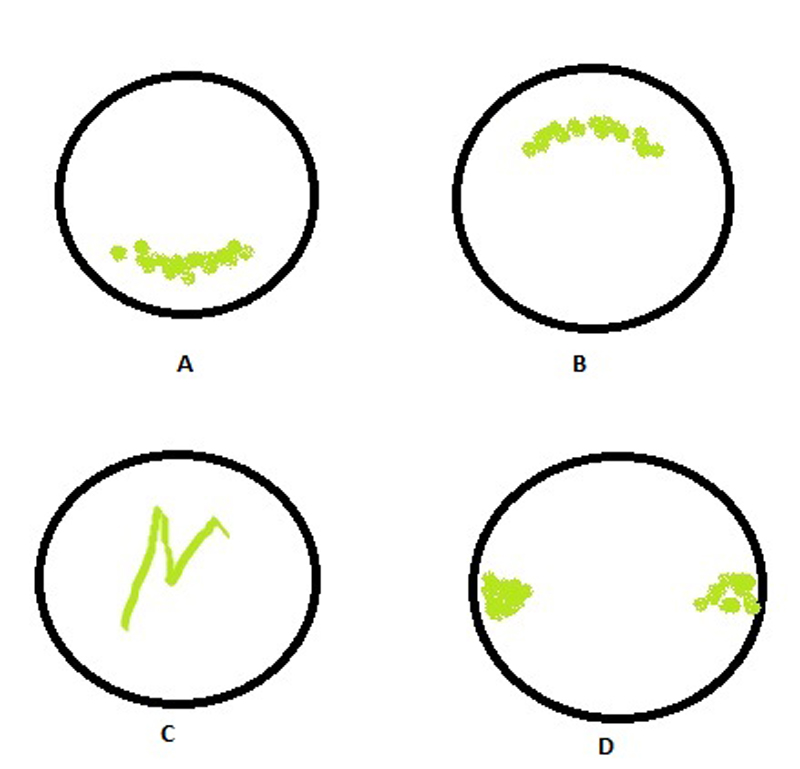
Contact tonometry
In order to align the edges of the superior and inferior menisci formed around the end of the Goldmann prism when applanating the cornea (and so representing the edges of the applanated surface), fluorescein heightened their visibility and makes the process easier. This author advocates the use of a yellow filter to improve the appearance further, especially when first learning the technique (figure 12).
Figure 12 View of applanated cornea through a Goldmann prism highlighted by fluorescein
Seidel’s test
The Seidel test is used to detect any perforation of the cornea and exploits the change in behaviour of fluorescein on dilution. A perforation allows aqueous fluid to leak into the precorneal tear film and, as such, will dilute any fluorescein present and cause an increased fluorescence around the leakage site.
Jones tests
Now little used, the Jones test involves looking for residual fluorescein after application to an eye suspected of having blocked tear drainage or outflow. It requires use of a cotton bud at the inferior nasal meatus (Jones I) of within the nostril cavity (Jones II) a little while after instillation. It is sometimes useful for very small children who show excessive epiphora.
Legal Use
In 2012, Bausch & Lomb withdrew the only UK licensed fluorescein impregnated strip from the market. This means practitioners have to now use strips which are not licensed in the UK as a medicine, but are CE-marked as medical devices. To quote the Association of Optometrists: ‘In response to lobbying from the profession, the Medicines & Healthcare products Regulatory Agency (MHRA) has permitted the supply of CE-marked medical device fluorescein strips to the UK market until its status has been agreed by the EU2. If the EU working group don’t classify them as medical devices we will lobby to have the current exemption extended and encourage a manufacturer to licence their product. Our medical malpractice insurance will cover members who follow this advice.’12
Summary
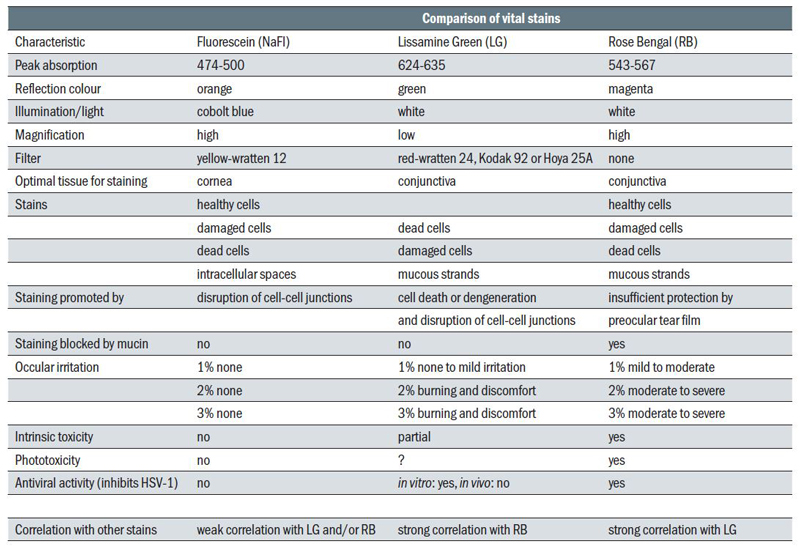
Table 1 summarises some properties of fluorescein as compared with lissamine green and rose Bengal.
Table 1 Comparison of dyes used in eye care11
References
- Knop, A. Neues Jahrbuch für Mineralogie, Geologie und Paläontologie. E Schwiezerbart, Stuttgart, (1878), 350–363.
- Hötzl, H. Environ. Geol. (1996), 27, 87.
- Pfluger, E. Klin Monatsbl Augenheilkd 1882, 20, 69.
- Novotny, HR; Alvis, DL. Circulation 1961, 24, 82.
- Seth, R. Otolaryngology. Head Neck Surg. 2010, 143, 626
- Romanchuk KG, Fluorescein. Physiochemical factors affecting its fluorescence. Surv Ophthalmol 1982;26:269–83.
- PB Morgan, C. Maldonado-Codina. Corneal staining: Do we really understand what we are seeing? Contact Lens & Anterior Eye 32 (2009) 48–54.
- Wang L, Gaigalas AK, Abbasi F, Marti G, Vogt RF, Schwartz A. Quantitating fluorescence intensity from fluorophores: practical use of MESF values. J Res Natl Inst Stand Technol 2002;107.
- Peterson RC, Wolffsohn JS, Fowler CW. Optimization of anterior eye fluorescein viewing. Am J Ophthalmol, 2006;142:572–5.
- Wolffsohn J et al. TFOS DEWS II – diagnostic methodology report. The Ocular Surface 15 (2017) 539-574
- Retallic N, Farrant S. Dyes and stains – part 1. OPTICIAN 01.06.2018.
- www.aop.org.uk/advice-and-support/policy/position-statements/fluorescein (viewed 01/10/18)