Technological improvements and developments
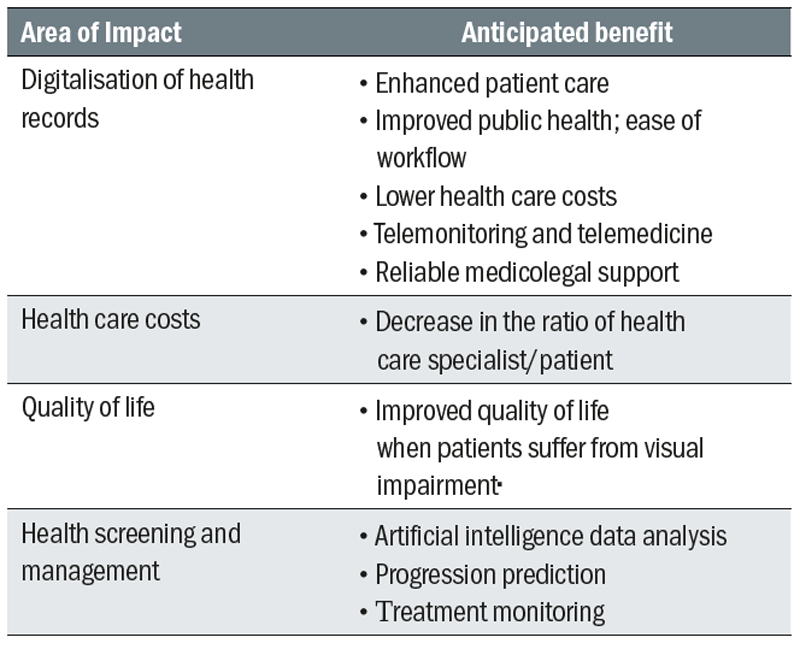
Medical technologies save lives, improve health and contribute to sustainable healthcare. The benefits of the increasing availability of advanced technology for those working in daily practice are for both practitioners and patients and are summarised in table 1.
The increasing need for reliable, accurate, commercially available and reasonably priced technology to enhance screening and diagnosis methods becomes apparent when looking at the changing age distribution of common eye diseases in Europe (figure 1). Most of the patients over 40 years old seen by an eye care practitioner in day to day practice will likely develop at least one sight threatening eye conditions as they get older. To prevent these diseases forcing patients into an early exit from the world of employment, it is essential to confirm pathological changes to the ocular system at the earliest stage. Technology has made significant inroads in early disease detection. Furthermore, new technology has also improved our ability to monitor the effectiveness of pharmaceutical and other medical interventions.
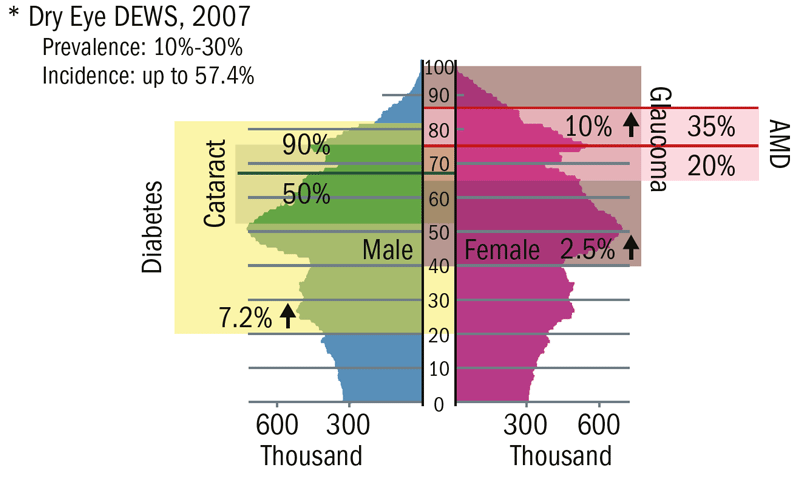
Figure 1: A schematic representation of the increasing prevalence (percentage at any one time) and incidence (number of new confirmed cases in a set time) with age and gender for some common eye diseases in Europe.
Intraocular pressure
Glaucoma is the second most common cause of blindness in the world and describes a heterogeneous group of ocular diseases defined by the slow but progressive loss of retinal ganglion cells and their axons.¹ Glaucoma is a multifactorial disease and is further sub-divided into a number of different groups. Increased intraocular pressure (IOP) is noted in most forms of glaucoma, but is not part of the definition.² In some glaucoma patients, increased IOP cannot be detected at any time (normal tension glaucoma), and elevated IOP does not necessarily lead to glaucoma (ocular hypertension). About 10% of the population aged over 40 years has an elevated IOP of >21 mmHg and this is considered to be a risk for the development of glaucoma.²
Early detection of glaucoma, by regularly measuring the IOP, is essential to prevent blindness. Due to the difficulty in the assessment of the many various clinical diagnostic parameters, however, the disease is usually detected very late. At the time of diagnosis, most patients have been suffering from the disease for over 10 years, and up to 50% of retinal ganglion cells are already dead when the first pathological changes in the visual field are perceived.³ In addition, several different epidemiological studies have shown that at least half of existing glaucoma patients remain undiagnosed.4
The IOP is established and maintained as a result of the constant formation and drainage of the aqueous humour. It provides the shape and stability of the globe and thus maintains the optical and metabolic integrity of the eye. In a study of a cohort of 10,000 patients conducted by Leydhecker et al, the mean IOP was stated to be 15.5mmHg (+/- 2.57).5 The study concluded that eyes with an IOP of over 20.5mmHg can be considered as suspicious regarding potential glaucomatous change and eyes with an IOP above 24mmHg as pathological. More recently, the Salzburg-Moorfields-Collaborative-Glaucoma-Study found similar values of 15.6 mmHg (+/- 2.9).6
In modern optometric practice, it is no longer an aim to achieve any one specific IOP level; instead clinicians try to achieve a so-called target IOP which is individual and unique to each patient.2,7,8 The European Glaucoma Society (2014) guidelines defined the target IOP as ‘[...] an estimate of the mean IOP obtained with treatment that is expected to prevent further glaucomatous damage.²
Goldmann Applanation Tonometry
The best accepted method for evaluating the IOP in practice is still Goldmann applanation tonometry (GAT), which was first described in the 1950s9 and continues to be the ‘gold standard’ for IOP measurements (figure 2).10
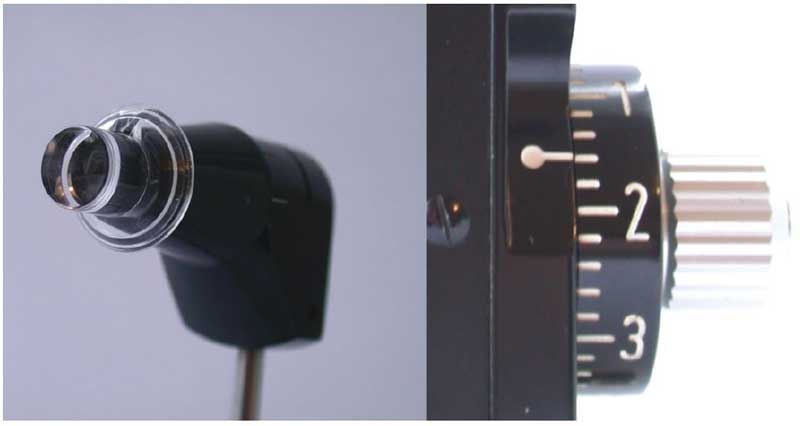
Figure 2: GAT is still the ‘gold standard’ for clinical IOP measurements
GAT is based upon the Imbert-Fick law, which assumes that the eye is a perfectly spherical physical body composed of an infinitely thin, elastic, dry and flexible membrane. Based on these assumptions, it is inferred that the pressure inside the container is equal to the force needed to applanate a given surface area. Goldmann designed GAT to negate the problems of ocular rigidity encountered when determining IOP.
The Goldmann was the first variable force applanation tonometer, where the instrument measures the amount of force needed to flatten a known area. The force applied must be increased until a corneal diameter of 3.06mm is applanated. It is this force that is taken as indicative of the IOP. Goldmann reported that, when the applanation diameter was between 3 to 4mm, the surface tension of the tear film (which pulls the tonometer head towards the eye) would be equal to the opposing force due to the inherent rigidity of the cornea.10
Despite being the ‘gold standard’ tonometric device, there are several factors to consider when using GAT. In particular, consideration needs to be given to the fact that the human eye does not conform to the assumptions of the Imbert-Fick law, namely:
- The eye is not a sphere with an infinitely thin membrane, but mechanically a shell body with significant internal bending stresses
- The surface tension of the tear film (as well as the anaesthetic drops applied during the procedure) exert a variable adhesive force on the applanation tonometer head
- During applanation, there is a change in aqueous humour volume in the area of the flattened cornea which influence internal pressure
Depending on the measurement method (area dependent or independent), the individual variables in determining the IOP using GAT vary significantly. According to the force balance, it is shown that with the use of GAT it is not a measure of physical pressure but rather a force which produces a state of equilibrium.11
Non-Contact Tonometry
Non-contact tonometry (NCT) utilises a defined jet of compressed air to applanate the cornea (figures 3 and 4). The non-contact method has distinct advantages in that it does not require repeated disinfection, corneal anaesthesia, and minimises any risks associated with contact procedures.12 13 Furthermore, the duration of the air puff is approximately 15ms, so the measurement period is faster than the blink reflex. The latency time of the normal blink reflex is approximately 30ms.14 It is assumed that the jet of compressed air has a ramped characteristic. The total pressure exerted by the air puff is the sum of static and dynamic pressures of the compressed airflow.
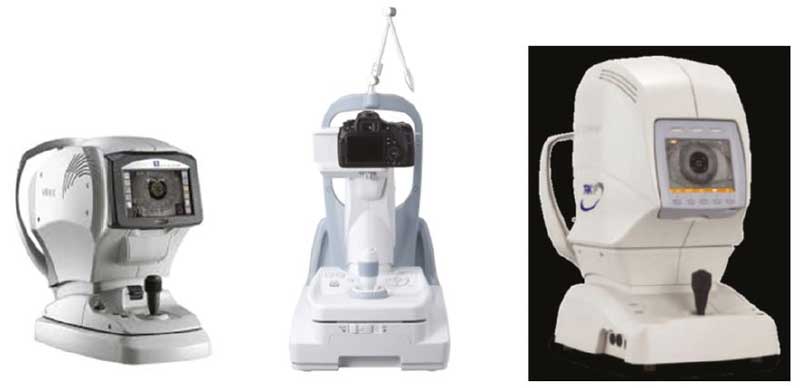
Figure 3: Some desk-top non-contact tonometers
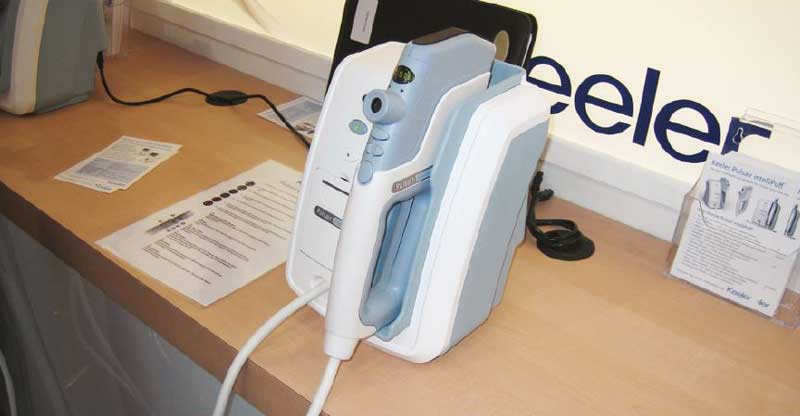
Figure 4: Hand-held non-contact tonometer
During NCT, the cornea is applanated by the increasing airflow pressure. As the force is applied, the corneal curvature flattens. During the measurement, a point is reached when the airflow pressure is greater than the opposing force from the eye; at this point, the cornea moves from being a convex shape to a concave form. The airflow pressure at this point is considered the reference value for determining the IOP. The IOP is derived via a linear calibration equation for this specific airflow pressure. Following deformation, the airflow pressure decreases and the cornea returns to its convex baseline shape (figure 5).
In contrast to GAT, the pressure application time during NCT is relatively short, with GAT in the range of several seconds depending on the experience of the clinician and NCT approximately 20 to 30ms. Therefore, when using NCT, the process is no longer a quasi-static but a very dynamic process.
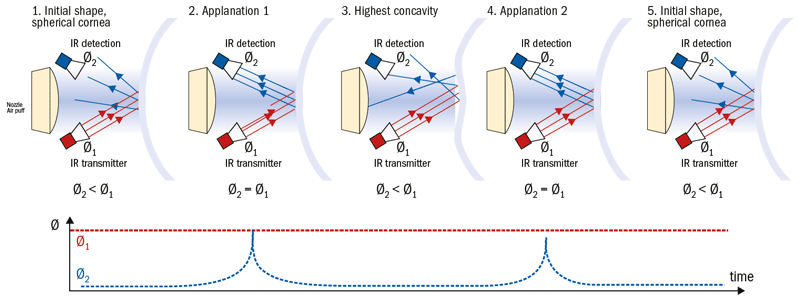
Figure 5: Deformation-dependent reflection of the infrared light (IR) beam (radiation flux Ø1=emitted IR, Ø2=reflected IR) on the eye during NCT: 1 and 5) initial convex baseline state of the cornea, 2 and 4) applanation point and 3; concave deformation state
In order to detect the maximum applanation point of the cornea, the optical properties of the corneal geometry are exploited. A transmitter emits a beam of infrared light that is focused on the cornea, and an optical sensor detects the reflected light. The characteristics of the reflected light are dependent upon the corneal geometry. During the applanation process, the intensity of the reflected light beam changes with the curvature of the cornea; the highest intensity is detected when the cornea is in the flat, mirror-like, applanation state (figure 5).
The major disadvantage of NCT is that it samples the IOP within a short period of time (approximately 19ms) and thus fails to account for the oscillations in IOP caused by the cardiac and respiratory cycles. As such, a single measure of IOP may correspond to the peak, middle or trough of the oscillations, and this consequently reduces the precision with which the true IOP is measured. Another disadvantage is its reliance on the quality of the tear film and corneal regularity, both of which affect the reflectivity of the light required in the tonometric procedure.
Tonometry and Corneal Biomechanics
A significant disadvantage of most tonometers is the inability to assess the corneal biomechanical properties that are likely to influence the IOP measurements. As with GAT, biomechanical properties of the cornea, such as central corneal thickness (CCT), curvature, rigidity and hydration, all have a significant influence upon NCT.15,16,17 Additionally, as NCT relies upon the dynamic changes in corneal curvature to determine the IOP, consideration also needs to be given to biomechanical properties relating to damping and inertia.
Most biological tissues exhibit viscoelastic characteristics, demonstrating a time-dependent stress-strain behaviour of the rate of deformation or elongation and preload. In the past, corneal biomechanics have been assessed by several different measurement principles. Of these, the in vivo biomechanical metrics derived during non-contact tonometry are the most studied. The Ocular Response Analyzer and Corvis ST are both instruments based upon the principle of corneal applanation with a defined air puff.
Ocular Response Analyser
The Ocular Response Analyser or ORA (Reichert Technologies) provides a non-invasive measurement of IOP (figure 6). The device utilises an air puff of approximately 300m/s for approximately 20 ms to applanate the cornea (figure 7).
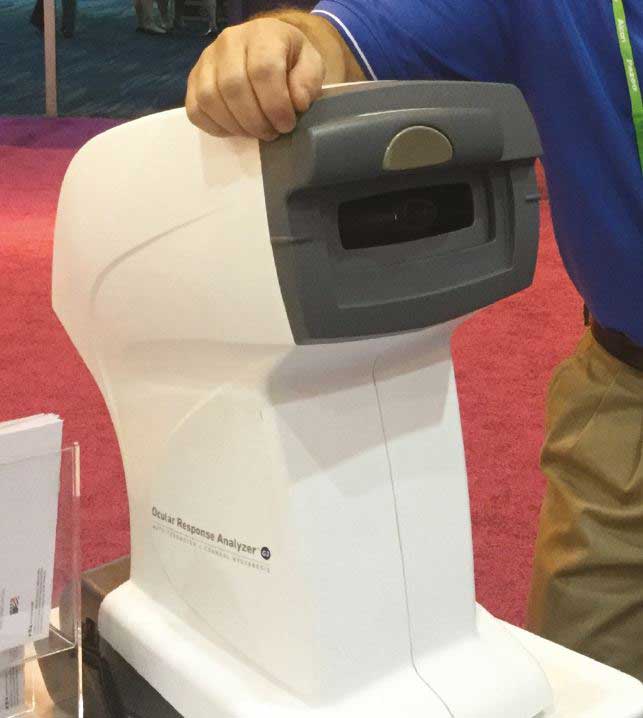
Figure 6: The Ocular Response Analyser
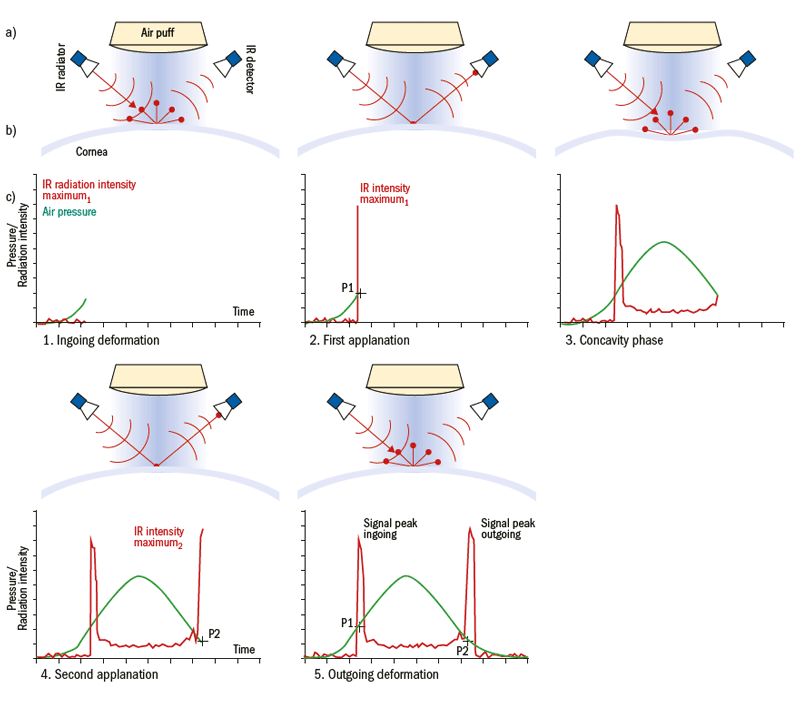
Figure 7: Measurement principle of the ORA; a) The top scheme shows the IR light radiator and the optical detector that is right angled to the beam, as well as the air puff generator and the air puff. b) Corneal profile images during the measurement. c) ORA waveform diagram shows the changes of air pressure (green) and detected IR intensity (red) during the five phases of measurement over time
It is assumed that the ORA determines the IOP independent of the biomechanical properties of the cornea.18 During the measurement sequence, the ORA detects the intensity of the infra-red (IR) light reflected from the cornea. The temporal distribution of the detected IR radiation results in two distinct maxima, one during the first applanation and the second during the second applanation (figure 7). The difference between the first and the second IR radiation maximum is proposed as characteristic of corneal biomechanical properties. This has been suggested to represent mechanical properties relating to corneal damping.18,19,20,21
Corvis ST
The Corvis ST (CST) is an NCT combined with an ultra-high-speed Scheimpflug camera that captures the response of the cornea to an air puff in a short film sequence with 4330 frames per second (figure 8).22 A novel feature of the CST is that it provides high-resolution cross-sectional images of the cornea allowing real-time visualisation of the corneal deformation profile (figure 9). The integrated software provides metrics of corneal biomechanics, and are outlined in figure 10.
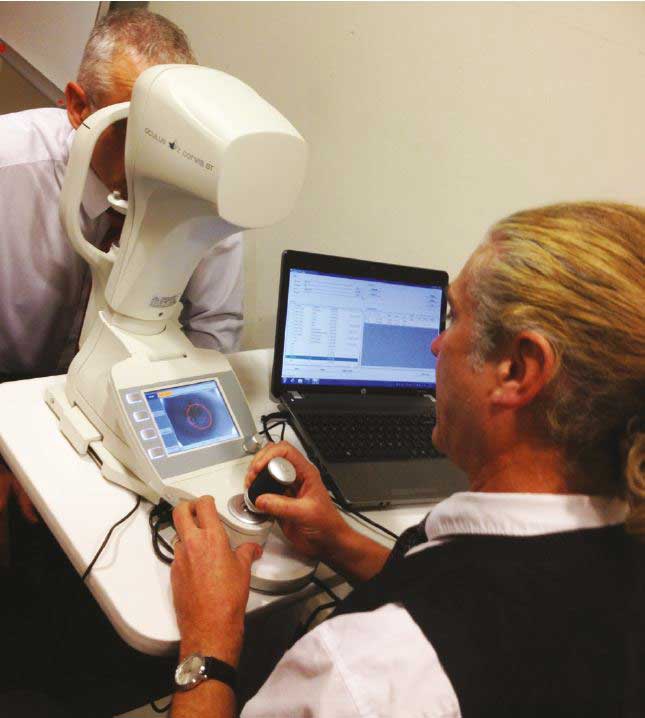
Figure 8: The Corvis ST
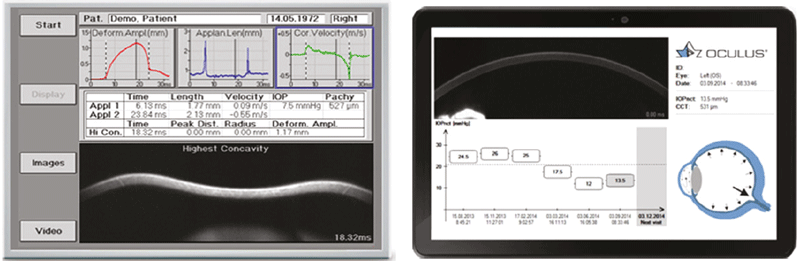
Figure 9: Examples of output from the CST
Rebound tonometry
One of the recent developments is the hand-held rebound tonometer (the iCare) introduced by Kontiola in 1997, which works on the principle of the recoil of a small probe (figure 11). 23
The probe has a length of 50 mm and a diameter of 1 mm and carries of a small plastic ball with a diameter of 1.4 mm (estimated mass of 0.25 g) at the top. A coil encloses part of the probe. After inserting the ferromagnetic probe, its rear part is magnetised within the device. This magnetic circuit also serves to accelerate the probe towards the cornea. When the probe hits the cornea, it is slowed down. The end of the probe remains within the coil so that the pre-magnetized part produces an induction voltage proportional to the temporal change of the magnetic flux according to Faraday's law. During measurement, among other things, the following movement parameters can be determined;
- duration of eye contact
- backward velocity of the measuring probe
- deceleration time.
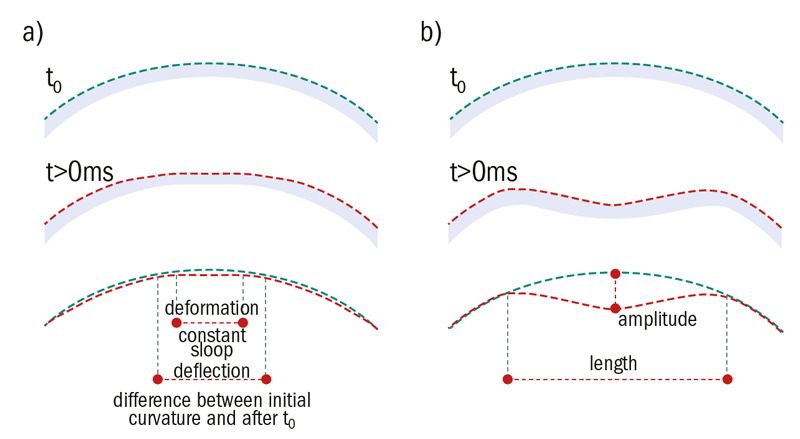
Figure 10: Schematic representation showing (a) deformation and deflection of the cornea at first point of applanation and (b) at highest concavity. The red line represents the curvature of the cornea after deformation (t>0ms), the green line the initial curvature (t = 0ms)
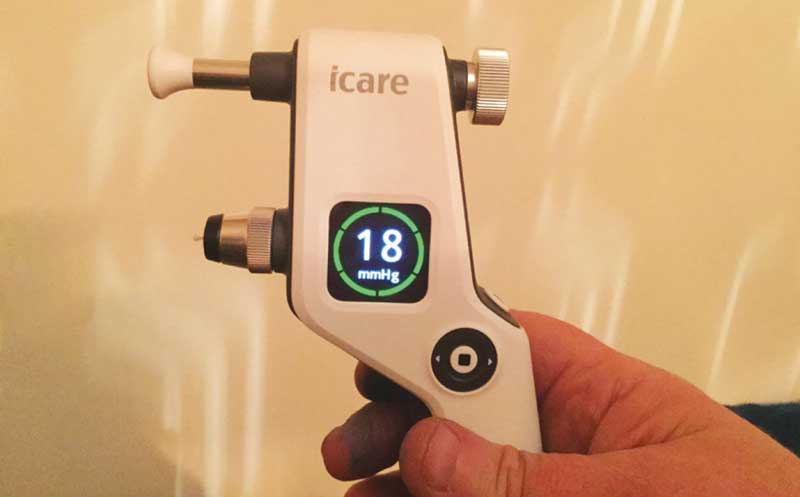
Figure 11: The iCare hand-held rebound tonometer
In a study conducted by Danias et al., it was found that the reciprocal of the deceleration time is the parameter which determines the IOP most approximate; the higher the IOP, the faster the deceleration time (figure 12).24
Despite the novel approach, the rebound concept has one major drawback; the clinician cannot directly view the anterior surface of the eye or the pupil because it is obscured by the device. This leads to non-reproducible measurement positions, which are also unlikely to be perpendicular to the corneal surface. The variability in corneal positioning of the measurement probe reduces the effective counterforce by the cosine of the angular offset (according to the underlying physical principles). At the same time, the probe experiences a force in the radial direction, which leads to increased friction in its storage and thus a reduction of the mechanical impulse.
The tear fluid creates an adhesion force on the probe25 and so changes in viscosity of the tear film are very likely to influence the derived IOP reading. Just as with GAT and (in particular) NCT, a dependence on the mechanical properties of the cornea is to be expected, since the decrease in backwards velocity of the probe is initiated by the contact with the corneal surface.25,26
Indirectly measured IOP vs real IOP
As the term indirectly measured IOP indicates, GAT, NCT and rebound tonometry all derive a patient’s IOP indirectly using basic physical principals and assumptions. A randomised ex vivo study assessed 45 porcine eyes, which were examined under controlled intraocular physical pressure (IPP) levels of between 25 and 135mmHg. IOP was measured at each IPP level using the ORA, CST and the iCare.27 One aim of the study was to investigate the relationship between the IPP (controlled manometric pressure) and the indirectly measured IOPs (figure 13).
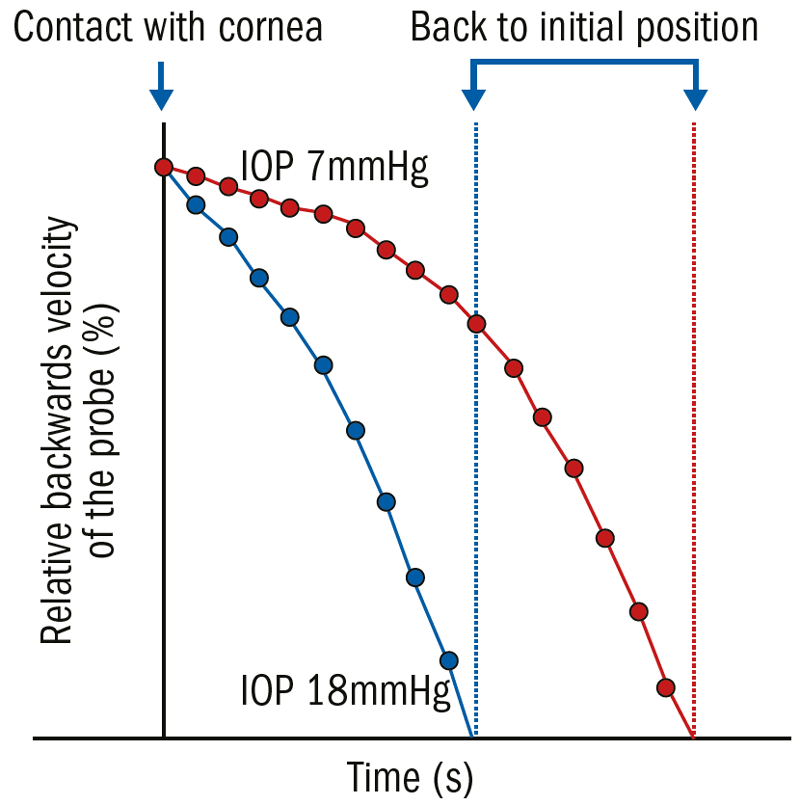
Figure 12: Rebound tonometry (iCare) measurement in one porcine eye (enucleated, IOP manipulation via manometry); the eye was connected to a manometer, and the IOP was elevated stepwise from 7 mmHg (red) to 18 mmHg (blue), and an iCare reading taken. The device’s probe was recorded with a high-speed camera perpendicular to the tonometer head and digitally tracked simultaneously. The backwards velocity of the probe was about 20% higher in the higher IOP
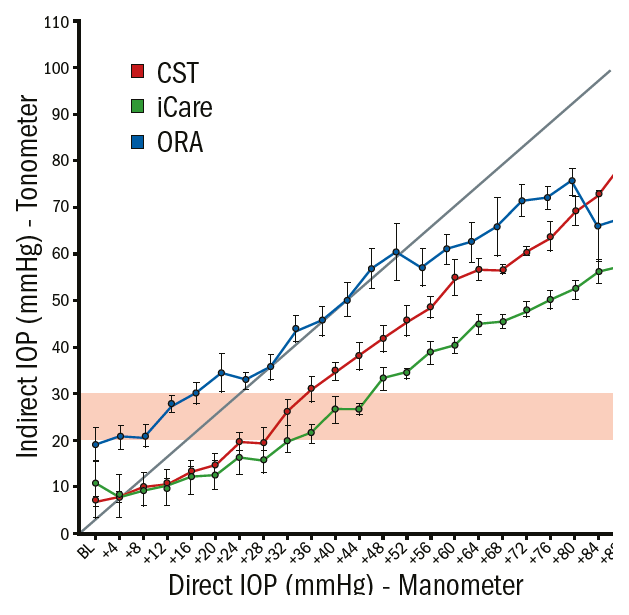
Figure 13: Graphical analyses (average and standard derivation) of the intraocular physical pressure (IPP) and the measured IOP using the CST (red), ORA (blue) and the iCare (blue) in enucleated porcine eyes. The straight dotted line represents the ideal relation between IPP and IOP; the horizontal pink area highlights the range of clinically suspicious IOPs
An ideal relationship between IPP and IOP would be linear, eg if the IPP was increased by +1 mmHg the measured IOP would also increase by the same magnitude (straight diagonal line in figure 13). None of the devices showed a linear relationship between IPP and IOP. Within the range of physiological IOP, the ORA overestimated the real IOP whereas the CST and iCare underestimated the physical pressure. In this study, the IPP needed to be increased by 3.6 mmHg (+/- 0.53) for the CST, the ORA by 3.4 mmHg (+/- 0.84) and the iCare by 2.6 mmHg (+/- 0.47) in order to measure +1 mmHg IOP change. These results show that a high amount of pressure increase inside the eye remains undetected by using indirect measurements.
The most accurate IOP measurement is performed by direct manometry, which involves cannulation (placing a manometer within the eye). This is, of course, impractical and the associated high risks make it clinically unacceptable as a routine procedure.11 As a far less invasive alternative, the IOP is commonly estimated using indirect measurement methods dependent upon the ocular surface.
Concluding Remark
All of the indirect techniques have common limitations in that their measured values might be affected by the dynamic changes in IOP and the biomechanical properties of the eye. Both of these will be considered in detail in the next part of this series.
Dr Daniela Oehring is based at the Faculty of Health and Human Sciences, Plymouth University.
References
- Quigley, H A & Broman, A T 2006. The number of people with glaucoma worldwide in 2010 and 2020. Br J Ophthalmol, 90, 262-7.
- European Glaucoma Society. 2014. Terminology and guidelines for glaucoma, PubliComm.
- Quigley, H A, Hohman, RM, Addicks, EM, Massof, RW & Green, WR. 1983. Morphologic changes in the lamina cribrosa correlated with neural loss in open-angle glaucoma. Am J Ophthalmol, 95, 673-91.
- Burr, JM, Mowatt, G, Hernandez, R, Siddiqui, MA, Cook, J, Lourenco, T, Ramsay, C, Vale, L, Fraser, C, Azuara-Blanco, A, Deeks, J, Cairns, J, Wormald, R, Mcpherson, S, Rabindranath, K & Grant, A. 2007. The clinical effectiveness and cost-effectiveness of screening for open angle glaucoma: a systematic review and economic evaluation. Health Technol Assess, 11, iii-iv, ix-x, 1-190.
- Leydhecker, W V, Akiyama, K & Neumann, H. 1958. Der intraokulare Druck gesunder menschlicher Augen. Klin Monatsbl Augenheilkd, 133, 662-670.
- Hitzl, W, Hornykewycz, K, Grabner, G & Reitsamer, H. 2007. Über den Zusammenhang zwischen Lebensalter und Prävalenz sowie Inzidenz des primären Offenwinkelglaukoms in der, Salzburg-Moorfields-Collaborative-Glaucoma”-Studie. Klinische Monatsblätter für Augenheilkunde, 224, 115-119.
- Palmberg, P. 2004. Evidence-based target pressures: how to choose and achieve them. Int Ophthalmol Clin, 44, 1-14.
- Singh, K, Spaeth, G, Zimmerman, T & Minckler, D. 2000. Target pressure--glaucomatologists' holey grail. Ophthalmology, 107, 629-30.
- Goldmann, H & Schmidt, T. 1957. Über applanationstonometrie. Ophthalmologica, 134, 221-242.
- Clemmensen, K & Hjortdal, J. 2014. Intraocular pressure and corneal biomechanics in Fuchs' endothelial dystrophy and after posterior lamellar keratoplasty. Acta Ophthalmol, 92, 350-4.
- Clement, C. I., Parker, D. G. & Goldberg, I. 2016. Intra-Ocular Pressure Measurement in a Patient with a Thin, Thick or Abnormal Cornea. Open Ophthalmol J, 10, 35-43.
- Britt, J. M., Clifton, B. C., Barnebey, H. S. & Mills, R. P. 1991. Microaerosol formation in noncontact 'air-puff' tonometry. Arch Ophthalmol, 109, 225-8.
- Grehn, F. 2012. Augenheilkunde, Springer.
- Shahani, B. 1970. The human blink reflex. J Neurol Neurosurg Psychiatry, 33, 792-800.
- Gräf, M. 1991. Zur Bedeutung der Hornhautdicke bei der non-contact-tonometrie. Klinische Monatsblätter für Augenheilkunde, 199, 183-186.
- Salvetat, M. L., Zeppieri, M., Tosoni, C., Felletti, M., Grasso, L. & Brusini, P. 2015. Corneal Deformation Parameters Provided by the Corvis-ST Pachy-Tonometer in Healthy Subjects and Glaucoma Patients. J Glaucoma, 24, 568-74.
- Steinberg, J., Mehlan, J., Frings, A., Druchkiv, V., Richard, G., Katz, T. & Linke, S. 2015. Pachymetrie und Augeninnendruckmessung mittels Corneal-Visualization-Scheimpflug-Technologie (Corvis ST). Der Ophthalmologe, 112, 770-777.
- Luce, D. A. 2005. Determining in vivo biomechanical properties of the cornea with an ocular response analyzer. J Cataract Refract Surg, 31, 156-62.
- Vantomme, M., Pourjavan, S. & Detry-Morel, M. 2013. The range of the waveform score of the ocular response analyzer (ORA) in healthy subjects. Bull Soc Belge Ophtalmol, 91-7.
- Luce, D. & Taylor, D. 2006. Reichert Ocular Response Analyzer measures corneal biomechanical properties and IOP - Provides new indicators for corneal specialties and glaucoma management. Reichert Ophthalmic Instruments.
- Luce, D. 2006. Methodology for cornea compensated IOP and corneal resistance factor for the Reichert Ocular Response Analyzer. Investigative Ophthalmology & Visual Science.
- Hon, Y. & Lam, A. K. 2013. Corneal deformation measurement using Scheimpflug noncontact tonometry. Optom Vis Sci, 90, e1-8.
- Kontiola, A. 1996. A new electromechanical method for measuring intraocular pressure. Doc Ophthalmol, 93, 265-76.
- Danias, J., Kontiola, A. I., Filippopoulos, T. & Mittag, T. 2003. Method for the non-invasive measurement of intraocular pressure in mice. Invest Ophthalmol Vis Sci, 44, 1138-41.
- Draeger, J., Schwenteck, T. & Ruokonen, P. 2006. Neue Trends in der Tonometrie. Klinische Monatsblätter für Augenheilkunde, 223, 796-801.
- Kontiola, A. I. 2000. A new induction-based impact method for measuring intraocular pressure. Acta Ophthalmol Scand, 78, 142-5.
- Oehring, D. 2018. Advanced Examination Techniques for the Anterior Eye. European Academy of Optometry and Optics. Pula (CR).