The measurement of intraocular pressure (IOP) is an important part of the full eye examination for a majority of patients. As well as providing useful baseline data for future examination of a patient’s eye, the measurement of intraocular pressure has important implications in screening for eye disease.
There is a well-established association between IOP and primary open-angle glaucoma. The insidious nature of the onset of this disease requires that an optometrist, with regular access to routinely examine a patient’s apparently healthy eyes, employ a variety of clinical techniques to assess ocular health. The measurement of IOP is one such technique and, as is often the case with a commonly used method, there are many ways to carry it out. This article aims to outline the correct use of a contact applanation tonometer, the technique usually cited as required prior to follow-up of a patient with suspected ocular hypertension or primary open angle glaucoma.
The Physiology of Intraocular Pressure
The pressure within the eyeball is related to the secretion and drainage of aqueous fluid. The regulation of aqueous production and drainage allows control of intraocular pressure, which is important for maintaining the structural integrity of the globe and keeping the refractive elements of the eye in appropriate relative position.
The aqueous is secreted from the epithelial layer of the processes of the ciliary body at a rate of around 2µl per minute, so allowing complete aqueous renewal every 100 minutes, though this is subject to variation as shall be outlined later.
The method of secretion is thought to be due to a combination of passive diffusion from the capillaries in the ciliary body, hydrostatic filtration from the blood to the anterior chamber and an active transport mechanism. Most researchers favour the latter of these theories. Passive diffusion appears only to allow for movement of lipid soluble molecules and the pressure gradient from capillaries to anterior chamber appears too low to suggest a filtration mechanism.
Aqueous passes through the narrow passage between anterior crystalline lens surface and iris into the anterior chamber and drains away via one of two routes. The flow of aqueous towards the drainage routes appears to follow a distinct pattern as illustrated by the way in which pigment is laid down on the corneal endothelial surface in pigment dispersion syndrome (the Krukenberg spindle).
About 80 to 90% of aqueous drains via the so-called trabecular or conventional route. The fluid passes via the trabecular meshwork into the Canal of Schlemm, to then leave the eye through the aqueous veins into the general venous drainage. Changes to the structures in this drainage route occur with age, and appear to be more exaggerated in patients with glaucoma.1
The remaining 10 to 20% (or higher in non-primate mammals) passes into the suprachoroidal space from the iris root and anterior ciliary muscle to drain into the scleral vascular system; the so-called uveoscleral or unconventional route. A small proportion of aqueous drains directly into the iris venous system.
The Range of Intraocular Pressure in the Population
Most population studies among patients over 40 years of age indicate that IOPs measured with a Goldmann contact tonometer are distributed in a manner similar to a normal distribution with a mean pressure reading of approximately 16mmHg. However, the normal distribution curve is slightly distorted as is indicated by the fact that IOPs over two standard deviations above the mean (that is greater than 21mmHg) account for 5 to 6% of the patients rather than the 2.5% predicted by a normal distribution.
A patient with an IOP greater than 21mmHg on a consistent basis (mean value over time) is said to be an ocular hypertensive. The vast majority of ocular hypertensives are initially first detected by optometrists.
For patients under 40 years of age, the IOP distribution tends towards lower values. The aqueous drainage structures become less efficient with age so tending to higher values throughout life, though this is somewhat counteracted by a reduction in aqueous production in older patients.
Physiological Variables of Intraocular Pressure
There are a great many factors affecting the IOP measurement and which have some bearing on the interpretation of any result gained when measuring the IOP. The IOP is constantly changing, showing variation in both the short-term and over longer periods of time.
The following factors are longer-term influences upon IOP and are summarised in table 1:
- Age – As already stated, IOP is found to increase with age, with a rise of 1 to 2mmHg between the age of 30 and 70.
- Gender – Older females are found to have a very slightly higher IOP (1 to 2mmHg) when compared to men of a similar age. Women tend to live longer so are often represented more. frequently in population studies relating to glaucoma and IOP.
- Ethnicity – Though environmental factors linked to geography need to be taken into account, the clear variation in IOP profiles between people of different ethnicity suggests some genetic influence. In far Eastern races, there appears to be less of a gender difference and, in Japan, IOP has even been shown to decrease with age. Many studies confirm an increased mean IOP with age among those of Afro-Caribbean and Asian descent than Caucasians.
- Genetics – People with a first order relative with primary open angle glaucoma tend to have higher IOPs than matched people without the familial link.
- Myopia – There is an association between myopia and higher IOP
- Corneal anatomy2,3 – Corneal thickness, curvature and hysteresis all influence IOP
- Seasonal variation – IOP is on average 1mmHg lower in the summer, though the individual variation may be as much as 5mmHg.
- Systemic disease – there appears to be some indirect link between cardiovascular disease, such as hypertension and diabetes, and higher IOP
- Ocular disease – see next section
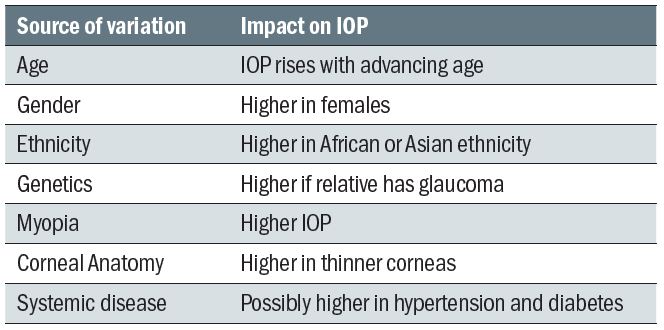
Table 1: Summary of longer-term influences upon IOP
Short-term influences abound and variously lead to the IOP being constantly in a state of change. A non-contact tonometer, taking as it does an instantaneous reading of IOP, will reflect these changes between readings, the difference dependent upon the influence of the variables at the time of measurement. For this reason, the College of Optometrists recommends at least four readings being taken and at a sitting and the value to be recorded being the mean value (excluding obvious outliers). Contact tonometry, on the other hand, relies on the constant application of force upon the cornea and this allows a visualisation of the IOP fluctuation, as will be discussed later.
Short-term influences on IOP include the following (also summarised in table 2):
- Accommodation – This has been found to cause a transient initial increase, possibly due to the increase curvature of the crystalline lens surface, followed by a small sustained decrease (4 to 5mmHg over four minutes measured for a +4.00D change). This drop may also be linked to an associated miosis linked with accommodation, though this is obviously age-dependent. The initial increase may also be enhanced by the convergence action of the extraocular muscles (see below).
- Blinking – It is not surprising that any pressure directly applied to the globe may cause a change in IOP. This is one factor to be considered during many of the methods of tonometry. Lifting a lid inappropriately, or applying a tonometer probe for too long may affect IOP values. A blink may cause a rise of up to 10mmHg in IOP, a forced blink even higher than this. Prolonged or rapidly repeated blinking may lower IOP, a phenomenon described as massaging.
- Extraocular muscle action – There is an increase in IOP upon horizontal and downward gaze, the extraocular muscles obviously exerting varying pressure upon the outside of the globe. Convergence may cause an increase in IOP of up to 4mmHg.
- Respiration – It is thought that IOP increases on expiration, decreases on inspiration. The fluctuation may vary but is occasionally as high as 2 to 3mmHg during the breathing cycle. Closing the trachea in a Valsalva manoeuvre increases the IOP.
- Arterial pulse – The IOP varies with the cardiac cycle, typically by 2 to 3mmHg between systole and diastole and corresponding to arterial pulse and choroidal filling. This may be due to influence on a hydrostatic secretory mechanism, a direct effect of vessel shape change upon the anterior chamber, or, more likely, an effect upon the drainage of aqueous fluid. A contact tonometer allows the pulse to be visualised and significantly asymmetric ocular pulses between the eyes may be evidence of cardiovascular disease, such as carotid atherosclerosis.
- Diurnal variation – The IOP varies in a sinusoidal fashion over a 24-hour period, and generally seems to peak in the early morning while reaching its lowest value 12 hours later. This diurnal variation may be from 3 to 5mmHg as measured in the working day, though as much as 10 to16mmHg if measured over a 24-hour period including during sleeping periods. It is often found that the diurnal range is significantly higher in a patient with primary open angle glaucoma and a measured change of greater than that expected during the working day (usually 5mmHg is taken as the cut-off point) is to be treated as suspicious. Some researchers have suggested that a borderline raised or higher pressure reading taken in the afternoon should be checked the following morning when a second high reading could confirm the possibility of ocular hypertension, once the two values are averaged. The monitoring of IOP over a period of time, so-called phasing, is a useful technique employed in hospital clinics to verify the reliability of a suspect hypertensive referral. If the pattern of variation between individuals were repeatable then comparison would be simplified by screening everyone at a chosen time in the morning to coincide with the peak reading. Unfortunately, this repeatability of IOP for any given time is not found. This is probably due to the variety of factors thought to contribute to the diurnal fluctuation. Sleep itself would influence the IOP in many ways (dilated pupils, relaxed accommodation, closed lids, supine position, slower heart and respiration rates, absence of external agent intake and so on). There also appears to be a link with our metabolic body clock that is linked to diurnal cycles of hormones, regulated in part by secretions of adrenocorticotrophic hormone (ACTH). This has been shown to influence secretion of melatonin from the pineal gland which itself has been demonstrated to have an effect upon IOP. The activity of the pineal gland is maximal during rapid eye movement sleep, usually towards the end of a sleep phase, and this is reflected in an IOP rise some 30 minutes later. In most lifestyles this would correspond with an IOP rise in the early to mid-morning. This diurnal fluctuation necessitates the time at which a reading of IOP is taken is always recorded on the record card.
- Food and drugs – Though more pharmacological than physiological, it is important to remember the influence of fluid intake and drugs on IOP. Water intake increases IOP, as will excessive caffeine. Reports suggest a transient increase with smoking tobacco, but if smoking marijuana or heroin a reduction may result. Many legal drugs have an effect on IOP, such as the well-known link with systemic steroids (increase IOP) or beta-blockers (decrease IOP).
- Posture – IOP is increased (by 0.3 to 6mmHg) when changing from a sitting to a supine position, with this postural change being greater in glaucoma. An inverted position is even more likely to increase IOP due to elevated episcleral venous pressure. Even an over-exuberantly tied necktie, or head tilting to hold a mobile phone in place hands-free can cause increased IOP.
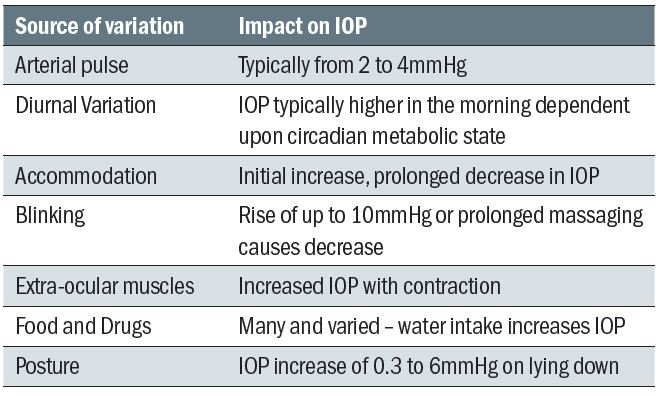
Table 2: Summary of short-term influences upon IOP
IOP and Ocular Disease
The measurement of IOP is useful in the investigation of several ocular diseases, though remember it is not just glaucoma that is of interest.
The term glaucoma describes a wide range of ocular diseases where there is progressive damage to the optic nerve leading to a loss of visual function and often associated with a rise in intraocular pressure. Table 3 shows how the risk of primary open angle glaucoma increases as mean IOP increases, but the two are not inter-dependent. Indeed, as IOP management is still the mainstay of treatment, the very significant number of people developing glaucomatous nerve damage with IOPs in the normal range (normal tension glaucoma) are notoriously difficult to manage. Similarly, many ocular hypertensives do not develop glaucoma, despite the increased IOP risk and dependent on the presence and influence of other risk factors. The persistent perception among the public that ‘glaucoma equals pressure in the eye’ can be usefully deflected by eye care professionals.
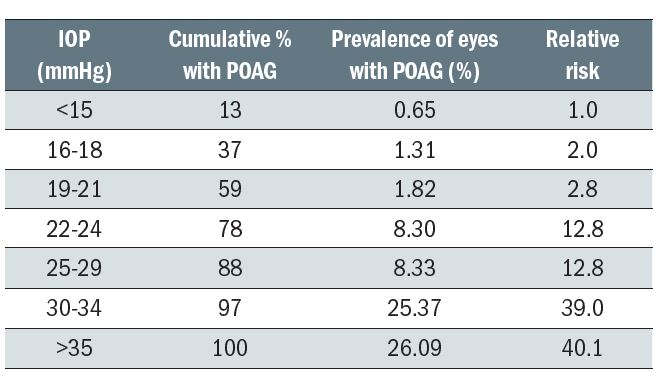
Table 3: Prevalence of POAG at different levels of screening IOP and the relative risk at specific levels of IOP4
That said, clear evidence for the importance of intraocular pressure in the development of glaucoma is why the recent revised NICE guidelines suggests referral or monitoring of people with IOP above 24mmHg (measured by contact tonometry). Also, asymmetric IOPs of greater than 4 mmHg need to be explained.
As a diagnostic tool for conditions other than the glaucomas, tonometry may often be considered to be of limited use. However, a high IOP reading is often a causative factor in central retinal vein occlusion.
Low IOP readings may give an indication that intraocular fluid is being lost. It is commonplace for there to be a reduced IOP subsequent to intraocular surgery and the stabilisation of IOP after surgery is often looked for. A choroidal detachment after filtration surgery may result in an unusually low IOP reading.
In eyes with no history of surgery or traumatic penetration, a very low IOP reading (especially in an eye with symptoms) can sometimes be, albeit rarely, an indication of a rhegmatogenous retinal detachment and this measurement may be particularly useful to an optometrist when the tear is in the extreme periphery and difficult to visualise directly. A drop in IOP accompanying Shafer’s sign in the anterior vitreous should warrant urgent action.
Tonometry in the Routine Eye Examination
There are many indications for tonometry to be carried out (see table 4). Most practitioners, aware of the link with open-angle glaucoma, the major risk factor for which is age, measure IOP routinely on all patients over a certain age. Forty years of age is a cut-off point where epidemiological studies suggest the incidence of glaucoma becomes significant. One to 2.1% of Caucasians and 4.7 to 8.8% of Afro-Caribbeans over the age of 40 years suffer the disease. The incidence increases dramatically to 3.5% Caucasians and 12% Afro-Caribbeans over the age of 70 years.
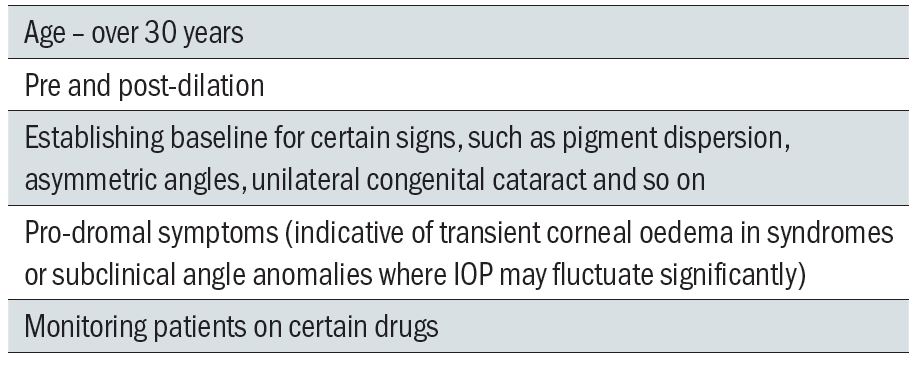
Table 4: Indications for tonometry
These figures, and the great variability of the disease, are both reflected in the sometime occurrence of open-angle glaucoma in the under 40s, so most practitioners measure IOP on all patients over 30 years of age as a screening exercise.
It may also be useful to have a baseline measurement of IOP for some patients (irrespective of age) for interpretation of any future readings taken, such as where there is structural asymmetry or, perhaps, prior to the prescribing of IOP influencing drugs. Younger patients may present with signs that may indicate a risk of secondary open-angle or primary and secondary closed angle glaucoma, for example a very narrow angle or the presence of material on the corneal endothelium or in the anterior chamber. An IOP measurement would be useful in these instances.
IOP is routinely measured prior to and subsequent to dilation. A rise of more than 5mmHg which fails to stabilise may be indicative of a future angle closure and so advice needs to be offered to such pressure-responders.
Techniques of Measuring Intraocular Pressure
There have been many methods used to measure IOP, some more successfully than others.5 The remainder of this article will focus on contact applanation tonometry. Both commonly used contact tonometers, such as Goldmann or its hand-held version the Perkins, and non-contact tonometers (the ‘air puff’) are applanation tonometers as they work by relating the force required to flatten a specific area of cornea to the intraocular pressure. This means that both are at the mercy of corneal thickness and structural properties.
There is a reasonable correlation between contact and non-contact in the standard range of IOPs, though as their mode of measurement is different, non-contact tonometry tends to read higher than contact tonometry, certainly in the range of 20mmHg or more. As this is approaching the level at which referral or monitoring decisions are made, it is expected that, if non-contact tonometry is used first, any suspicious reading should be checked with contact applanation. This not only complies with protocols for referral or future medical intervention, but ensures consistency among clinics.
One final point – patients do not like the ‘air puff’. Experience tells us that non-contact tonometry is not liked by patients. Patients will not like drops, but a warning of some temporary stinging is all that is needed. With anaesthetised corneas and careful (not alarmist) instruction, regular users of the Goldmann or Perkins will agree that patients prefer contact.
Contact Applanation Tonometry
As suggested by the name, this technique relies upon the tonometer flattening or applanating an area of cornea. The weight applied may be related to the pressure within and the area applanated by the application of the Imbert Fick Law (originally known as the Maklakov-Fick Law).
This law states that an external force (W) against a sphere equals the pressure in the sphere (P) times the area applanated (A) or flattened by the external force as shown in figure 1.
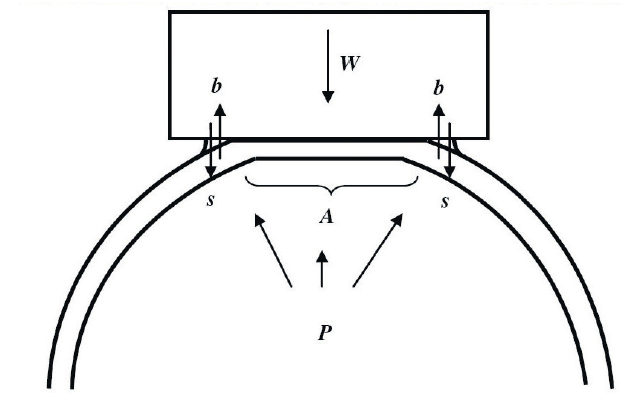
Figure 1: Forces involved in applanation tonometry
This theoretical physical law assumes that the sphere is perfectly spherical, dry, perfectly flexible and infinitely thin. The cornea fails to satisfy any of these criteria. It is aspheric, wet, and neither perfectly flexible or infinitely thin. The tear film creates a surface tension which has the effect of drawing the applied weight onto the eye (s), while the rigidity of the cornea (b) requires an extra force to deform the cornea. Furthermore, as the typical cornea has a central thickness of around 0.55mm, the area applanated is larger on the external surface than the internal surface (A).
To overcome this, the Imbert-Fick law may be modified to:
W + s = P A + b
When A is 7.35mm², there is a reasonably assumed balance between s and b, and so now;
W = P
An area of 7.35mm² has a diameter of 3.06mm, though the above assumed cancelling out holds true for areas of diameter anywhere between 3 and 4mm. 3.06mm is useful because, if that diameter is chosen for end-point applanation, then an applied force of 1g corresponds to an internal pressure of 10mmHg, so making calibration of any applanating instrument easier.
Furthermore, the volume displacement for this level of applanation is approximately 0.50mm³ such that rigidity of the globe does not significantly affect the reading. Also, ocular massaging plays a negligible part.
The standard technique for contact applanation tonometry uses the slit-lamp mounted Goldmann Applanation Tonometer or GAT (figure 2) which employs a variable weight and a prism which splits the image of the tear meniscus around the flattened area such that they correctly align when it is 7.35mm².
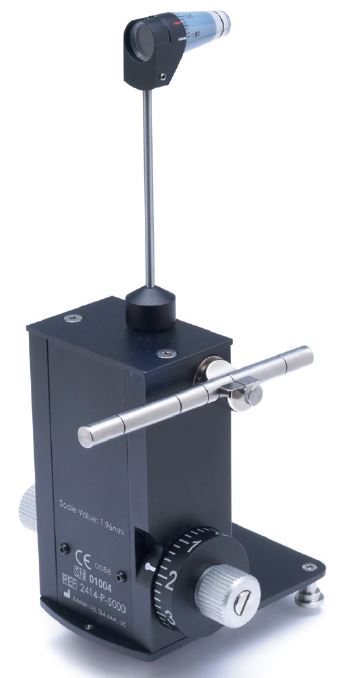
Figure 2: Goldmann Applanation Tonometer or GAT
Goldmann Applanation Tonometer
This instrument is widely used and is generally accepted as the international standard by which other instruments are compared and with which the vast majority of research in IOP measurement is carried out.
The applanation is caused by the probe that consists of a cone with a flat end containing two prisms mounted with their apices together. On contact with the cornea, the tear film forms a meniscus around the area of contact and the ring so formed is seen by the practitioner through the probe. The split prism allows the ring to be seen as two semicircles which may be moved in position relative to one another by varying the weight of the probe applied to the cornea (see figure 1). This use of a Vernier reading method adds to the accuracy of the instrument and when the inner edges of the semicircles just touch then the diameter of the applanated is 3.06mm.
The basic instrument itself, into which the cone is inserted, is basically a lever weight system with an adjustable scale, the scale calibrated in grams to allow varying force to be applied to the cornea by the probe when the wheel is turned (figure 3 left).
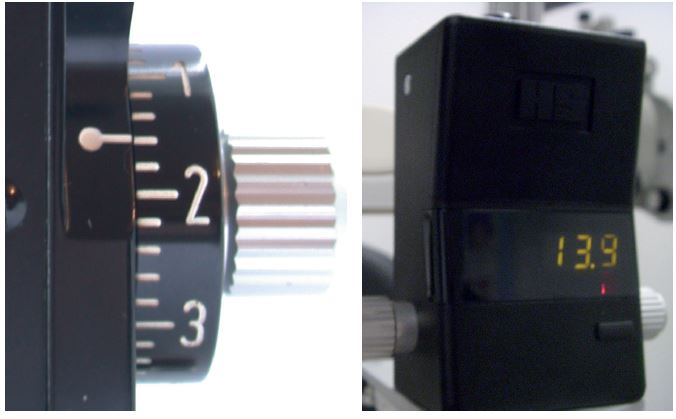
Figure 3: Scale calibrated in grams
Recently, Keeler has introduced a variation using a digital display (figure 3 right). The newer instrument records IOP to an accuracy of 0.1 mmHg which supports repeatability. The manufacturers claim that calibration is needed less often. One major advantage is that the practitioner can still read off the IOP readings from the digital display in the dark. Also, as there are fewer mechanical parts, so it is less prone to damage.
By its very definition, contact tonometry involves direct contact with the ocular surface. For this reason, the repeat use cone or tonometer head (figure 5) needs careful sterilisation between patients.
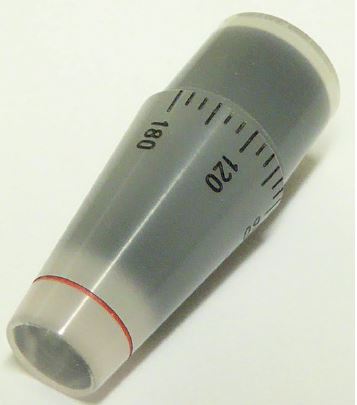
Figure 5: Tonometer head
More commonly, clinicians use disposable prisms, though their performance may differ because of light scatter. A repeat use prism has a main cone body which is opaque so light scatter is minimum. When using a transparent prism end (figure 6), some light adjustment may be needed on the slit lamp to give as clear tear menisci as with the repeat use.
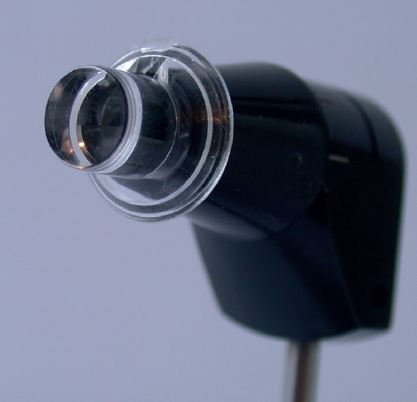
Figure 6: Transparent prism end
Disposable prisms which are primarily transparent (figure 7) can suffer from diminution of the meniscus image through light scatter. This author has effected an improved image simply by blacking out the cone.
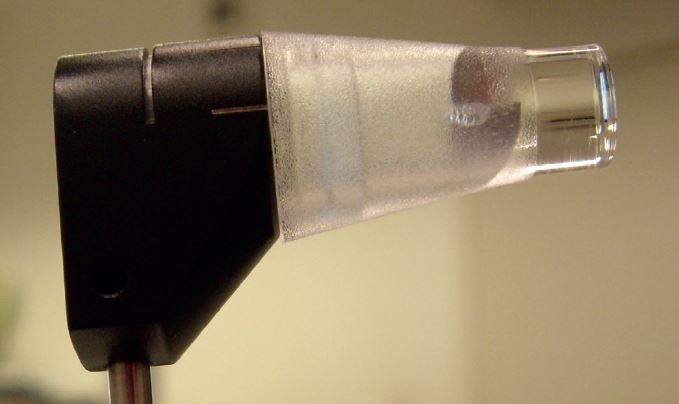
Figure 7: Disposable prism
- The probe should be inserted so that the white marking on the head aligns with that on the instrument to ensure that the split between the rings is horizontal. For astigmatic corneas (of greater than 3.00 DC), the probe is usually aligned such that the inter-prism face is set at 43° to the meridian of the lowest power then the area applanated is still correct (see later section on astigmatic corneas).
- A pre-check of the cornea is essential. This allows a record of any pre-applanation stain to be made for post-procedure comparison and to identify any active infection that might contraindicate contact (though reasons not to applanate are rarely met).
- The cornea is anaesthetised and fluorescein instilled. Too much fluorescein and therefore wide ring width will tend to give a high reading. If too little is instilled, it may be difficult to visualise the rings and Vernier adjustment is less easy.
- The instrument is set on the base plate on the slit lamp positioned before the eye to be examined and the peg pushed into the hole on the base plate of the same side as the eye to be viewed (left for left, right for right). This means the probe will approach the cornea from the nasal aspect and remain on axis despite any slight convergence by the patient. If amblyopic, the clinician should always use the peg hole on the same side as their sighted eye. To minimise the contact time with the cornea it is useful to set the instrument to the expected result, say 14mmHg.
- On low to medium magnification, the probe is viewed through the microscope with a wide slit trained on it using the highest rheostat setting and a cobalt blue filter.
- The main approach to the cornea may be made by moving the whole slit lamp base with the joystick held back. This means that, near the point of applanation, the clinician still has full joystick control. When in the plane of the lashes, ask the patient to blink, then keep their eyes open – with practice, most patients remain steady and non-blinking. It is best to avoid manally holding the lids open unless absolutely essential
- The probe is moved onto the cornea and the rings visualised and adjusted as mentioned. At the first point of contact, the end of the probe should glow a bit brighter. However, further movement towards the patient is needed to applanate and only then will the famous rings appear (figure 8). The split rings (semicircles) should be positioned equally and adjusted as outlined in the next section. When moving the two equal sized rings towards or away from each other, only small adjustments of the wheel are needed and there is often a short time lag between adjustment and ring movement. If you are new to the technique and find the rings difficult to see at first, use of an orange yellow absorption filter can help improve the contrast (as used for the photos in figure 9).
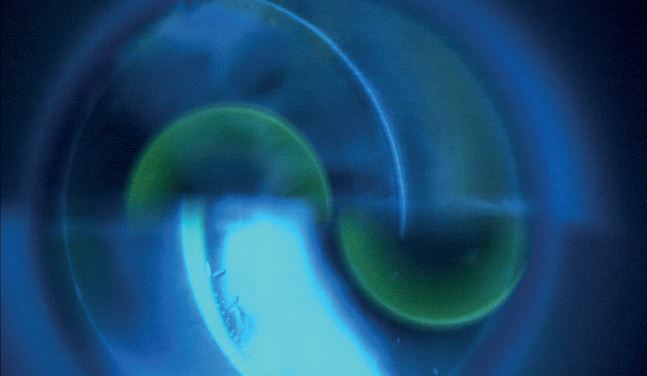
Figure 8: Semicircles during tonometry with white light and blue filter
- The probe should be removed from the cornea, the weight reading on the scale noted (in grams or X 10 for mmHg) along with the time, and the cornea checked for staining. If staining is induced, most epithelial stain will disappear within a matter of several hours; if worried, review, though unless there is a clear break through Bowman’s this is usually not necessary.
Adjusting the Rings
The correct area of applanation is signified when the two semicircles are lined up with their inner edge just touching. Figure 8 shows a gap and more force is needed. Figure 9 shows the appearance as the force is adjusted to achieve the desired end point (figure 9c).
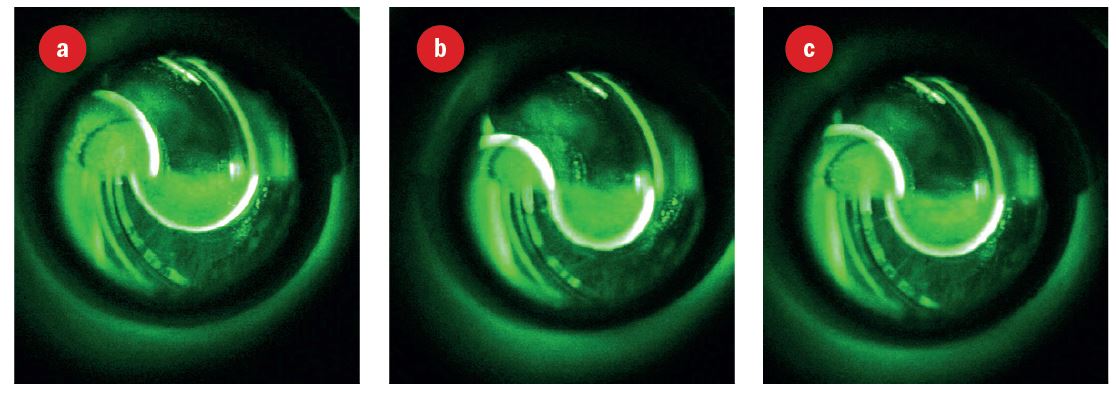
Figure 9: Rings seen under white light, a blue excitation filter and a yellow absorption filter; (a) less force needed and probe to move upwards, (b) more force needed, (c) end point
Figure 10 is a schematic representation of the various required adjustments. A very irregular cornea may make visualisation of the rings difficult but a contact method is probably more accurate in this case than a non-contact method.
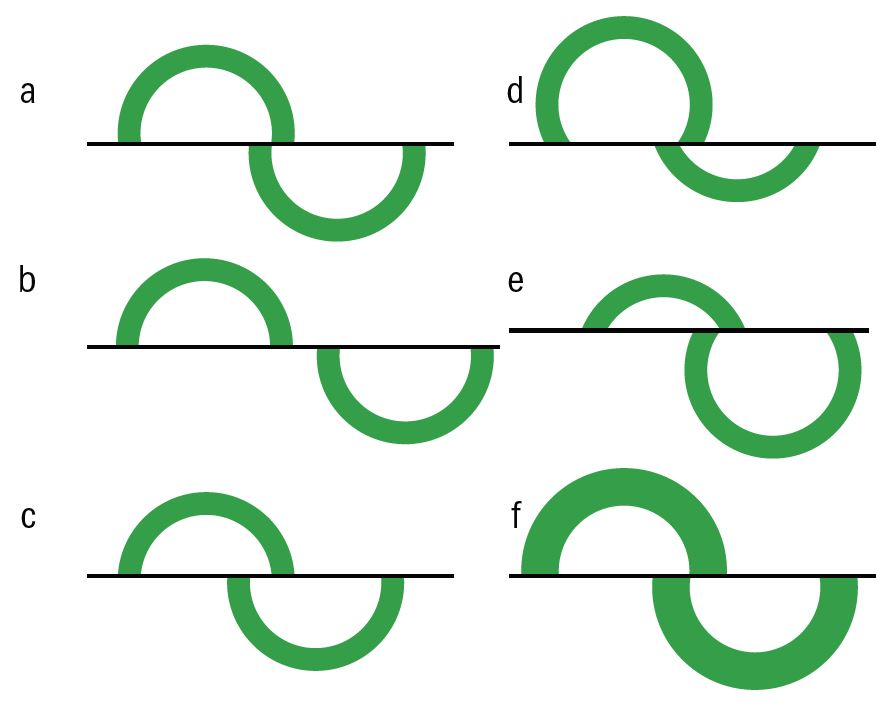
Figure 10: (a) correct end point, (b) more force needed, (c) less force needed, (d)move probe upwards, (e) move probe downwards, (f) rings too thick - wait for fluorescein to drain and repeat
Errors of Applanation
When the applanation is off-centre (as in figures 10 d and e), increased force is needed to align the rings and hence there is an over-estimate of IOP. The degree of error for different levels of displacement are shown in figure 11. Note how a misplacement as poor as shown in figure 10d might, for example, deliver a reading of 27mmHg instead of 19mmHg on the same eye.6
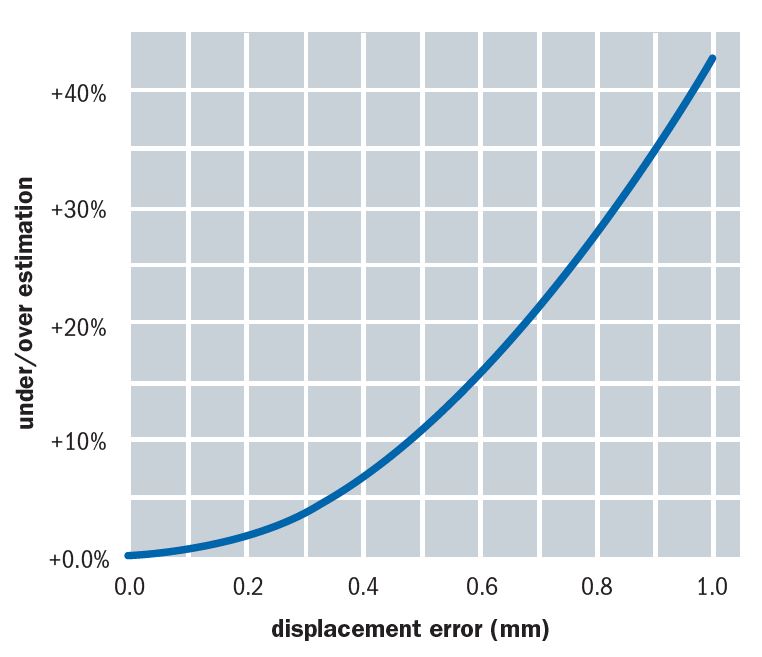
Figure 11: The degree of error for different levels of displacement
Another source of error is when the cornea is astigmatic and so the resultant applanated area is elliptical. To counteract error, the probe needs to be aligned such that the prism split is between the longer and shorter axes of the ellipse. The angular orientation of the Goldmann probe is offset by an angle of 43° from the flattest corneal meridian before taking an IOP reading. To aid correct alignment a secondary axis line is marked on the probe holder. This is usually labelled with the letter ‘A’ or marked as a red line (figure 12). Aligning this with the axis graduation on the probe body ensures the correct offset.
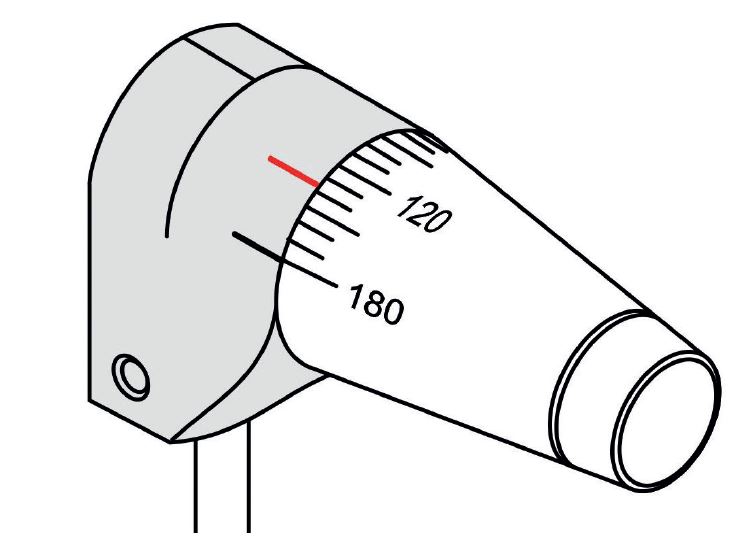
Figure 12: Secondary axis line marked on the probe holder
In a recent paper,6 Burek showed how, for a very wide range of corneal astigmatism, the 43° offset satisfactorily minimises this source of measurement error (figure 13). He concludes, ‘The 43° offset is a highly effective means of minimising measurement error on astigmatic corneas. Indeed, there seems to be no good reason to not apply it universally and not just in cases exceeding three dioptres of astigmatism.’
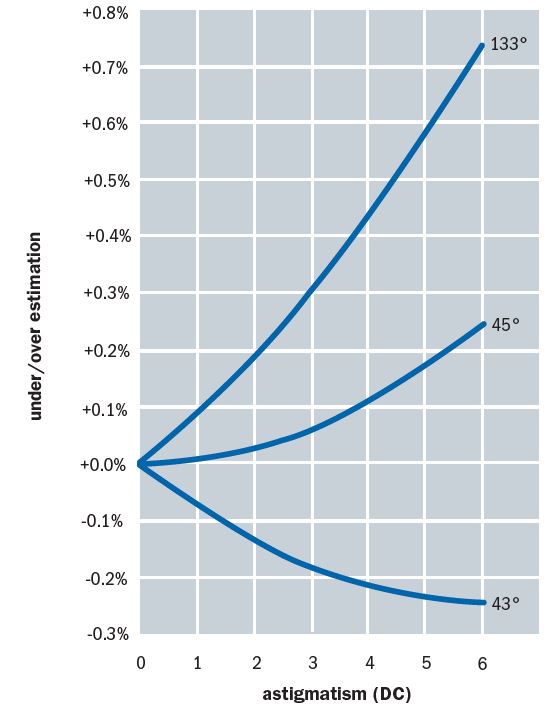
Figure 13: A 43° offset satisfactorily minimises error due to corneal astigmatism
Calibration of GAT
As with any accurate measuring instrument, regular calibration is necessary and is easily carried out by the practitioner. It is estimated that only 83% of GATs sold undergo any calibration, and this is most often sporadic and not routine. Regular calibration is essential and a log of each check (the time, date and who did it) should be kept. Every three months is a fair period to repeat this, though more often is probably sensible for regular use.
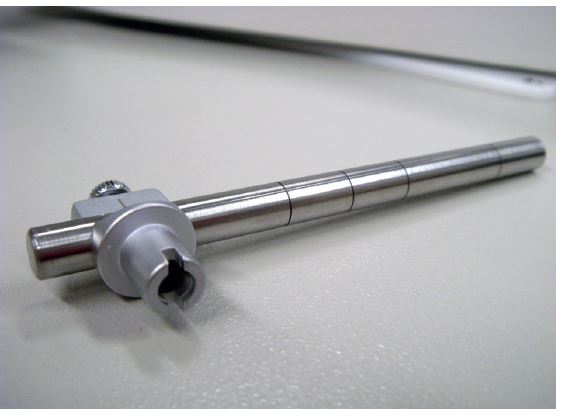
Figure 14: A calibration rod
Calibration of a GAT requires the use of a calibration rod (figure 14) which is held in a small screw attachment which in turn inserts into the housing on the side of the instrument (figure 15).
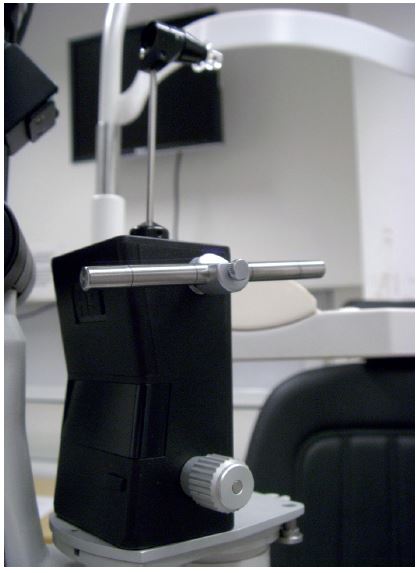
Figure 15: Calibration rod in position
The procedure is as follows:
- Set up the Goldmann unit complete with tonometer prism on the slit lamp as if to use it to take a measurement.
- Position the rod in its housing and lock so that the central marking on it is in line with that on the holding unit. In this position the rod exerts no force on the prism holder.
- The dial should be gently turned from less than ‘0’ until the head is seen to move forward. The force for this to occur, ideally around 0.1g, should be noted. The force should then be reduced and the force noted when the head moves backward again, ideally -0.1g. The middle of the two readings in this case is 0g.
- The same is done for the rod positioned with the second marker in position, the rod being pulled away from the direction of the prism such that 2.1g is needed to move the head forward and 1.9 for it to move back (a 2g averaged reading).
- The last line on the rod does the same for 6g of force.
- If the rod moves at 0.3g, 2.3g, and 6.3g, then it is still a usable instrument but the operator needs to remember to reduce each reading by 0.3g (or 3mmHg).
- If the rod moves at 0g, 2.3g and 6.6g, then there is clearly a stretched spring and the instrument should not be used.
Perkins Contact Tonometer
This instrument was developed as a hand-held, and therefore portable, version of the Goldmann. Having its own light source and viewing lens negates the need for the slit lamp (see figure 16). The probe is held on a counterbalanced mounting with a coiled spring that allows the instrument to be used accurately in either the horizontal or vertical position, useful for the supine patient in a domiciliary setting. This mechanism originally required a slightly differently weighted probe to maintain accuracy, denoted by a red ring marking as opposed to the black ring marking on Goldmann probes. The advent of newer designs of both instrument and probe has done away with this discrepancy.
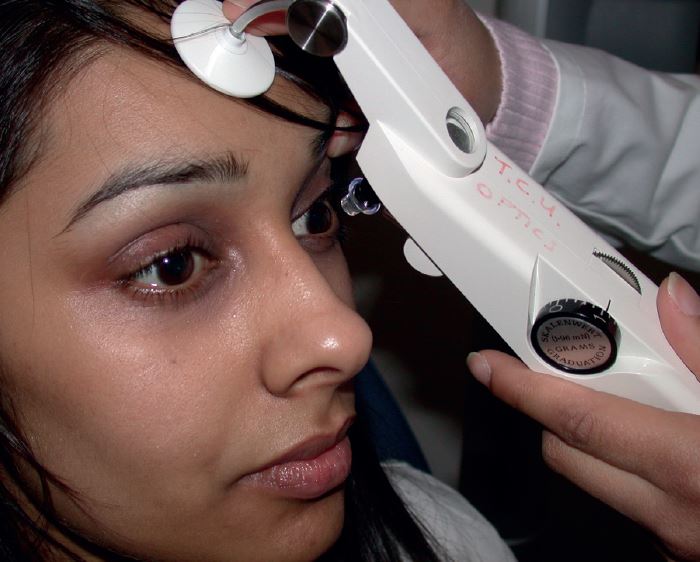
Figure 16: A mark II Perkins tonometer in use
The instrument has a headrest attachment that may be extended and held in position on the patients’ forehead to minimise instrument shake, possibly one of the main problems with this instrument. The Mark II version has two light sources for ease of viewing and may be fitted with a magnifying device (the Perkins Examination Telescope) allowing viewing of the rings at arm’s length.
Newer models still include a rechargeable battery pack. Not surprisingly, the results gained are comparable to the Goldmann, though there is a greater risk of error due to misalignment.
Calibration is similar to the Goldmann technique in that it relies on the use of three artificial forces, in this case supplied by weights (figure 17).
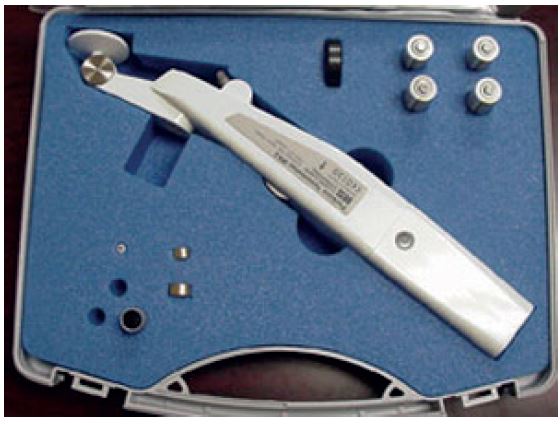
Figure 17: A mark II Perkins in its case – note the brass calibration weights
The procedure is as follows:
- The instrument should be fitted with a prism and laid on its back, prism upwards. To ensure that the force is vertically applied, some authorities suggest placing the supplied black disc beneath the head of the instrument (or the metal cylinder for the older Mark 1 instrument having first removed the battery pack from the handle)
- The prism should first pop up just after 0g is set and back down just under 0g
- A 2g and a 5g weight should in turn be balanced on the prism (obviously rendering it non-sterile and unusable) and the force needed to pop up and down the prism should be just over and under 2g and 5g respectively. Constant error may be adjusted in the final reading, whereas a non-linear error means the instrument is unusable.
References
- Spry P, Harper R. Essential Glaucoma Handbook. Edited; Harvey W. Optician Publications, 2010.
- Brandt JD. Central corneal thickness, tonometry, and glaucoma risk-a guide for the perplexed. Can J Ophthalmol 2007 Aug;42(4):562-6.
- Kotecha A. What biomechanical properties of the cornea are relevant for the clinician? Surv Ophthalmol 2007 Nov;52 Suppl 2:S109-14.
- Tielsch JM1, Katz J, Singh K, Quigley HA, Gottsch JD, Javitt J, Sommer A. A population-based evaluation of glaucoma screening: the Baltimore Eye Survey. Am J Epidemiol. 1991, 15;134(10):1102-10.
- Kniestedt C, Punjabi O, Lin S, Stamper RL. Tonometry through the ages. Surv Ophthalmol 2008 Nov-Dec;53(6):568-91.
- Burek, H. Watch Where You Put That Probe! Optician, 14.07.2017.