Over the past 60 years, since Mundt and Hughes first described an ultrasonic approach using in vitro A-mode scanning to examine enucleated eyes of patients with intraocular tumours,1 ophthalmic ultrasound has become a standard diagnostic method providing an important tool in the ophthalmologist’s armamentarium. From ultrasound biometry A-scans in patients with dense cataracts prior to surgery, to the diagnosis and measurement of ocular tumours with combined standard diagnostic A- and B-scans and the visualisation of the mechanisms of angle closure glaucoma with ultrasound biomicroscopy (UBM), this technology continues to hold a significant place in the ever widening field of ophthalmic imaging and diagnostics.
In spite of major advances over recent years in the wide range of ophthalmic imaging techniques which utilise light, such as optical coherence tomography (OCT), ultra wide field fundus imaging, scanning laser ophthalmoscopy (SLO), anterior imaging using sophisticated slit lamp systems and more recently, OCT angiography (OCTA), different modes of ophthalmic ultrasonography continue to provide valuable diagnostic and quantitative information in a range of different conditions, particularly in circumstances where light based techniques may be difficult to execute effectively.
Anatomy
It is fair to say that several inherent qualities of the eye, such as its superficial position which allows relatively easy access, its cystic composition and the presence of both echogenic (reflecting ultrasound waves) structures (such as the cornea, lens, retina) and anechoic (non-reflecting) fluid filled spaces (anterior chamber and vitreous) make the eye and its surrounding tissue particularly amenable to ultrasonic examination and imaging.
Equipment
The compact and portable nature of many ophthalmic ultrasound systems (figure 1) mean that examinations can be carried out relatively quickly in a variety of different clinical settings compared with other larger less portable ophthalmic imaging devices such as OCT or SLO, which tend to remain within a specific clinic room. Ultrasound scans are also dynamic, capable of capturing movement in real time, which helps to accommodate an immediate diagnosis by a skilled operator. It is also a relatively inexpensive methodology when compared with other imaging techniques, particularly OCT.
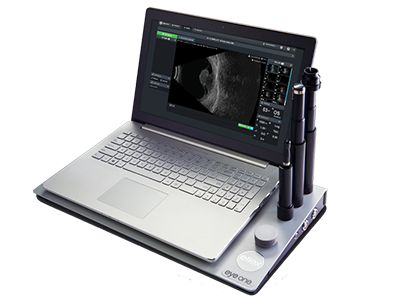
Figure 1: Many ophthalmic ultrasound systems are compact and portable
A Brief History
Although the first reported use of ophthalmic ultrasonography was in the 1950s, the technology has its roots in the discovery of piezoelectricity, by the French scientists and brothers, Pierre and Jacques Curie, working at the University of Montpellier in the south east of France in 1880.2 The brothers discovered that with the application of mechanical pressure to some solid objects (including certain crystals) a voltage is produced across the object’s surface. They subsequently observed that the reverse was true and by applying an electric field to the same crystals their dimensions are subject to almost imperceptible change and movement (vibration). This reverse piezoelectric effect can be used to produce ultrasonic waves.
However, it was not until several years later that Pierre Curie’s doctoral student, Paul Langevin, under a commission to the French government during the First World War, developed the brother’s discoveries for the detection of enemy submarines.3 Langevin’s work in turn laid the foundation for sonar, which was to prove so effective in the detection of U-boats during World War II and is still used by naval forces and other maritime industries today.
Immediately after the Second World War, a growing number of scientists and physicians began to harness the potential of ultrasound technology in medicine. In 1945, John Wild, an English surgeon working in the United States, used sonographic waves to investigate bowel wall thickness in a variety of different diseases, Douglass Howry, working at the University of Colorado in 1948 comparing cross-sectional anatomy to gross pathology using ultrasound and George Ludwig, whose experiments on animal tissues led him to calculate the velocity of sound transmission in soft tissues at a mean of 1,540m/sec.4 Each of these innovators made advances in A-mode (amplitude) scanning and began to develop the B-mode (brightness) technique. In the 1951 Wild working with John Reid [reference] built a handheld instrument for the examination of breast tumours4 and in 1963 the first commercially available handheld contact B-mode scanner was launched in the United States, marketed by Physionics.
The use of ultrasonography in medicine is now well established and wide ranging, with this technology, first developed in the middle part of the 20th century deployed across a number of medical disciplines. As well as ophthalmology its use is particularly well established in the fields of cardiology and obstetrics & gynaecology.
Ultrasonic Technology
Ophthalmic ultrasound devices generate high frequency sound waves of about 8MHz (8 million/cycles per second) and above,5 which are outside the normal human hearing range of 20Hz to 20kHz. The relatively superficial position of the eye accommodates the use of higher frequencies. This contrasts with the ultrasound equipment used in other fields of medicine such as obstetrics which work at lower frequencies of about 5-6MHz to allow greater depth penetration, albeit at the cost of resolution. The higher frequencies of ophthalmic ultrasound probes allow for the resolution of very small structures of the eye itself as well as discreet lesions associated with different conditions.
The ultrasound transducer, sometimes referred to as the probe, acts as both transmitter and receiver. Its basic structure includes the following elements; a power supply cable to carry the electric current, piezoelectric crystal (quartz or similar) to generate and detect sonic waves, and an acoustic lens to focus the sound emanating from and returning to the crystal. The transducer also incorporates acoustic insulation to eliminate back reflections of sound waves from the probe itself (figure 2).
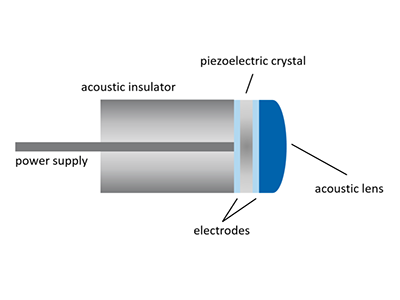 Figure 2: The transducer incorporates acoustic insulation to eliminate back reflections of sound waves from the probe itself
In ophthalmic ultrasound, transducers tend to be roughly pen sized with A-scan probes smaller than those used for B-scans (figure 3). B-mode diagnostic probes have an orientation marker, usually a line or a spot towards the tip of the probe to help ensure that the examination is being carried out on the desired plain. Although ultrasound probes are designed to be handheld some practitioners prefer to use them suspended from a gantry arm in order to minimize motion artefacts as a result of hand movements.
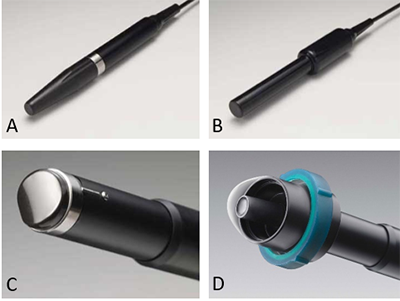
Figure 3: Transducers tend to be roughly pen sized with A-scan probes (A & B) smaller than those used for B-scans (C) and UBM (D)
When an alternating current is applied to the crystal it vibrates at high frequency producing ultrasound at the desired wavelength. This is then focused and directed towards the subject. Because sound travels through different media at different velocities (table 1) a change in the reflected signal is created at the junction of the two media, such as between the fluid filled anterior chamber and the surface of the lens. Soundwaves returning to the transducer (echoes) cause the vibration of the crystal and these vibrations are converted into electrical energy which are amplified, processed and output as images (scans).
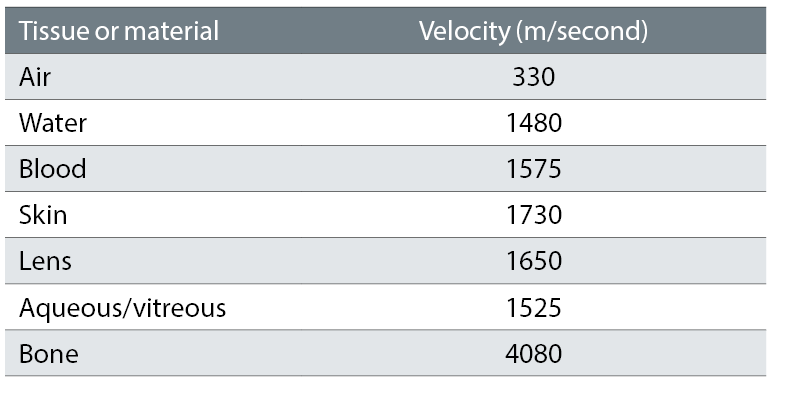
Table 1: Sound speeds through different media
The amplification of the echoes can be increased or decreased using the system’s gain control. Gain acts in a similar way to the volume control on the amplifier of a music sound system allowing you to increase the level to capture weaker echoes or reduce it to exclude them while retaining the important echoes coming from anatomical structures or boundaries between different media. While lowering the gain effectively improves resolution of the scan this is at the expense of depth penetration by the sound beam.
Scan Modes
While scan types can be broadly classified as either A- or B-mode, they can both be further sub-classified as biometric or diagnostic A-scanning and diagnostic (sometimes referred to as posterior) B-scanning or ultrasound biomicroscopy (UBM), which uses very high frequencies.
Biometric A-scanning is deployed to measure the axial length of the eye, anterior chamber depth and the location and characteristics of other ophthalmic structures. Whereas the diagnostic A-scan is used to identify the structure, location or depth and metrics of certain lesions or anomalies and is usually deployed in conjunction with a B-mode scan.
In A-scanning, a single beam of sound is generated and sent out from the transducer, on its return the signal is processed and the interface between different media, where the acoustic impedance (velocity of sound multiplied by tissue density) changes, is recorded as a spike (figure 4).
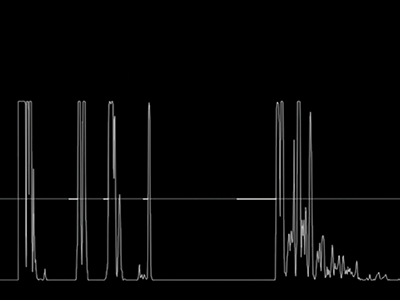
Figure 4: A-scanning employs a single beam of sound to show reflections from different media interfaces
For ultrasound biometry, either contact or immersion, the A-mode is used to produce a signal with a frequency usually in the region of 10MHz to measure the axial length of the eye and determine the position, depth or thickness of various structures; cornea, anterior chamber, lens, etc. These metrics are then processed using one of the many formulae available in order to calculate the IOL power for successful cataract surgery. Although ultrasound biometry has been largely superseded by optical biometry, in certain circumstances; dense cataracts or other media opacity, it may not be possible to use light based technology to measure axial length. In such circumstances the immersion technique is the preferred method of ultrasound biometry. This approach uses a probe immersed in a solution contained in a plastic holder such as a Prager Shell to avoid touching the cornea. With the contact method, direct pressure on the cornea, which can compress the globe can distort axial length and other measurements, having an adverse effect on subsequent outcomes. A-scan ultrasound, both biometry (contact method) and diagnostic can be carried out through the patient’s closed eyelid, however the best results are achieved when the patient’s eye is open. This applies to both immersion and contact methods. In these circumstances the examiner must apply topical anaesthetic drops to the patient’s eye prior to the examination. All equipment including probes and shells should be properly cleaned and sterilised before-hand regardless of the type of examination being carried out.
The diagnostic A-scan is typically used to establish the structure, location and other metrics of lesions which have already been detected using a B-scan screening examination protocol. In order to maximise penetration and depth to record structural changes and abnormalities beyond the RPE, the frequency of the diagnostic A-scan is lower than that used for biometry, in the range of 8MHz.
As with A-mode scanning the B-mode approach can also be subdivided, as posterior B-mode scanning featuring a probe producing a signal at a frequency of 10MHz and UBM, which trades depth penetration for greater resolution by using a much higher frequency probe (usually up to 60MHz) to facilitate detailed examination of the anterior structures of the eye.
The beam of sound generated by a B-mode probe sweeps back and forth at high frequency to generate a 2D grey scale wedge shaped image (figure 5). Ultrasound B-scans are analogues to OCT B-scans, in as much as they use sound in the same way that OCT uses light to build an image based on the changes in the reflective qualities of tissue with different density. Like OCT, ultrasound B-scans and UBM each generate a composite image based on fusing together near simultaneous multiple A-scans.
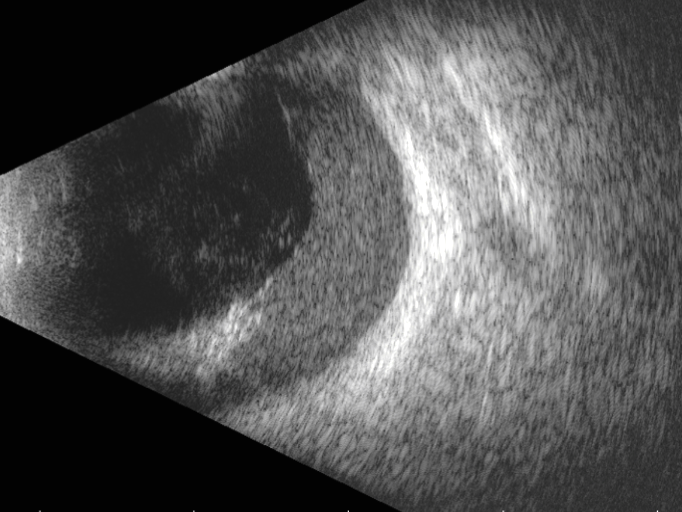
Figure 5: A B-scan employs a horizontal sweep at high frequency to generate a 2D grey scale wedge shaped image
In general posterior B-scans are used in a diagnostic setting to evaluate the vitreous, retina and choroid. In addition, they are sometimes deployed in an emergency setting to identify the presence of foreign bodies in the eye as a result of trauma.
Again, posterior B-scanning can be carried out through a closed eyelid although the best results are achieved when a clean, sterilised probe is placed directly onto an anaesthetised eye. When carrying out a diagnostic posterior B-scan examination the user utilises the probe’s orientation marker (figure 6) to ensure the correct position when following the exam protocol. Examination or screening protocols should include the key scan orientations of transverse, longitudinal and axial.
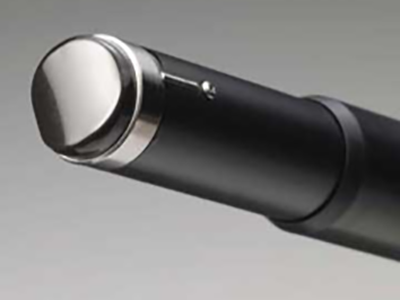
Figure 6: Probe orientation marker
In order to follow an examination protocol the eye is usually divided up into the hours of a clock face and each hour is then imagined as a line running from the cornea to the optic nerve (the central point of an ultrasound B-scan). When carrying out both transverse and longitudinal scans the cornea and the lens, both of which absorb the signal, should be avoided. If these structures need to be included in the examination, an axial scan is performed with the probe placed in the centre of the cornea and orientated, vertically or horizontally as required. The position of the probe’s orientation marker indicates the top of the image as it appears on the display screen.
For transverse scans the probe should be tangential to the limbus, marker pointing superiorly for vertical and oblique scans, and pointing nasally for horizontal scans. Each transverse scan will include several clock hours at once. Each quadrant; superior, inferior, nasal and temporal should be examined and, starting at the posterior pole (optic nerve) the probe should be moved from the posterior towards the anterior in a sweeping motion (figure 7a).
For longitudinal scans the probe is placed onto the sclera with the plane of the ultrasound beam facing towards the pupil. Each clock hour should be imaged one at a time with the scanned meridian designated by the clock hour opposite the position where the marker is placed. The probe marker should always be placed towards the limbus (figure 7b).
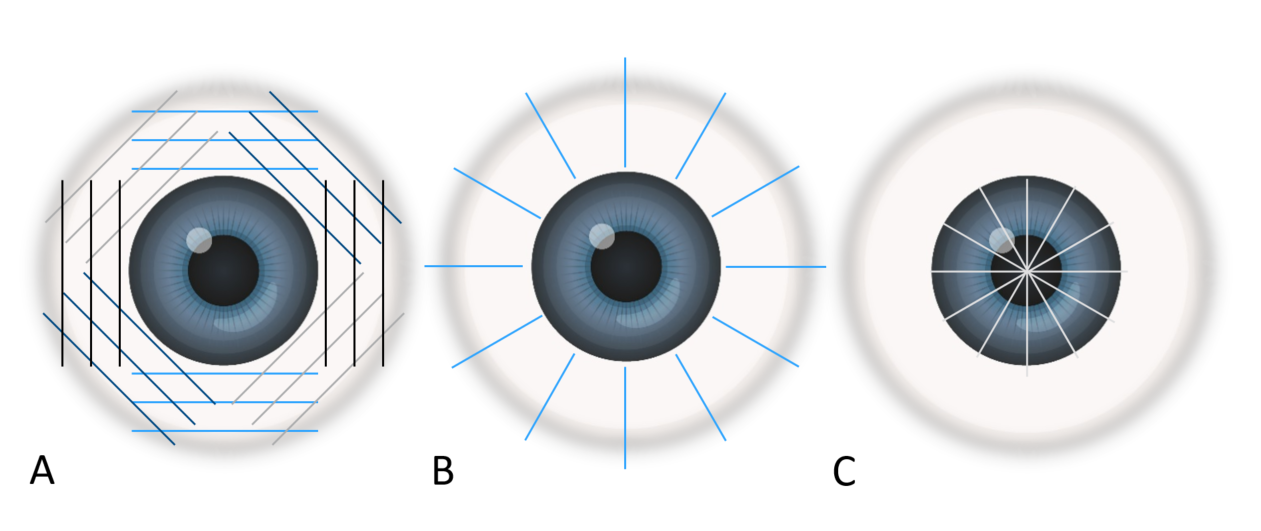
Figure 7: Different scanning patterns; A transverse, B longitudinal and C axial
For the axial scan the probe should be placed on the cornea, centred on the pupil with marked pointed nasally to begin with, capturing a horizontal axial scan. The probe can then be rotated anti-clockwise through 90 degrees, for oblique axial scans until the marker is pointing directly up in the vertical scan position (figure 7c). Axial scans are useful for determining the position of a lesion in the posterior pole and where it is in relation to the macula or optic nerve.
Clinical Applications of Diagnostic Posterior B-scan Ultrasound
Ideally, a posterior B-scan ultrasound examination should be carried out in any patient where the ocular fundus cannot be clearly visualised. Patients with corneal opacities, dense cataracts and vitreous anomalies should, if possible be examined ultrasonically, as imaging using light based techniques is likely to encounter problems.
Generally speaking ophthalmic B-scan ultrasound is effective in visualising the following; membranous lesions such as retinal, posterior vitreous or choroidal detachments, retinal tears or retinoschisis, dot lesions including haemorrhages, asteroid hyalosis or other opacities in the vitreous body and, perhaps most significantly intraocular tumours.
Before the examination the practitioner needs to explain the process to the patient, reassuring them that the probe has been properly cleaned and sterilised and checking that their eye has been numbed by the anaesthetic drops. The patient should be comfortably seated or even supine on an examination couch. The examiner should be positioned so they can see both the probe and its orientation marker and the screen. It is also important that the examiner can easily reach the foot pedal control, which on most machines is used to freeze individual frames or capture short ‘movie’ clips from the dynamic scan.
Using the aforementioned protocol, scanning should include; a topographic examination in order to establish the shape and position/depth of the abnormality, a quantitative assessment concerned with the reflectivity, attenuation and, in conjunction with a diagnostic A-scan (figure 8), the structure and dimensions of the lesion, and, finally a kinetic evaluation to determine both normal or abnormal mobility of the structures being imaged.
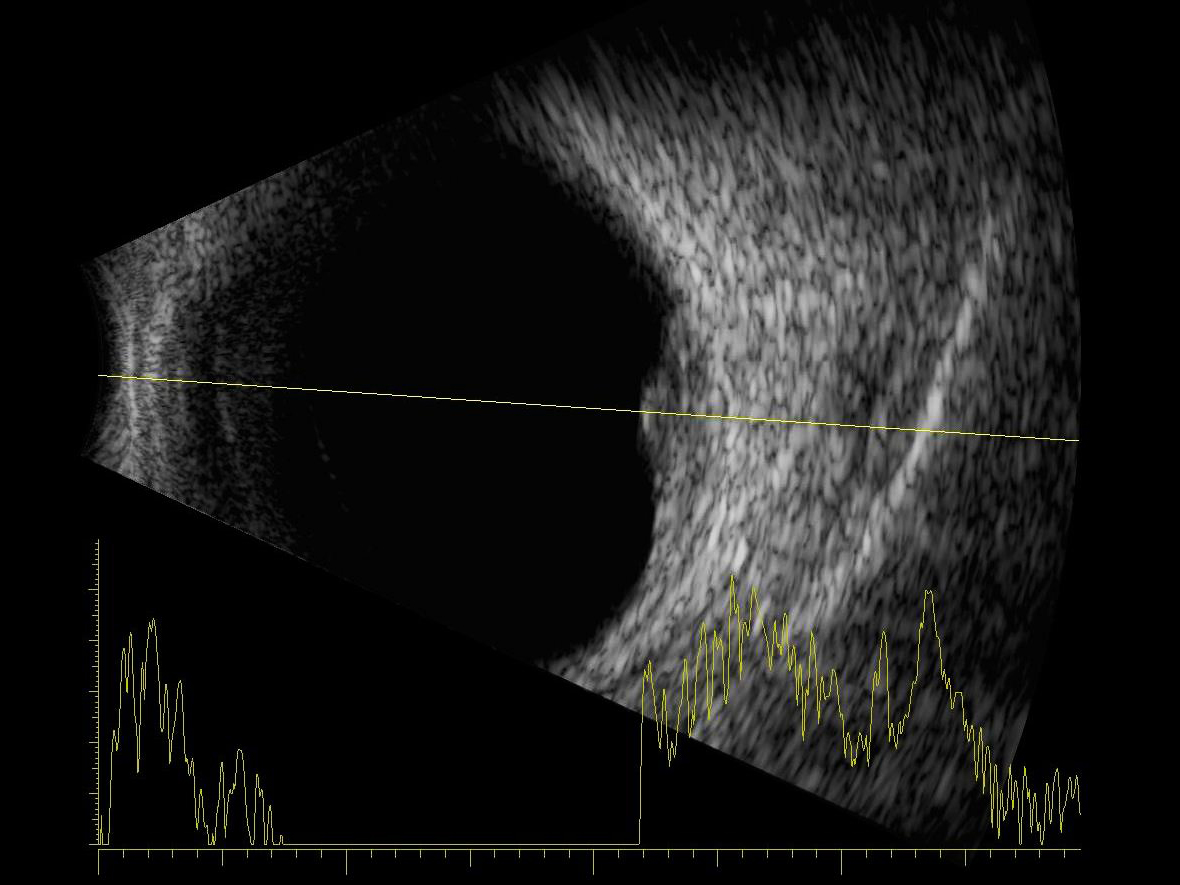
Figure 8: Combined data output from an A and a B-scan
Retinal Detachment
A retinal detachment will appear as a highly reflective membrane which, when examined kinetically will flap and undulate and appear hammock shaped. In the case of a total retinal detachment, when the scan is centred on the optic nerve where the retina remains anchored the lesion will be funnel shaped when examined transversely (figure 9), extending from the optic nerve to the ora serrata where it also remains connected. Tractional retinal detachments may have a tent like appearance.
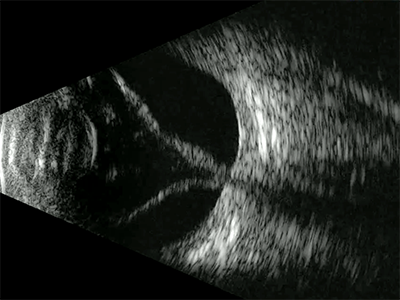
Figure 9: B-scan centred on the optic nerve showing a complete retinal detachment
When observed using a longitudinal scan a retinal tear will appear as a membranous flap and will sometimes appear connected at one or both ends. As with detachments movement may be apparent when examined kinetically.
Retinoschisis has a much more rigid and dome-shaped appearance compared with detachments and tears with the surface appearing highly reflective and the underlying anechoic fluid filled space appearing dark or black (figure 10).
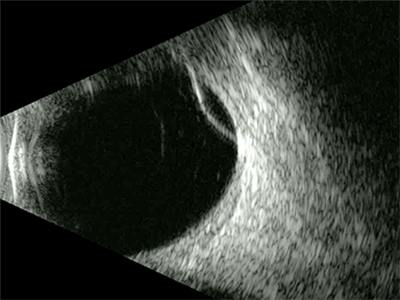
Figure 10: B-scan of a retinoschisis showing as a dome-shaped elevation
Posterior Vitreous Detachment
In most cases, although they may appear superficially similar to retinal detachments, PVDs tend to be much less reflective so will appear relatively pale on the scan. Another way to differentiate between the two is to ask the patient to move their eye rapidly from side to side or up and down, when the eye comes to rest a PVD membrane will continue to move whereas a less mobile detachment will be static.
Choroidal Detachment
Although difficult to differentiate, the choroid appears both thicker and slightly more reflective on an ultrasound B-scan than the retina. In the presence of fluid these two layers along with the sclera will separate slightly (figure 11) making it easier to distinguish a choroidal detachment from retinal lesions.
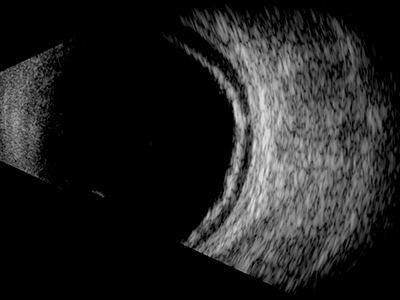
Figure 11: In the presence of fluid, the retina and choroid along with the sclera will separate slightly making it easier to distinguish a choroidal detachment from retinal lesions
Although, like retinoschisis a serous choroidal detachment will appear dome shaped, it will appear much thicker and with larger detachments there may be multiple domes (figure 12), which sometimes touch in the centre of the vitreous, so called ‘kissing’ choroid. In the case of detachment as a result of trauma the sub-choroidal haemorrhagic space may appear speckled rather than uniformly dark.
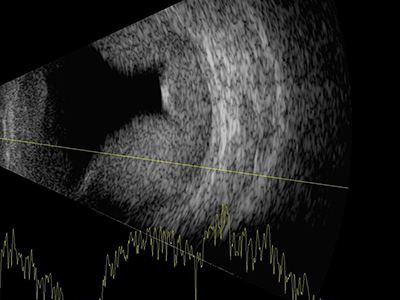
Figure 12: A serous choroidal detachment will appear dome shaped but will appear much thicker than a retinoschisis and there may be multiple domes
Vitreous Lesions
Under normal circumstances the vitreous is anechoic and appears very dark or black on an ultrasound B-scan. However, when abnormalities are present, depending on their relative reflectivity, the vitreous space will begin to show speckled, lined, cystic or other more randomly shaped areas of increased brightness.
Asteroid hyalosis has a speckled ‘snow globe’ appearance with bright dots occupying most of the vitreous space.
The reflective quality of a vitreous haemorrhage, and therefore the brightness of the image will vary from medium to high depending on their size, position and density, with clotted blood appearing very bright. Vitreous haemorrhages may have a billowing cloud like appearance (figure 13), although their shape and appearance will vary.
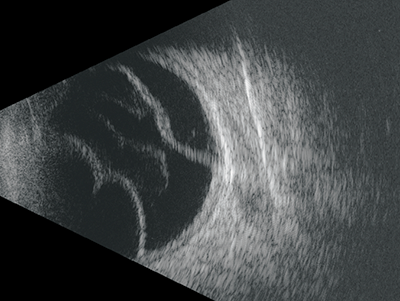
Figure 13: Vitreous haemorrhages may have a billowing cloud like appearance
Intraocular Tumours
Ophthalmic ultrasound is a key examination technique in the field of ocular oncology, producing as it does high quality, quantifiable (B-scan in conjunction standard diagnostic A-scan) cost effective imaging, which in many cases facilitates immediate diagnosis.
When assessing an ocular mass the examiner should perform transverse scans in all four quadrants of the eye. The gain setting on the device should initially be set high to allow assessment of the vitreous then reduced to examine the retina and choroid.
Choroidal Naevi
Benign choroidal naevi will appear flat and diffusely thickened, although they may sometimes be slightly domed they are often too small to assess with standard diagnostic A-scan and will show no active growth on repeat scans (figure 14). However, if the lesion thickens becoming greater than 2mm, appears more attenuated on the B-scan and shows signs of sub-retinal fluid it should be treated with suspicion and monitored more closely.
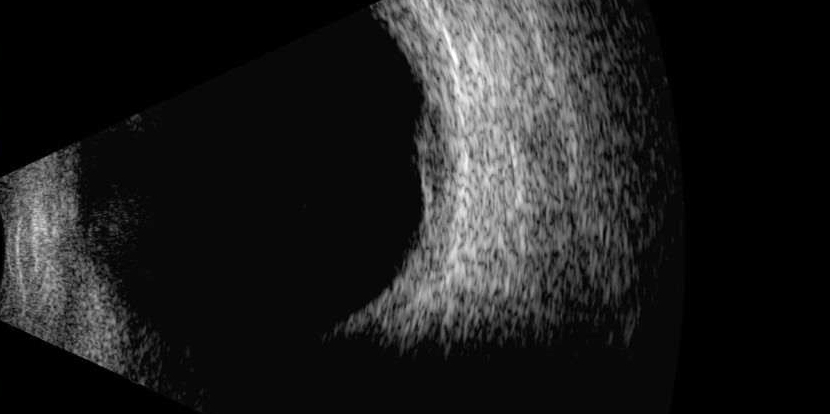
Figure 14: Benign choroidal naevi will appear flat and diffusely thickened
Malignant Melanoma
Both choroidal malignant melanoma (MM) and haemangioma appear similar in the early stages, both having a dome shaped appearance, which can often be differentiated from choroidal detachment and retinoschisis by its more uniform reflectivity (especially haemangioma). However, as an MM progresses it will take on the more typical mushroom or ‘collar stud’ appearance (figure 15).
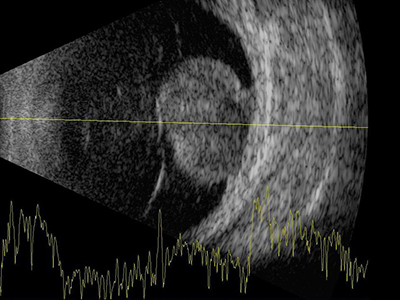
Figure 15: As malignant melanoma progresses it will take on the more typical mushroom or ‘collar stud’ appearance
Ocular Metastases
Although metastases can occur throughout the eye the uveal tract is most commonly involved with choroidal lesions particularly amenable to examination with ultrasound. Ocular metastases is most commonly secondary to breast cancer in women and in lung cancer in men. Tumours tend to be apparent in multiple post equatorial locations, are placoid or slightly dome shaped (figure 16), and are bilateral in about 20% of cases.7
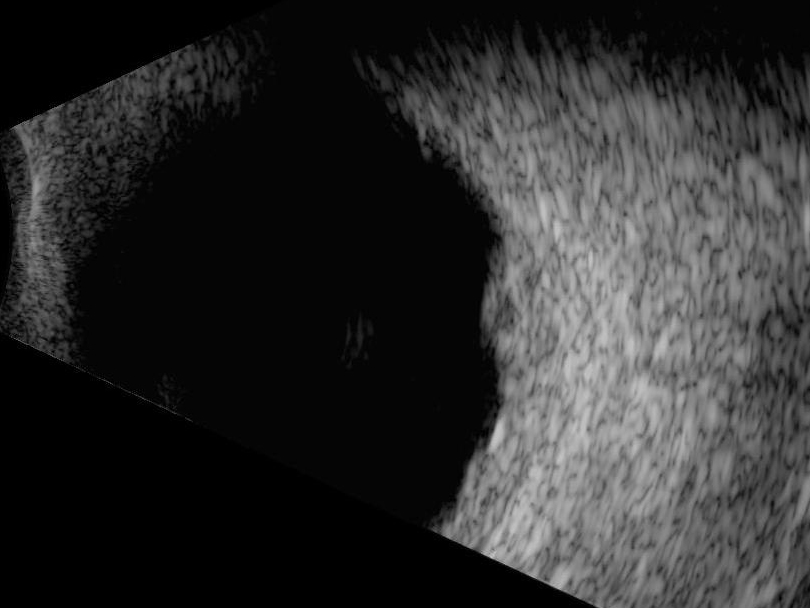
Figure 16: Ocular metastases are placoid or slightly dome shaped
Ultrasound Biomicroscopy (UBM)
UBM technology utilises a transducer which produces a high frequency ultrasound signal, with commercially available systems operating in a range of 40MHz to 60MHz. These higher frequencies allow the examination and imaging of very small structures and lesions which cannot easily be visualised using conventional examination methods such as slit lamp biomicroscopy. Structures including zonules and the ciliary body, lesions including iris cysts and treatments such as trabeculectomy can all be seen using UBM.
For the UBM examination the probe tip is housed in an appropriately cleaned and sterilised clear rigid immersion scleral shell filled with sterile water as a coupling agent. As a more comfortable alternative for the patient a soft, single use ultrasound probe cover, such as the ClearScan Bag (figure 17), consisting of an extremely thin acoustically invisible flexible film can be used, again this should be filled with sterile water. Regardless of which type of accessory is used as a coupling agent reservoir, topical anaesthetic drops should be applied to the patient’s eye prior to the examination.
Figure 17: ClearScan Bag
UBM is commonly used to examine the anterior structures of the eye, such as the iris and ciliary body for the presence of lesions and abnormalities including iris tumours (figure 18) or cystic lesions (figure 19), different types of ciliary body detachments in hypotony cases or structural damage in trauma cases where the presence of hyphema might limit visibility. However, the technique really comes into its own when identifying and recording the many structural changes associated with glaucoma.
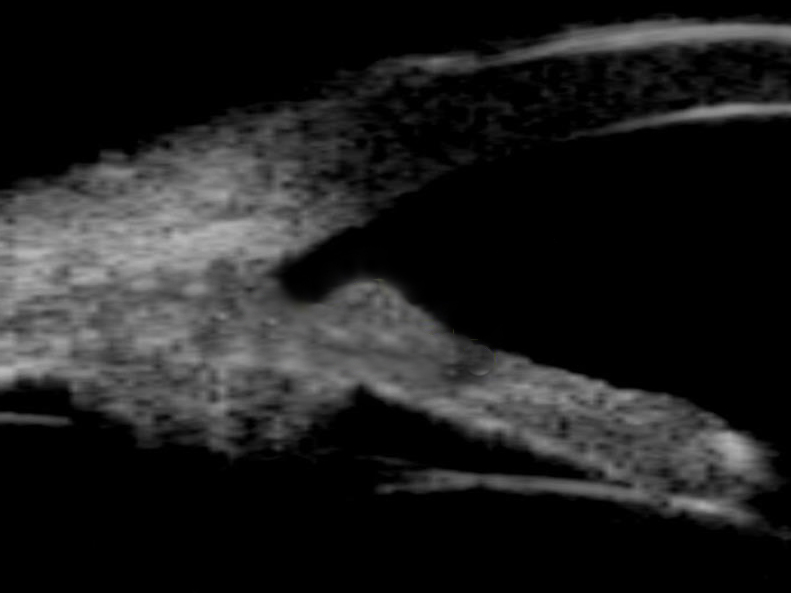
Figure 18: Iris tumour seen with ultrasound biomicroscopy
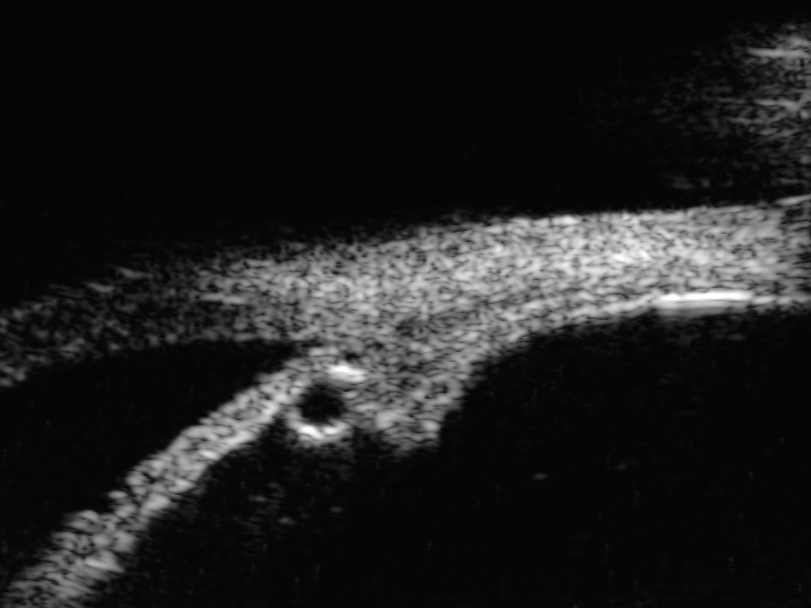
Figure 19: Cystic lesion of the peripheral iris seen with ultrasound biomicroscopy
UBM in Glaucoma
Glaucoma describes a group of conditions which impact vision as a result of damage to the optic nerve, usually, but not always associated with increased intra ocular pressure. Worldwide, the condition remains a leading cause of blindness accounting for about 2% of all visual impairment.7
Visualising the eye’s anterior segment using slit lamp biomicroscopy and gonioscopy, in particular the drainage angle at the intersection of iris and cornea – the trabecular meshwork (TM) is a well-established examination technique in patients with suspected glaucoma. Furthermore, the use of OCT offers a non-contact, non-invasive approach to imaging and measuring the drainage angle. However, structures posterior to the iris cannot easily by visualised using conventional methods such as slit lamp biomicroscopy and the heavily pigmented posterior surface of the iris will absorb coherent light used by OCT.8 High frequency ultrasound used in UBM, will not be obstructed by anterior structures making this technique ideally suited for not only recording and measuring the angle itself but creating relatively detailed images of significant changes to anatomical structures behind the iris.
The most common form of glaucoma is chronic or primary open angle glaucoma (POAG) accounting for about three quarters of cases.9 In most cases the characteristics of POAG do not lend themselves to UBM examination, with only features of pigment dispersion syndrome being well visualised with UBM. In such cases, pigment particles are deposited into the aqueous flow as a result of mechanical friction between the posterior surface of the iris and the anterior zonular bundles. These tiny particles which are distributed throughout the eyes anterior structures can be imaged using high frequency UBM.
Angle closure glaucoma (ACG) is a group of diseases where intra ocular pressure is raised as a result of the closure, either chronic or acute of the anterior chamber angle. The condition may be caused by changes or abnormalities in the size or position of the different structures of the anterior chamber, or as a result of changes to these structures caused by atypical forces originating in the eye’s posterior segment. Angle closure tends to originate in four distinct anatomic sites within the anterior chamber;10 phacomorphic glaucoma whereby the lens applies a forward force, pupillary block where resistance to aqueous flow pushes the iris up toward the cornea, an enlarged or more anteriorly positioned ciliary body which pushes the iris root against the trabecular meshwork, and force emanating from behind the iris such as that present in malignant glaucoma. With so many different potential triggers for AGC it is essential that the correct cause is identified so that appropriate treatment can be applied. The ability of UBM to differentiate between these sometimes very subtle changes in anterior segment structures make it an essential examination technique for the effective treatment and management of AGC. UBM also has a role to play in postoperative evaluation, helping to determine the effectiveness of the treatment given.
Although it is possible to use UBM to measure the drainage angle itself (figure 20), as opposed to the structural changes which lead to its closure, there are a number of limitations when comparing this approach with anterior OCT. The contact nature of UBM, even when using a scleral shell or bag UBM make the examination more uncomfortable for the patient when compared with the non-contact OCT exam. Obtaining high quality UBM images also requires a highly skilled operator in order to obtain good quality images whereas OCT images can be captured by an operator with relatively little training. Finally, the lower levels of resolution achieved with UBM when compared with modern OCT systems is a final important advantage of the light based approach, particularly evident when trying to identify the scleral spur, which is fundamental to accurate angle measurement.11
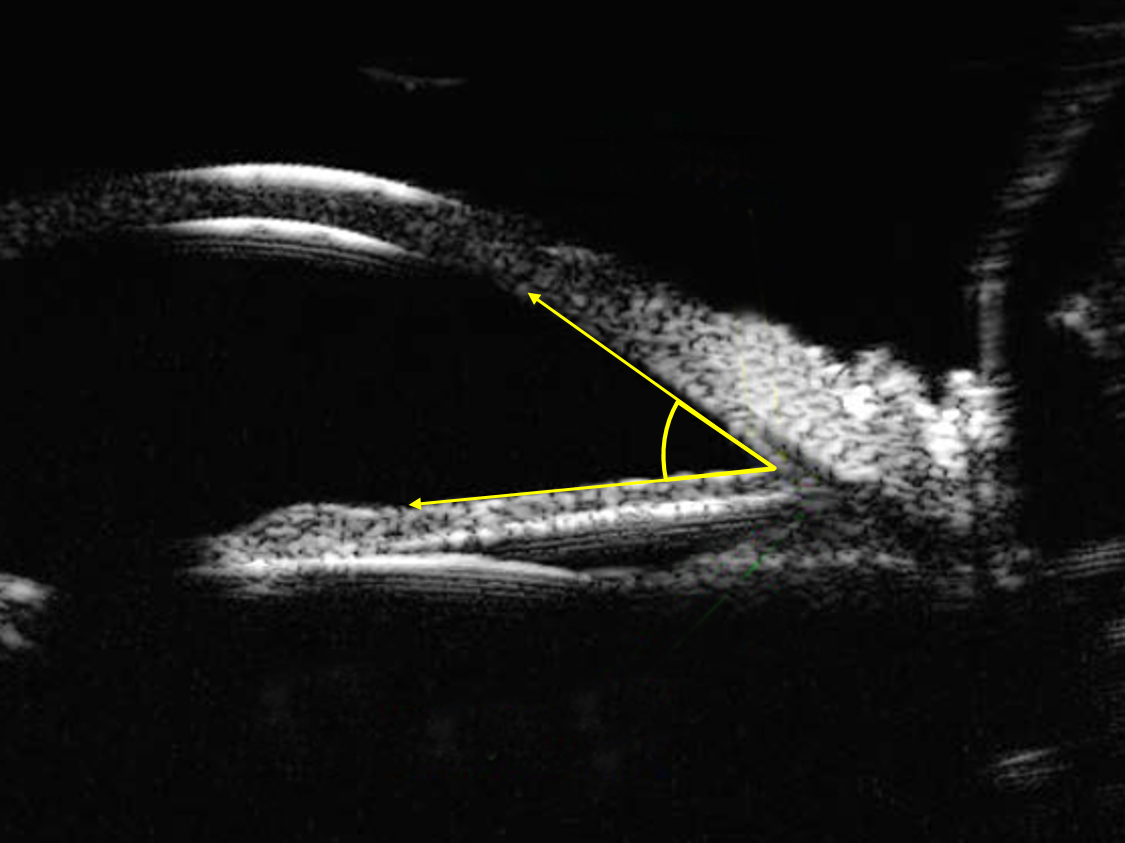
Figure 20: Drainage angle seen with ultrasound biomicroscopy
Colour Doppler Imaging
Doppler ultrasound uses a fixed source to generate an ultrasound wave which is reflected by a moving object, or, in the case of colour Doppler imaging, blood as it flows through the vessels. The method uses the Doppler shift which, in simple terms, describes the change in frequency of the reflected wave generated by an object moving towards and then away from an observer in a fixed location.
Colour Doppler imaging allows the examiner to observe blood flow as a dynamic colour image overlaid on a real-time grey scale diagnostic B-scan.5 Although the technique enjoys relatively wide-spread clinical use, particularly in cardiology, in ophthalmology, it is primarily a research tool with limited use in clinical ophthalmology.
Future Developments
A recent market report 12 has predicted that the rising prevalence of eye diseases will drive growth of about 7% in the demand for ophthalmic ultrasound imaging systems in the next five years. With both A- and B-mode, as well as new innovations continuing to play a key role in ophthalmology.
An example of recent advances in ophthalmic ultrasound technology include ring pulsed annular array devices such as the Eye Prime by Ellex whose proprietary technology transmits and receives ultrasound waves from six concentric transducers, which can be individually pulsed allowing the beam from each transducer to be focused through a wide range of depths allowing the user to focus anywhere in the posterior segment. The resulting images show a significant increase in pixel resolution and an extended depth of field, resulting in better diagnostic capability.
It is clear that the growth of the ophthalmic ultrasound devices market will continue to drive technological advances with resolution and depth penetration set to increase and software advances facilitating new advanced quantification and analytical tools. All of which is sure to be of great benefit to the patient.
Grant Duncan is a medical photographer and experienced retinal grader and Clinical Training Manager at Haag Streit UK.
Images
All images courtesy of Mr Tarek El-khashab, FRCS, DO, MBA, MSc, Ophthalmologist and Lead for Ophthalmic Ultrasound Services at Mid-Cheshire Hospitals NHS Foundation Trust and Haag-Streit UK Ltd.
References
- Lizzi F, Coleman D: History of ophthalmic ultrasound. J Ultrasound Med 2004;23:1255–1266.
- Baker JP. The history of sonographers. Journal of Ultrasound in Medicine. 2005;24:1-14. DOI: 10.7863/ jum.2005.24.1.1.
- Jacques Lewiner. Paul Langevin and the Birth of Ultrasonics. 1991 Jpn. J. Appl. Phys. 30 5.
- Sandra L. Hagen-Ansert, MS, RDMS, RDCS, FSDMS. A Timeline of Historical Events in Sonography and the Development of the SDMS: In the Beginning . . .Journal of Diagnostic Medical Sonography July/August 2006 Vol. 22, No.4.
- Carlos Eduardo Solarte and Asifa Shaikh. Ultrasound techniques in ophthalmology. 2007, DOI: 10.1016/B978-0-7506-7586-4.50017-9.
- V M L Cohen. Ocular metastases. Eye (2013) 27, 137–141; doi:10.1038/eye.2012.252; published online 7 December 2012.
- A King, A Azuara-Clanco and A Tuulonen. Glaucoma. BMJ 2013;346:f3518.
- Li H, Leung CKS, Cheung CYL, et al. Repeatability and reproducibility of anterior chamber angle measurement with anterior segment optical coherence tomography. Br J Ophthalmol 2007;91:1490–2.
- Kapetanakis VV, et al. Global variations and time trends in the prevalence of primary open angle glaucoma (POAG): a systematic review and meta-analysis. Br J Ophthalmol 2016;100:86–93. doi:10.1136/bjophthalmol-2015-307223.
- H Ishikawa and J S. Schuman. Anterior segment imaging: ultrasound biomicroscopy. Ophthalmol Clin North Am. 2004 March ; 17(1): 7–20.
- H Ishikawa. Imaging the anterior segment with OCT and UBM. Glaucoma Today 2012 Ultimate Technicians Survival Guide. Accessed on 17/05/2019 http://glaucomatoday.com/pdfs/gt0512_TG_04C_ASOCT.pdf.
- Ophthalmic Ultrasound Systems Market - Segmented by Modality (Portable and Standalone), Product, End User, and Geography - Growth, Trends, and Forecasts (2019 - 2024). Accessed on 17/05/2019 https://www.mordorintelligence.com/industry-reports/ophthalmic-ultrasound-systems-market.