In this second paper on vision and driving, current evidence linking visual function and driving will be summarised, together with discussion of visual standards for licensing, particularly in the UK, and the advice that should be communicated to patients regarding their ability to meet these visual standards. As in the first paper, evidence is drawn from relevant research, with driving outcome measures including self-reported problems with driving, crash data, and driving ability and safety as measured in simulators and under real road conditions.
Visual Function and Driving
Visual acuity
Visual acuity is the most common measure of vision included in driver licensing, despite the lack of strong evidence linking it with crash risk.1 Burg and colleagues undertook early studies in a large sample of US drivers,2 and reported a significant but only weak correlation between visual acuity and crash rates.3 Other studies using a variety of different samples and experimental designs have also found only a weak relationship,4-8 while others have failed to find any relationship.9-15 Nevertheless, drivers of private vehicles in most countries are required to meet a cut-off visual acuity of 6/12 with one or both eyes, although there is little evidence to support this cut-off value and there are variations between countries,16 as well as across states within a country, such as in the United States.17
Interestingly, while the link between visual acuity and crash risk is equivocal, one study demonstrated a significant reduction in crash risk (17%) in older drivers aged ≥ 80 years, following the introduction of a visual acuity screening law for that age group.18 Whether this reduction resulted from older adults with reduced visual acuity ceasing to drive is unclear, however, only a small proportion failed the screening (12%). In addition, a positive impact on crash risk also assumes that drivers who fail the standard are less safe. It is possible that drivers failing the visual acuity standard sought eye care and subsequently their visual function improved, which is likely given that of those who initially failed, a large proportion sought eye care and subsequently passed the standard.19 The requirement for in-person renewal has also been shown to reduce fatality rates in older drivers,20 and may be because having to attend a renewal assessment brings problem drivers to the attention of authorities. Other studies have suggested that mandatory age-based license testing leads to lower rates of driving, but does not necessarily change the prevalence of visual and cognitive impairments within the driving population.21 Interestingly, a study of European drivers reported that while most older drivers had visual function that met current visual acuity and visual field standards, the prevalence of impairments of other functions, such as contrast sensitivity and glare sensitivity, was much higher,22 suggesting that most drivers do adhere to the visual standards, but highlighting the point that these standards may not best relate to driving safety.
UK standards
The UK driver licensing requirements for visual acuity for drivers of private vehicles (Group 1 drivers) are summarised in table 1 and include two different visual acuity standards including the car registration plate (number-plate test) as well as Snellen visual acuity of 6/12. The cut- off value of 6/12 is consistent with standards worldwide, however, the requirement to also pass the number-plate test, is relevant given that the two standards are not necessarily equivalent. One study demonstrated that while all drivers with Snellen visual acuity of 6/7.5 would pass the number-plate test, some drivers with visual acuity between 6/9 and 6/12 would not.23 In addition, when contrast sensitivity is reduced, as is the case in those with cataracts, there is an increased chance that drivers may pass the Snellen chart standard but fail the number-plate test.24
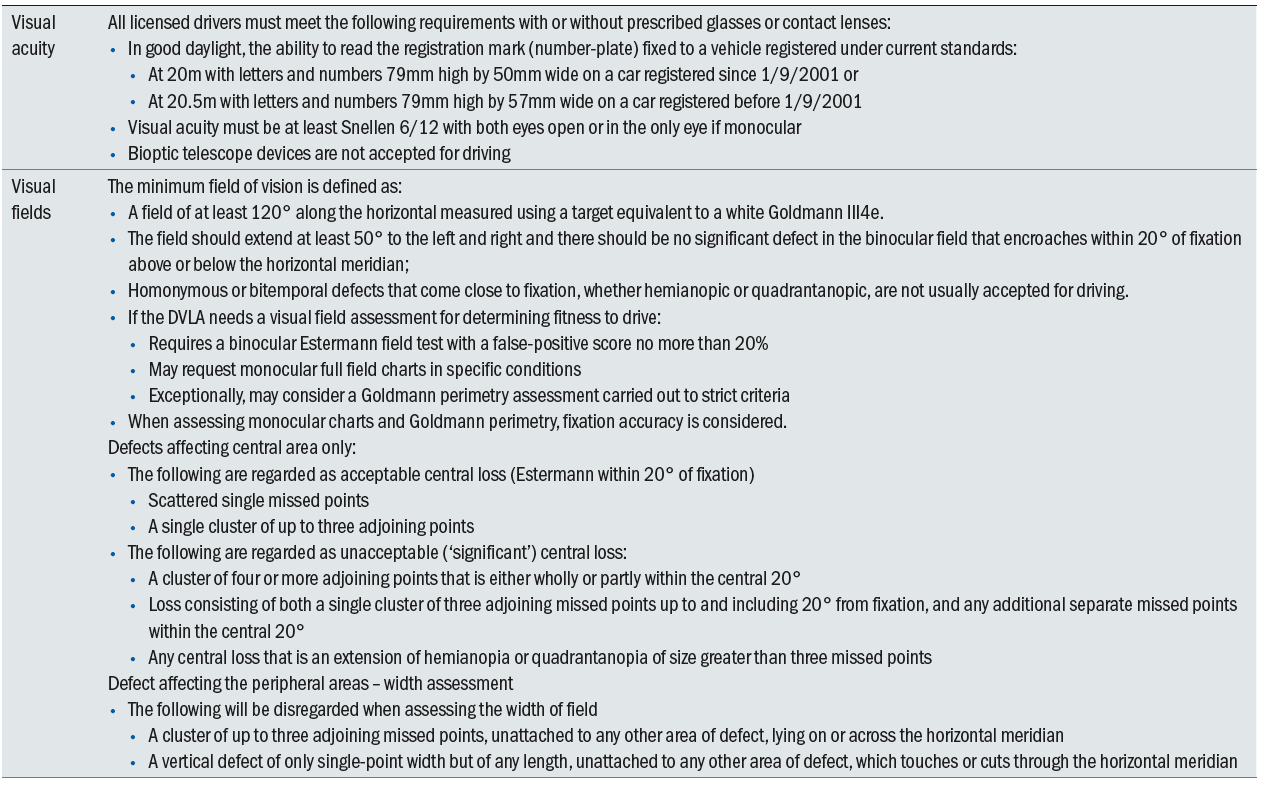
Table 1 Current UK driving vision standards for Group 1 drivers (Adapted from https://www.gov.uk/guidance/visual-disorders-assessing- fitness-to-drive#minimum-eyesight-standard)
Interestingly, spectacle-mounted bioptic telescope devices (figure 1) are not allowed in the UK for driving, although they are permitted in some US states and in countries such as the Netherlands.25 These devices comprise a telescope mounted on a carrier lens, providing a magnified view of features in the driving scene such as traffic signs, signals and pedestrians, and are commonly used by young adults with central vision loss.25 While there have been only limited numbers of studies investigating the crash risk of bioptic drivers, which have reported inconsistent results,26-29 one on-road study demonstrated that drivers with bioptic telescopes were as safe to drive as their normally sighted counterparts.30
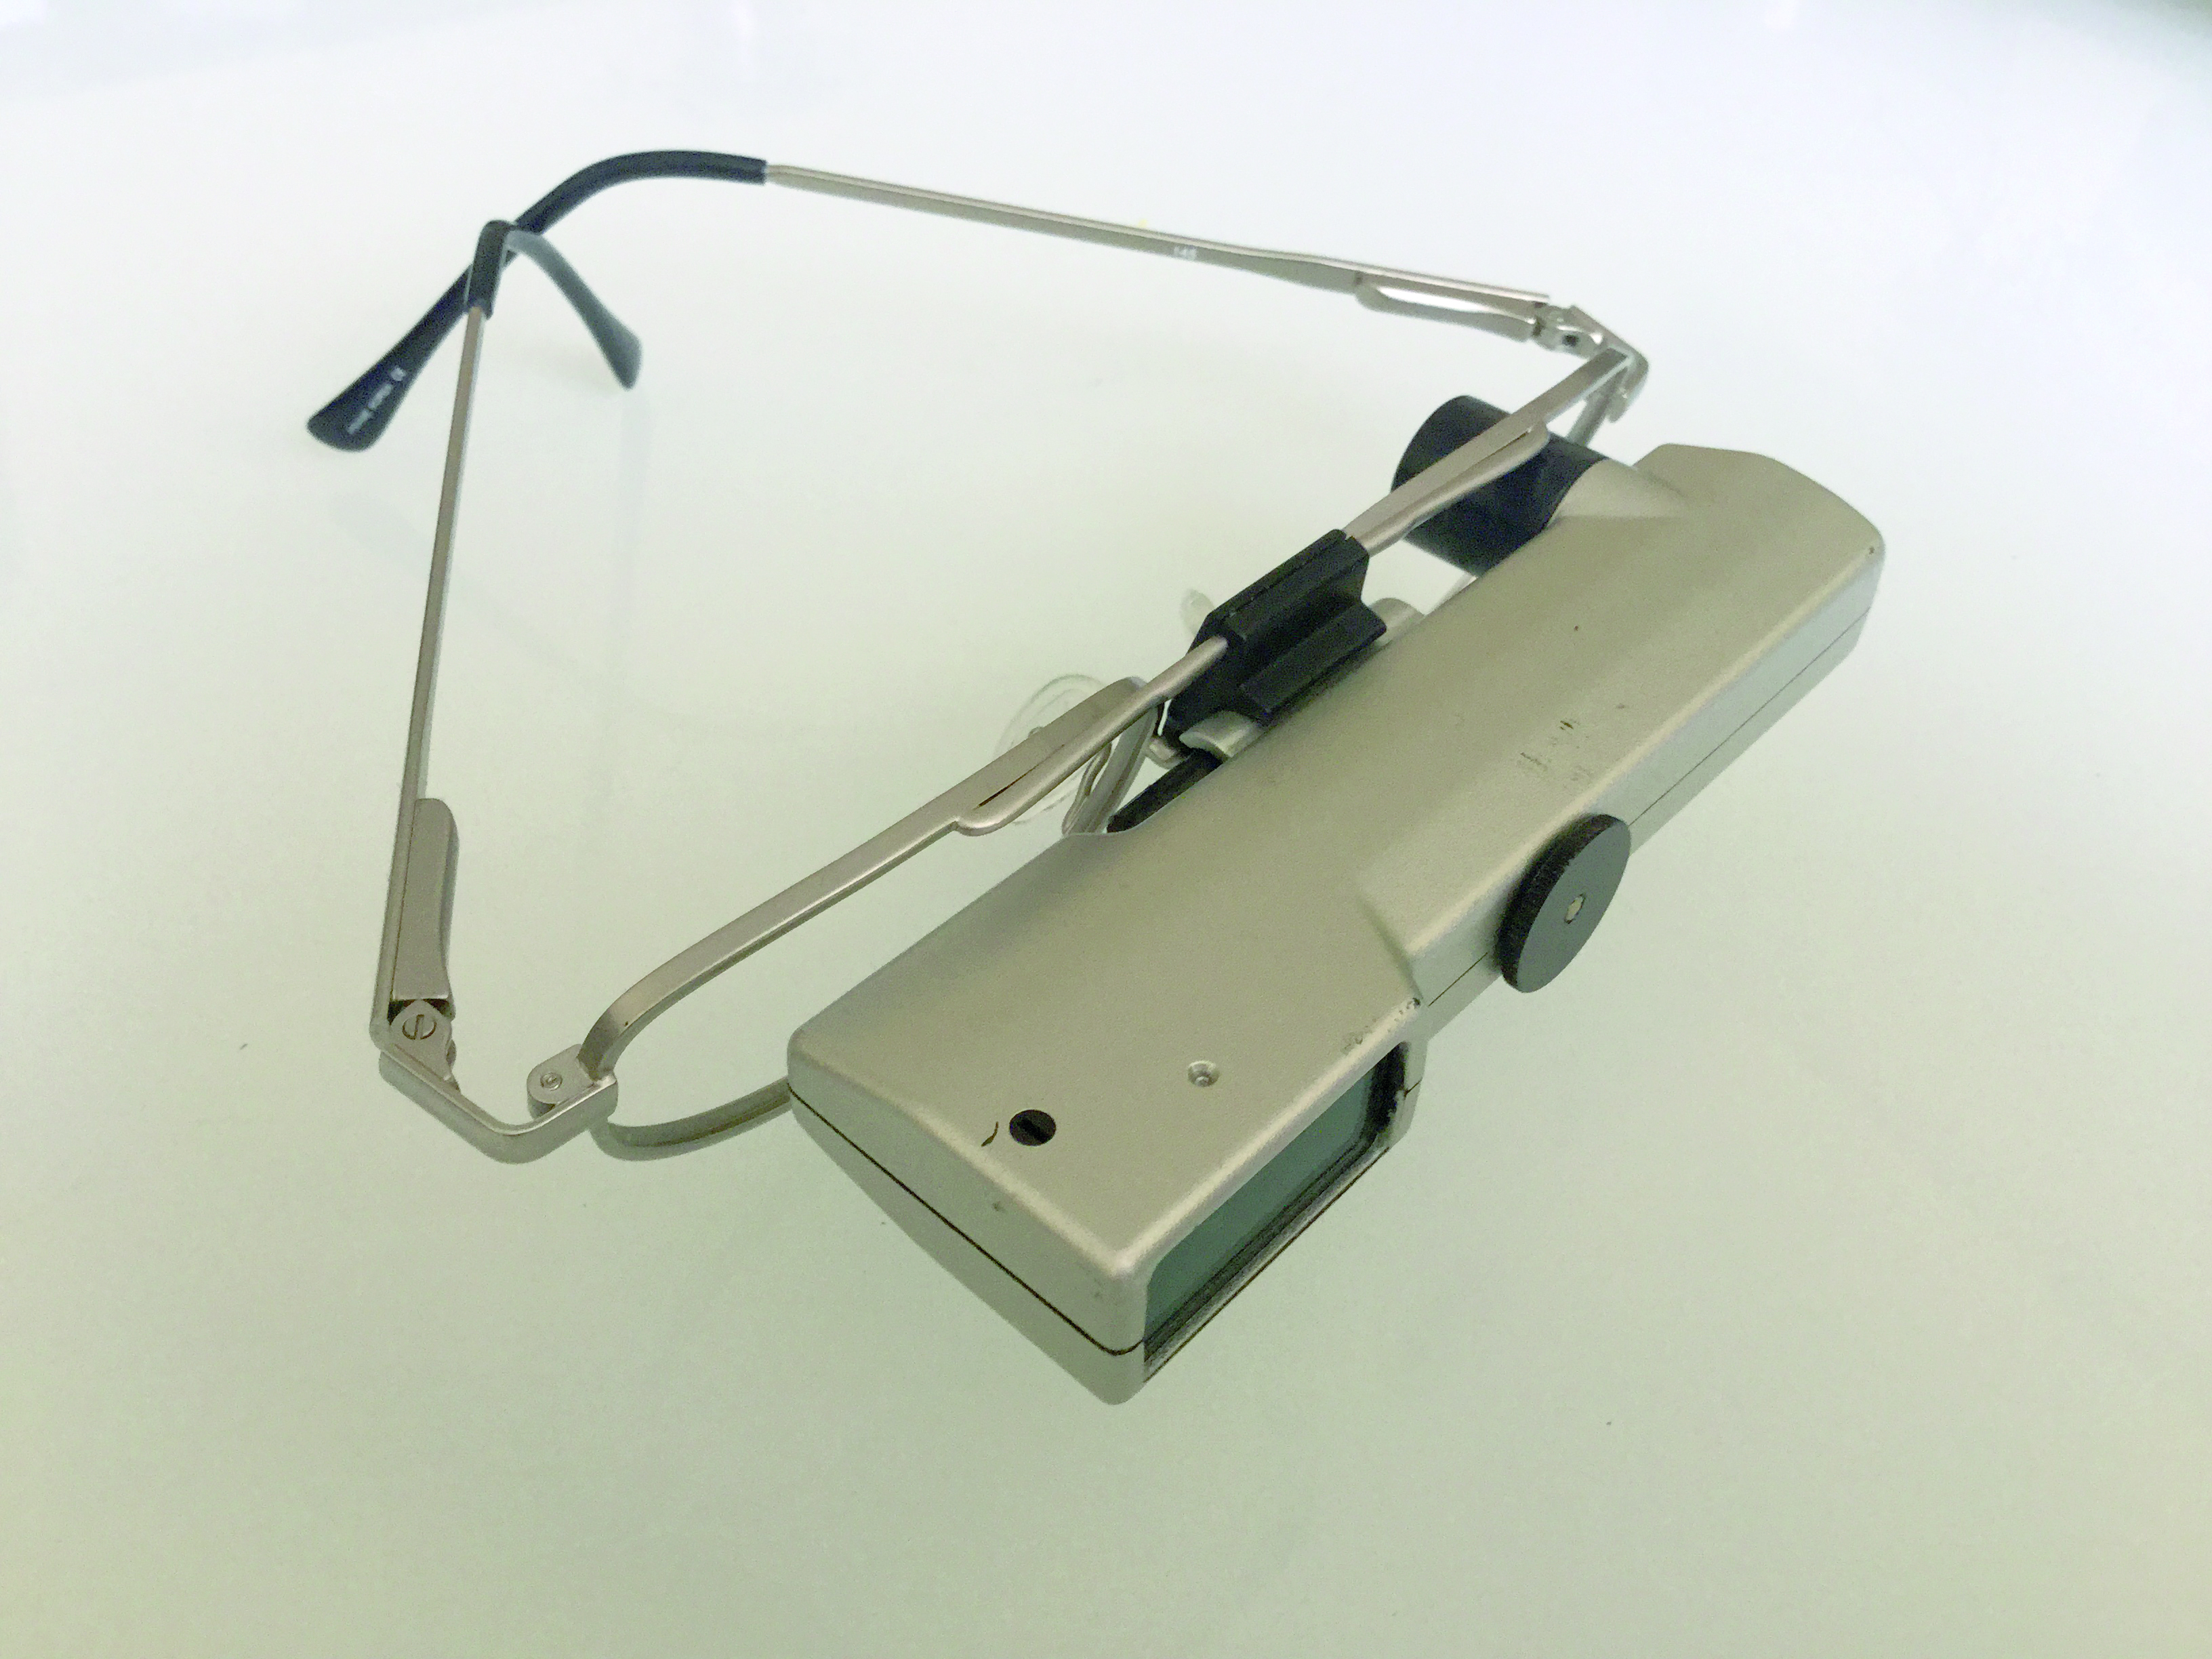
Figure 1: Spectacle-mounted bioptic telescope devices are not allowed in the UK for driving, although they are permitted in some US states and in countries such as the Netherlands
Visual fields
Visual fields are also considered important for safe driving and are included in driver licensing standards worldwide.31 However, the extent of the visual field required for safe driving remains unclear and has challenged researchers and policy makers over many years. In one of the earliest, large scale studies, Johnson and Keltner 32 reported that binocular field loss, (assessed using an early automated screening perimeter), more than doubled crash rates compared to controls, while monocular field loss did not affect crash risk (figure 2). Conversely, other studies, using a range of field instruments and testing strategies, failed to find significant relationships between field loss and crash risk.2,9,33,34 More recent research, including population-based studies,13,35 and studies of drivers with glaucomatous field defects,36-38 provide support for the suggestion that only drivers with more severe field loss have increased crash risk. This was also supported by studies of prospective crash risk recorded using naturalistic driving data,15 and on-road driving assessments which demonstrate that driving is only significantly impaired for drivers with more severe binocular defects.39-41
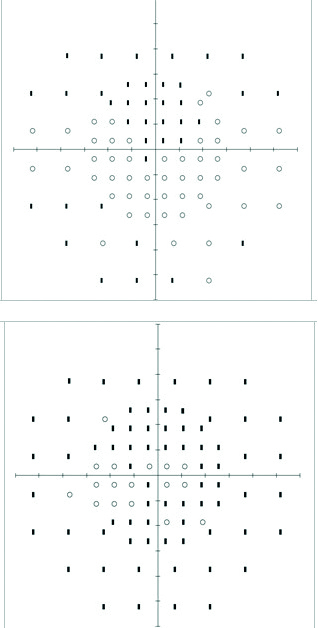
Figure 2: Two examples of binocular fields plots
The region of field loss is also relevant to driver safety. Some studies have reported that defects in the lower field are most important in terms of crash risk,13,35 and collisions in a simulator,42 while another study demonstrated that defects in the upper visual field had the most impact on computer-based hazard perception.43 Differences in sample characteristics, as well as outcome measures used to define driving ability and safety may assist in explaining these discordant findings.
There is also evidence that drivers with field defects may be able to compensate by adopting increased scanning behaviours. More extensive eye and head movements improve performance on various driving metrics in glaucomatous field loss, including laboratory-based hazard perception tests,44,45 closed road measures,46 and on-road driving performance.47 Similarly, the potential for compensation through eye and head movements has been demonstrated in drivers with hemianopic loss in simulator 48,49 and on-road studies.50,51 The issue of whether drivers can compensate for their field defects by increased scanning behaviours is an important topic of ongoing research and makes setting appropriate visual field standards for driving challenging.
Indeed, visual field requirements for driving licensure vary widely both between and within countries,31 regarding both the visual field extent considered compatible with safe driving and the methods recommended for testing. For example, while many US states require a minimum of 140° along the horizontal, some have no visual field requirements. The types of testing strategies and instrumentation also vary widely from confrontation and Goldmann kinetic perimetry to automated perimetry, most commonly the binocular Estermann visual field test (EVFT), which extends beyond the central 30° and involves suprathreshold targets. Many countries where the binocular EVFT is specified also state that there should be no ‘significant defect’ within the central 20°, defined as a cluster of four missed contiguous points, or a cluster of three point contiguous points with any additional missed points. This recommendation is included in Australia and the UK, as well as in many EU and Nordic countries,16,52 however, the basis for this precise definition of what constitutes a significant field defect is unclear. Merging the two monocular fields to form an integrated visual field has also been shown to be useful in assessing fitness to drive in patients with field defects,53,54 particularly as monocular fields are routinely measured in patients with ocular disease. Definition of the minimum visual field extent required for safe driving, however, remains unresolved and is the topic of ongoing research.
UK Standards
The UK driver licensing requirements for visual fields for drivers of private vehicles (Group 1 drivers) are summarised in Table 1. These indicate the requirement of a field extent of at least 120° along the horizontal with a target equivalent to the white Goldmann III4e, which extends 50° either side of the vertical, 20° above and below the horizontal. Hemianopic and quadrantanopic defects are considered unacceptable for driving which is in accord with many jurisdictions, despite the lack of clear evidence that all drivers with these field defects are unsafe to drive. Indeed, as stated in the previous section, the fact that some studies have demonstrated the potential for compensation for hemianopic field loss using increased head and eye movements,50,51 makes licensing decisions for these patients very challenging.
As stated in the previous section, the definition of what constitutes significant field loss within the central 20° are now more precise, being defined as a cluster of four missed contiguous points, or a cluster of three contiguous points with any additional missed points measured with the binocular EVFT (table 1). Indeed, given the lack of strong evidence defining visual field standard cut-offs for driving, it has been suggested that drivers who fail to meet standards should have the opportunity to undergo on-road testing to demonstrate their potential for safe driving. This is supported by studies demonstrating that many drivers who fail to meet visual field standards demonstrate safe driving ability.55,56
Contrast Sensitivity
It has been suggested that other visual measures, including contrast sensitivity and motion sensitivity, might better predict driving safety than the standard measures currently included in licensing standards. Contrast sensitivity (figure 3) is believed to be a better measure of central vision for driving than visual acuity, as the driving environment comprises different contrast levels as well as spatial frequencies.

Figure 3: Contrast sensitivity is believed to be a better measure of central vision for driving than visual acuity
Contrast sensitivity was shown to be associated with crash rates in a general population study,9 where a visual screening battery including contrast sensitivity, visual acuity and fields was predictive of crash rates in older drivers. In addition, impaired contrast sensitivity has been shown to be associated with retrospective,57 but not prospective crashes.13,14,18,34 Reduced contrast sensitivity in the worse eye predicts crash risk, major crashes and at-fault crashes in naturalistic driving studies,15 and in drivers with cataracts,58 where those who had experienced a crash, were eight times more likely to have reduced contrast sensitivity than controls. This latter finding is supported by closed road studies of drivers with cataracts, where contrast sensitivity was strongly associated with driving performance,59 and improvements in driving following cataract surgery.60
Motion sensitivity
The ability to detect moving targets is considered relevant for driving, given the dynamic nature of the driving environment. Dynamic acuity, where acuity is measured for moving rather than static targets, is commonly used to assess motion sensitivity in driving studies.2 Dynamic acuity decreases with age,61 and was shown to have a higher correlation with crashes than other measures in earlier studies.2,62,63 However, while these relationships were significant, they were still modest. A major problem with the assessment of dynamic visual acuity is that there is no standard way of measuring it. More recent research has assessed the ability to detect motion using computer-based tests of motion discrimination and detection, which are strongly correlated with safe driving in older adults.59,64-67 Motion perception has also been strongly linked to self-reported losses of attention using questionnaire measures.64-66 While more research is required in this area these measures of motion sensitivity, which can be easily measured using computer-based systems, are promising and merit further research.
Visual processing and divided attention: Useful Field of View
The ability of the Useful Field of View (UFOV) to predict driving safety has been widely investigated.68-70 The UFOV is a computer-based test that involves simultaneous identification of central and peripheral targets in the presence or absence of distractors, and assesses selective and divided attention and visual processing speeds which decrease with age 68 and are believed to reflect the driving problems experienced by older adults.
A reduction in UFOV performance (increased time to detect and identify the location of the peripheral targets) strongly predicts retrospective57,71 and prospective crashes in general populations of older adults,13,14,34 as well as in those with glaucoma,37,72 and near miss crashes in naturalistic studies.15 Owsley et al11 found that a 40% reduction in the UFOV was associated with a 16 times higher likelihood of an injurious crash than were those with little or no UFOV reduction. Studies have also reported strong associations between reduced UFOV scores and unsafe on-road driving performance,59,73 and driving simulator performance.74 The UFOV has also been shown to predict prospective crashes when used in a driver licensing setting,75 providing further support for its application for screening older drivers.
Glare
While glare difficulties are commonly cited for driving (figure 4), particularly for older drivers at night,76 the association between glare and driving is poorly defined.17 This arises partly because of the lack of standard tests of glare sensitivity, and also that the term glare has been used to describe quite different phenomena (disability and discomfort glare). Disability glare describes the reduction in visual performance from scattered light from a glare source and increases with age, particularly in cataracts.77 Discomfort glare is the sensation of discomfort in the presence of glare and, while not impairing visual function, can be startling and distracting, and is wavelength dependent, being greater at shorter wavelengths.78 Disability glare is most often considered in relation to driving and may cause difficulties at dawn and dusk from the low-sun and at night from oncoming headlights, and significantly reduces the ability to detect pedestrians at night.79-83 While one study failed to find an association between disability glare and at-fault crash-rates in drivers with cataracts,58 others have found a relationship;13 with the effects of glare on night-time driving being shown to be predicted by mesopic rather than standard photopic vision measures.82

Figure 4: Glare difficulties are commonly cited for driving
Non-visual predictors of driving safety
While this paper has focused on visual predictors of driving, it is also important to recognise that the driving task is complex and also involves cognitive and motor skills.84 Numerous studies have highlighted the predictive capacity of impaired cognitive function on driving safety, particularly executive function and processing speed, as measured using tests such as Trail Making Test.85-87 Measures of sensorimotor and physical function, including vibration sense, quadriceps strength and postural sway have also been shown to predict driving ability and safety in older adults.88 Indeed, combining tests from multiple domains that assess vision, cognition and motor skills has been shown to better predict driving ability than vision tests alone.67,89 Research in this area is ongoing, involving assessing these multi-domain batteries in large studies of older drivers with a range of impairments, and developing rapid and practical test batteries that can be incorporated into clinical practice.
Implications for licensing
As indicated in the preceding sections, the evidence supporting commonly adopted tests of visual function in licensing standards is mixed. While there is growing evidence that alternative measures, including the UFOV, contrast sensitivity and motion sensitivity, as well as multi-domain batteries, may be more relevant to driving safety, the evaluation and validation of these tests has yet to be completed. It is imperative that any tests incorporated into licensing or screening for driving are rigorously evaluated to ensure that unsafe drivers are identified, while those who are safe to drive do so for as long as possible. This is particularly relevant for older drivers, given clear evidence that driving cessation has important negative consequences including depression and associated functional impairment.90,91
Advice to drivers
It is important for optometrists to maintain an up-to-date knowledge of the vision and driving literature and the visual licensing standards for driving, to ensure that appropriate advice is provided to their patients regarding their driving.
Meeting visual standards
The standards depend on the type of license that the patient is applying for, either Group 1 or Group 2; with the standards for Group 2 drivers being more stringent than for Group 1.92 In some jurisdictions, patients can apply for a conditional license, where a person who fails to meet visual standards can continue to drive, as long as certain conditions are met, such as daytime driving only; this option provides a potential mechanism for maintaining driver independence in patients with visual impairment.
Record advice
A critical issue is to always maintain good records of all advice provided to patients, regarding whether they meet the relevant visual licensing standards and whether these are met with or without refractive correction. In a recent focus group study, it was interesting that many participants reported they had received no advice regarding vision and driving from their optometrist, or that it was too vague, and they were unclear whether they needed to wear their correction for driving.93 Recording all conversations in the record card avoids any ambiguity about whether such advice has been provided and by confirming this with the patient allows another opportunity to reinforce advice regarding vision and driving.
Meeting vision standards does not guarantee good driving vision
Patients also need to understand that having good vision does not simply enable them to read a number plate or road signs but importantly, enables them to identify and react quickly to road hazards, particularly at night. Even if patients meet the visual standards for driving, it does not necessarily guarantee adequate vision for driving, as other aspects of vision are also important, as discussed in this paper. Having visual standards does, however, provide a cue to drivers to consider vision for driving, as relying on patients to self-report their vision problems is problematic and relies on public awareness of visual standard requirements which is typically limited. In addition, as outlined in the first paper in this series, many drivers do not notice gradual deteriorations in their vision, emphasising the importance of regular eye examinations.
Professor Joanne M Wood is based at the School of Optometry and Vision Science and Institute of Health and Biomedical Innovation, Queensland University of Technology, Brisbane, Australia.
Acknowledgments
Preparation of this paper was supported by NHMRC 1008145 and NHMRC 1045024 and ARC Discovery 190103141
References
- Charman WN. Vision and driving - a literature review and commentary. Ophthalmic & Physiological Optics 1997;17:371-391.
- Burg A. The relationship between vision test scores and driving record: General findings. Los Angeles: Department of Engineering, University of California - Los Angeles; 1967:1-89.
- Hills BL, Burg A. A reanalysis of California driver vision data: general findings. Crowthorne, Berkshire: Transport and Road Research Laboratories; 1977:1-15.
- Hofstetter HW. Visual acuity and highway accidents. Journal of the American Optometric Association 1976;47:887-893.
- Davison PA. Inter-relationships between British drivers’ visual abilities, age and road accident histories. Ophthalmic & Physiological Optics 1985;5:195-204.
- Gresset J, Meyer F. Risk of accidents among elderly car drivers with visual acuity equal to 6/12 or 6/15 and lack of binocular vision. Ophthalmic & Physiological Optics 1994;14:33-37.
- Marottoli RA, Richardson, E.D., Stowe, M.H., Miller, E.G., Brass, L.M., Cooney, L.M. & Tinetti, M.E. Development of a test battery to identify older drivers at risk for self- reported adverse driving events. Journal of the American Geriatrics Society 1998;46:562-568.
- Ivers RQ, Mitchell P, Cumming RG. Sensory impairment and driving: The Blue Mountains eye study. American Journal of Public Health 1999;89:85-87.
- Decina LE, Staplin L. Retrospective evaluation of alternative vision screening criteria for older and younger drivers. Accident Analysis & Prevention 1993;25:267-275.
- McCloskey LW, Koepsell TD, Wolf ME, Buchner DM. Motor vehicle collision injuries and sensory impairments of older drivers. Age & Ageing 1994;23:267-272.
- Owsley C, Ball K, McGwin G, Jr., et al. Visual processing impairment and risk of motor vehicle crash among older adults. Journal of the American Medical Association 1998;279:1083-1088.
- Keeffe JE, Jin CF, Weih LM, McCarty CA, Taylor HR. Vision impairment and older drivers: who’s driving? British Journal of Ophthalmology 2002;86:1118-1121.
- Rubin GS, Ng ES, Bandeen-Roche K, Keyl PM, Freeman EE, West SK. A prospective, population-based study of the role of visual impairment in motor vehicle crashes among older drivers: the SEE study. Investigative Ophthalmology & Visual Science 2007;48:1483-1491.
- Cross JM, McGwin G, Jr., Rubin GS, et al. Visual and medical risk factors for motor vehicle collision involvement among older drivers. British Journal of Ophthalmology 2009;93:400-404.
- Huisingh C, Levitan EB, Irvin MR, MacLennan P, Wadley V, Owsley C. Visual sensory and visual-cognitive function and rate of crash and near-crash involvement among older drivers using naturalistic driving data. Investigative Ophthalmology & Visual Science 2017;58:2959-2967.
- Bro T, Lindblom B. Strain out a gnat and swallow a camel? - vision and driving in the Nordic countries. Acta Ophthalmologica 2018;96:623-630.
- Owsley C, McGwin G, Jr. Vision and driving. Vision Research 2010;50:2348-2361.
- McGwin G, Jr., Sarrels SA, Griffin R, Owsley C, Rue LW, 3rd. The impact of a vision screening law on older driver fatality rates. Archives of Ophthalmology 2008;126:1544- 1547.
- McGwin G, Jr., McCartt AT, Braitman KA, Owsley C. Survey of older drivers’ experiences with Florida’s mandatory vision re-screening law for licensure. Ophthalmic Epidemiology 2008;15:121-127.
- Grabowski DC, Campbell CM, Morrisey MA. Elderly licensure laws and motor vehicle fatalities. Journal of the American Medical Association 2004;291:2840-2846.
- Ross LA, Browning C, Luszcz MA, Mitchell P, Anstey KJ. Age-based testing for driver’s license renewal: potential implications for older Australians. Journal of the American Geriatrics Society 2011;59:281-285.
- van Rijn LJ, Nischler C, Michael R, et al. Prevalence of impairment of visual function in European drivers. Acta Ophthalmologica 2011;89:124-131.
- Latham K, Katsou MF, Rae S. Advising patients on visual fitness to drive: implications of revised DVLA regulations. British Journal of Ophthalmology 2015;99:545-548.
- Rae S, Latham K, Katsou MF. Meeting the UK driving vision standards with reduced contrast sensitivity. Eye 2016;30:89-94.
- Owsley C. Driving with bioptic telescopes: organizing a research agenda. Optometry & Vision Science 2012;89:1249-1256.
- Korb DR. Preparing the visually handicapped person for motor vehicle operation. American Journal of Optomometry & Archives of the American Academy of Optometry 1970;47:619-628.
- Lippman O, Corn AL, Lewis MC. Bioptic telescopic spectacles and driving performance: a study in Texas. Journal of Visual Impairment & Blindness 1988;82:182-187.
- Janke M. Accident rates of drivers with bioptic telescopes. Journal of Safety Research 1983;14:159-165.
- Vincent C, Lachance JP, Deaudelin I. Driving performance among bioptic telescope users with low vision two years after obtaining their driver’s license: a quasi- experimental study. Assistive Technology 2012;24:184-195.
- Wood JM, McGwin G, Jr., Elgin J, Searcey K, Owsley C. Characteristics of on-road driving performance of persons with central vision loss who use bioptic telescopes. Investigative Ophthalmology & Visual Science 2013;54:3790-3797.
- Yan MK, Kumar H, Kerr N, et al. Transnational review of visual standards for driving: How Australia compares with the rest of the world. Clinical & Experimental Ophthalmology 2019;47:847-863.
- Johnson CA, Keltner JL. Incidence of visual field loss in 20,000 eyes and its relationship to driving performance. Archives of Ophthalmology 1983;101:371-375.
- Council FM, Allen JA. A study of the visual fields of North Carolina drivers and theri relationship to accidents. Chapel Hill: University of North Carolina. Highway Research Safety Centre; 1974.
- Owsley C, McGwin G, Jr., Ball K. Vision impairment, eye disease, and injurious motor vehicle crashes in the elderly. Ophthalmic Epidemiology 1998;5:101-113.
- Huisingh C, McGwin G, Jr., Wood J, Owsley C. The driving visual field and a history of motor vehicle collision involvement in older drivers: a population-based examination. Investigative Ophthalmology & Visual Science 2015;56:132-138.
- McGwin G, Jr., Xie A, Mays A, et al. Visual field defects and the risk of motor vehicle collisions among patients with glaucoma. Investigative Ophthalmology & Visual Science 2005;46:4437-4441.
- Haymes SA, Leblanc RP, Nicolela MT, Chiasson LA, Chauhan BC. Risk of falls and motor vehicle collisions in glaucoma. Investigative Ophthalmology & Visual Science 2007;48:1149-1155.
- Kwon M, Huisingh C, Rhodes LA, McGwin G, Jr., Wood JM, Owsley C. Association between Glaucoma and At-fault Motor Vehicle Collision Involvement among Older Drivers: A Population-based Study. Ophthalmology 2016;123:109-116.
- Bowers A, Peli E, Elgin J, McGwin G, Owsley C. On-road driving with moderate visual field loss. Optometry & Vision Science 2005;82:657-667.
- Racette L, Casson EJ. The impact of visual field loss on driving performance: evidence from on-road driving assessments. Optometry & Vision Science 2005;82:668-674.
- Wood JM, McGwin G, Jr., Elgin J, et al. On-road driving performance by persons with hemianopia and quadrantanopia. Investigative Ophthalmology & Visual Science 2009;50:577-585.
- Kunimatsu-Sanuki S, Iwase A, Araie M, et al. The role of specific visual subfields in collisions with oncoming cars during simulated driving in patients with advanced glaucoma. British Journal of Ophthalmology 2017;101:896-901.
- Glen FC, Smith ND, Crabb DP. Impact of superior and inferior visual field loss on hazard detection in a computer-based driving test. British Journal of Ophthalmology 2015;99:613-617.
- Crabb DP, Smith ND, Rauscher FG, et al. Exploring eye movements in patients with glaucoma when viewing a driving scene. PloS One 2010;5:e9710.
- Lee SS, Black AA, Wood JM. Effect of glaucoma on eye movement patterns and laboratory-based hazard detection ability. PLoS One 2017;12:e0178876.
- Lee SS, Black AA, Wood JM. Scanning behavior and daytime driving performance of older adults with glaucoma. Journal of Glaucoma 2018;27:558-565.
- Kubler TC, Kasneci E, Rosenstiel W, et al. Driving with Glaucoma: Task Performance and Gaze Movements. Optometry & Vision Science 2015;92:1037-1046.
- Bowers AR, Ananyev E, Mandel AJ, Goldstein RB, Peli E. Driving with hemianopia: IV. Head scanning and detection at intersections in a simulator. Investigative Ophthalmology & Visual Science 2014;55:1540-1548.
- Papageorgiou E, Hardiess G, Mallot HA, Schiefer U. Gaze patterns predicting successful collision avoidance in patients with homonymous visual field defects. Vision Research 2012;65:25-37.
- Wood JM, McGwin G, Jr., Elgin J, et al. Hemianopic and quadrantanopic field loss, eye and head movements, and driving. Investigative Ophthalmology & Visual Science 2011;52:1220-1225.
- Kasneci E, Sippel K, Aehling K, et al. Driving with binocular visual field loss? A study on a supervised on-road parcours with simultaneous eye and head tracking. PloS One 2014;9:e87470.
- Bron AM, Viswanathan AC, Thelen U, et al. International vision requirements for driver licensing and disability pensions: using a milestone approach in characterization of progressive eye disease. Clinical Ophthalmology 2010;4:1361-1369.
- Crabb DP, Fitzke FW, Hitchings RA, Viswanathan AC. A practical approach to measuring the visual field component of fitness to drive. British Journal of Ophthalmology 2004;88:1191-1196.
- Chisholm CM, Rauscher FG, Crabb DC, et al. Assessing visual fields for driving in patients with paracentral scotomata. British Journal of Ophthalmology 2008;92:225-230.
- Dow J. Visual field defects may not affect safe driving. Traffic Injury Prevention 2011;12:483-490.
- Muir C, Charlton JL, Odell M, et al. Medical review licensing outcomes in drivers with visual field loss in Victoria, Australia. Clinical & Experimental Optometry 2016;99:462- 468.
- Ball K, Owsley C, Sloan ME, Roenker DL, Bruni JR. Visual attention problems as a predictor of vehicle crashes in older drivers. Investigative Ophthalmology & Visual Science 1993;34:3110-3123.
- Owsley C, Stalvey BT, Wells J, Sloane ME, McGwin G, Jr. Visual risk factors for crash involvement in older drivers with cataract. Archives of Ophthalmology 2001;119:881- 887.
- Wood JM. Age and visual impairment decrease driving performance as measured on a closed-road circuit. Human Factors 2002;44:482-494.
- Wood JM, Carberry TP. Bilateral cataract surgery and driving performance. British Journal of Ophthalmology 2006;90:1277-1280.
- Long GM, Crambert RF. The nature and basis of age-related changes in dynamic visual acuity. Psychology & Aging 1990;5:138-143.
- Henderson RL, Burg A. The role of vision and audition in truck and bus driving. Washington, DC: Department of Transportation. Federal Highway Administration; 1973.
- Shinar D, Mayer RM, Treat JR. Reliability and validity assessments of a newly developed battery of driving-related vision tests. 19th Annual Meeting of the American Association for Automotive Medicine. San Diego, USA; 1975.
- Henderson S, Donderi DC. Peripheral motion contrast sensitivity and older drivers’ detection failure accident risk. Proceedings of the Third International Driving Symposium on Human Factors in Driver Assessment, Training and Vehicle Design. Rockport, Maine; 2005:41-50.
- Henderson S, Gagnon S, Bélanger A, Tabone R, Collin C. Near peripheral motion detection threshold correlates with self-reported failures of attention in younger and older drivers. Accident Analysis & Prevention 2010;42:1189-1194.
- Raghuram A, Lakshminarayanan V. Motion perception tasks as potential correlates to driving difficulty in the elderly. Journal of Modern Optics 2006;53:1343 - 1362.
- Wood JM, Anstey KJ, Kerr GK, Lacherez P, Lord S. A multi-domain approach for predicting older driver safety under in-traffic road conditions. Journal of the American Geriatrics Society 2008;56:986-993.
- Ball KK, Beard BL, Roenker DL, Miller RL, Griggs DS. Age and visual search: expanding the useful field of view. Journal of the American Optometric Association 1988;5:2210-2219.
- Ball K, Owsley C. The useful field of view test: A new technique for evaluating age- related declines in visual function. Journal of the American Optometric Association 1993;63:71-79.
- Wood JM, Owsley C. Useful field of view test. Gerontology 2014;60:315-318.
- Owsley C, Ball, K., Sloane, M.E., Roenker, D.L. & Bruni, J.R. Visual/cognitive correlates of vehicle accidents in older drivers. Psychology & Aging 1991;6:403-415.
- Gracitelli CP, Tatham AJ, Boer ER, et al. Predicting Risk of Motor Vehicle Collisions in Patients with Glaucoma: A Longitudinal Study. PLoS One 2015;10:e0138288.
- Myers RS, Ball KK, Kalina TD, Roth DL, Goode KT. Relation of useful field of view and other screening tests to on-road driving performance. Perceptual Motor Skills 2000;91:279-290.
- Roenker DL, Cissell GM, Ball KK, Wadley VG, Edwards JD. Speed-of-processing and driving simulator training result in improved driving performance. Human Factors 2003;45:218-233.
- Ball K, Roenker DL, Wadley VG, et al. Can High-Risk Older Drivers Be Identified Through Performance-Based Measures in a Department of Motor Vehicles Setting? American Geriatrics Society 2006;54:77-84.
- Kimlin JA, Black AA, Djaja N, Wood JM. Development and validation of a vision and night driving questionnaire. Ophthalmic & Physiological Optics 2016;36:465-476.
- Elliott DB, Bullimore MA. Assessing the reliability, discriminative ability, and validity of disability glare tests. Investigative Ophthalmology & Visual Science 1993;34:108-119.
- Bullough JD. Spectral sensitivity for extrafoveal discomfort glare. Journal of Modern Optics 2009;56:1518-1522.
- Wood JM, Tyrrell RA, Carberry TP. Limitations in drivers’ ability to recognize pedestrians at night. Human Factors 2005;47:644-653.
- Whetsel Borzendowski SA, Stafford Sewall AA, Rosopa PJ, Tyrrell RA. Drivers’ judgments of the effect of headlight glare on their ability to see pedestrians at night. Journal of Safety Research 2015;53:31-37.
- Wood JM, Tyrrell RA, Chaparro A, Marszalek RP, Carberry TP, Chu BS. Even moderate visual impairments degrade drivers’ ability to see pedestrians at night. Investigative Ophthalmology & Visual Science 2012;53:2586-2592.
- Kimlin JA, Black AA, Wood JM. Nighttime Driving in Older Adults: Effects of Glare and Association With Mesopic Visual Function. Investigative Ophthalmology & Visual Science 2017;58:2796-2803.
- Theeuwes J, Alferdinck JWAM, Perel M. Relation between glare and driving performance. Human Factors 2002;44:95-107.
- Anstey KJ, Wood J, Lord S, Walker JG. Cognitive, sensory and physical factors enabling driving safety in older adults. Clinical Psychology Review 2005;25:45-65.
- Staplin L, Gish KW, Sifrit KJ. Using cognitive status to predict crash risk: blazing new trails? Journal of Safety Research 2014;48:19-25.
- Duncanson H, Hollis AM, O’Connor MG. Errors versus speed on the trail making test: Relevance to driving performance. Accident Analysis & Prevention 2018;113:125-130.
- Anstey KJ, Horswill MS, Wood JM, Hatherly C. The role of cognitive and visual abilities as predictors in the Multifactorial Model of Driving Safety. Accident Analysis & Prevention 2012;45:766-774.
- Lacherez P, Wood JM, Anstey KJ, Lord SR. Sensorimotor and postural control factors associated with driving safety in a community-dwelling older driver population. Journals of Gerontology Series A: Biological Sciences & Medical Sciences 2014;69:240-244.
- Wood JM, Horswill MS, Lacherez PF, Anstey KJ. Evaluation of screening tests for predicting older driver performance and safety assessed by an on-road test. Accident Analysis & Prevention 2013;50:1161-1168.
- Windsor TD, Anstey KJ, Butterworth P, Luszcz MA, Andrews GR. The role of perceived control in explaining depressive symptoms associated with driving cessation in a longitudinal study. The Gerontologist 2007;47:215-223.
- Marottoli RA, Mendes de Leon CF, Glass TA, et al. Driving cessation and increased depressive symptoms: Prospective evidence from the New Haven EPESE Established Populations for Epidemiologic Studies of the Elderly. Journal of the American Geriatric Society 1997;45:202-206.
- Hughes A, Fylan, F., Wood, J.M., Elliott, D.B. We need to talk about driving. Optometry in Practice (Online) ISSN 2517-5696 2019;20.
- Fylan F, Hughes, A., Wood, J.M., Elliott, D.B. Why do people drive when they can’t see clearly? Transportation Research Part F: Traffic Psychology & Behaviour 2018;F56:123-133.