Our ability to perceive our visual environment originates at the level of the retina, where light is detected by rod and cone photoreceptors and converted into an electrical signal. This signal travels through the visual pathway to culminate at the visual cortex.1 The advent of new technology, such as OCT and fundus autofluorescence (FAF), allows the clinician to assess changes in retinal and, importantly, macular morphology.2 What these technologies lack, however, is an insight into the functional deficit caused by conditions such as age-related macular degeneration (AMD) and, as will be discussed in this article, early deficits that precede structural change. An understanding of how age and disease impact upon retinal function allows techniques able to detect such changes to be adapted for use as sensitive tests for early disease detection, well before significant structural and functional damage has become established.
To begin, an overview of the anatomy and biochemical physiology of the photoreceptors, in particular the rods, is important to this
discussion.
A brief revision of anatomy
The macula can considered to cover an area with a diameter of 5 to 6mm which is centred some 21.5º of visual angle from the fovea3,4 and specialised for detailed vision.5 There are roughly 120 million photoreceptors in the retina and it is these that initiate vision. As we all remember, the photoreceptors comprise of:
- Rods; responsible for vision in dim light
- Cones; responsive to bright light and colour.
The macula contains three sub-regions (figure 1) with distinctly different photoreceptor content:
- Fovea; this cone-dominated central area is around 1.5mm in diameter and has at its centre a 0.5mm diameter avascular area (the foveal avascular zone, or FAZ) which itself can be further sub-divided into 3 distinct zones;
- The umbo, or central pit; 0.15mm in diameter, this is almost devoid of all layers of the retina beneath the cone photoreceptors
- The foveal slope; is still mainly devoid of other layers but some cell bodies of retinal interneurons, bipolar and horizontal cells and even some amacrine cell processes are becoming evident. The umbo and the foveal slope have a total diameter of 0.35mm and together are often described as the foveola. By the 0.35mm diameter circular area, the first ganglion cell bodies are beginning to appear
- FAZ; the central avascular area of 0.5mm diameter incorporating the foveola at its centre
- Parafovea; a rod-dominated 2.5mm diameter region encompassing the above smaller regions
- Perifovea; a rod-dominated 5.5mm diameter outermost region encompassing the above smaller regions6
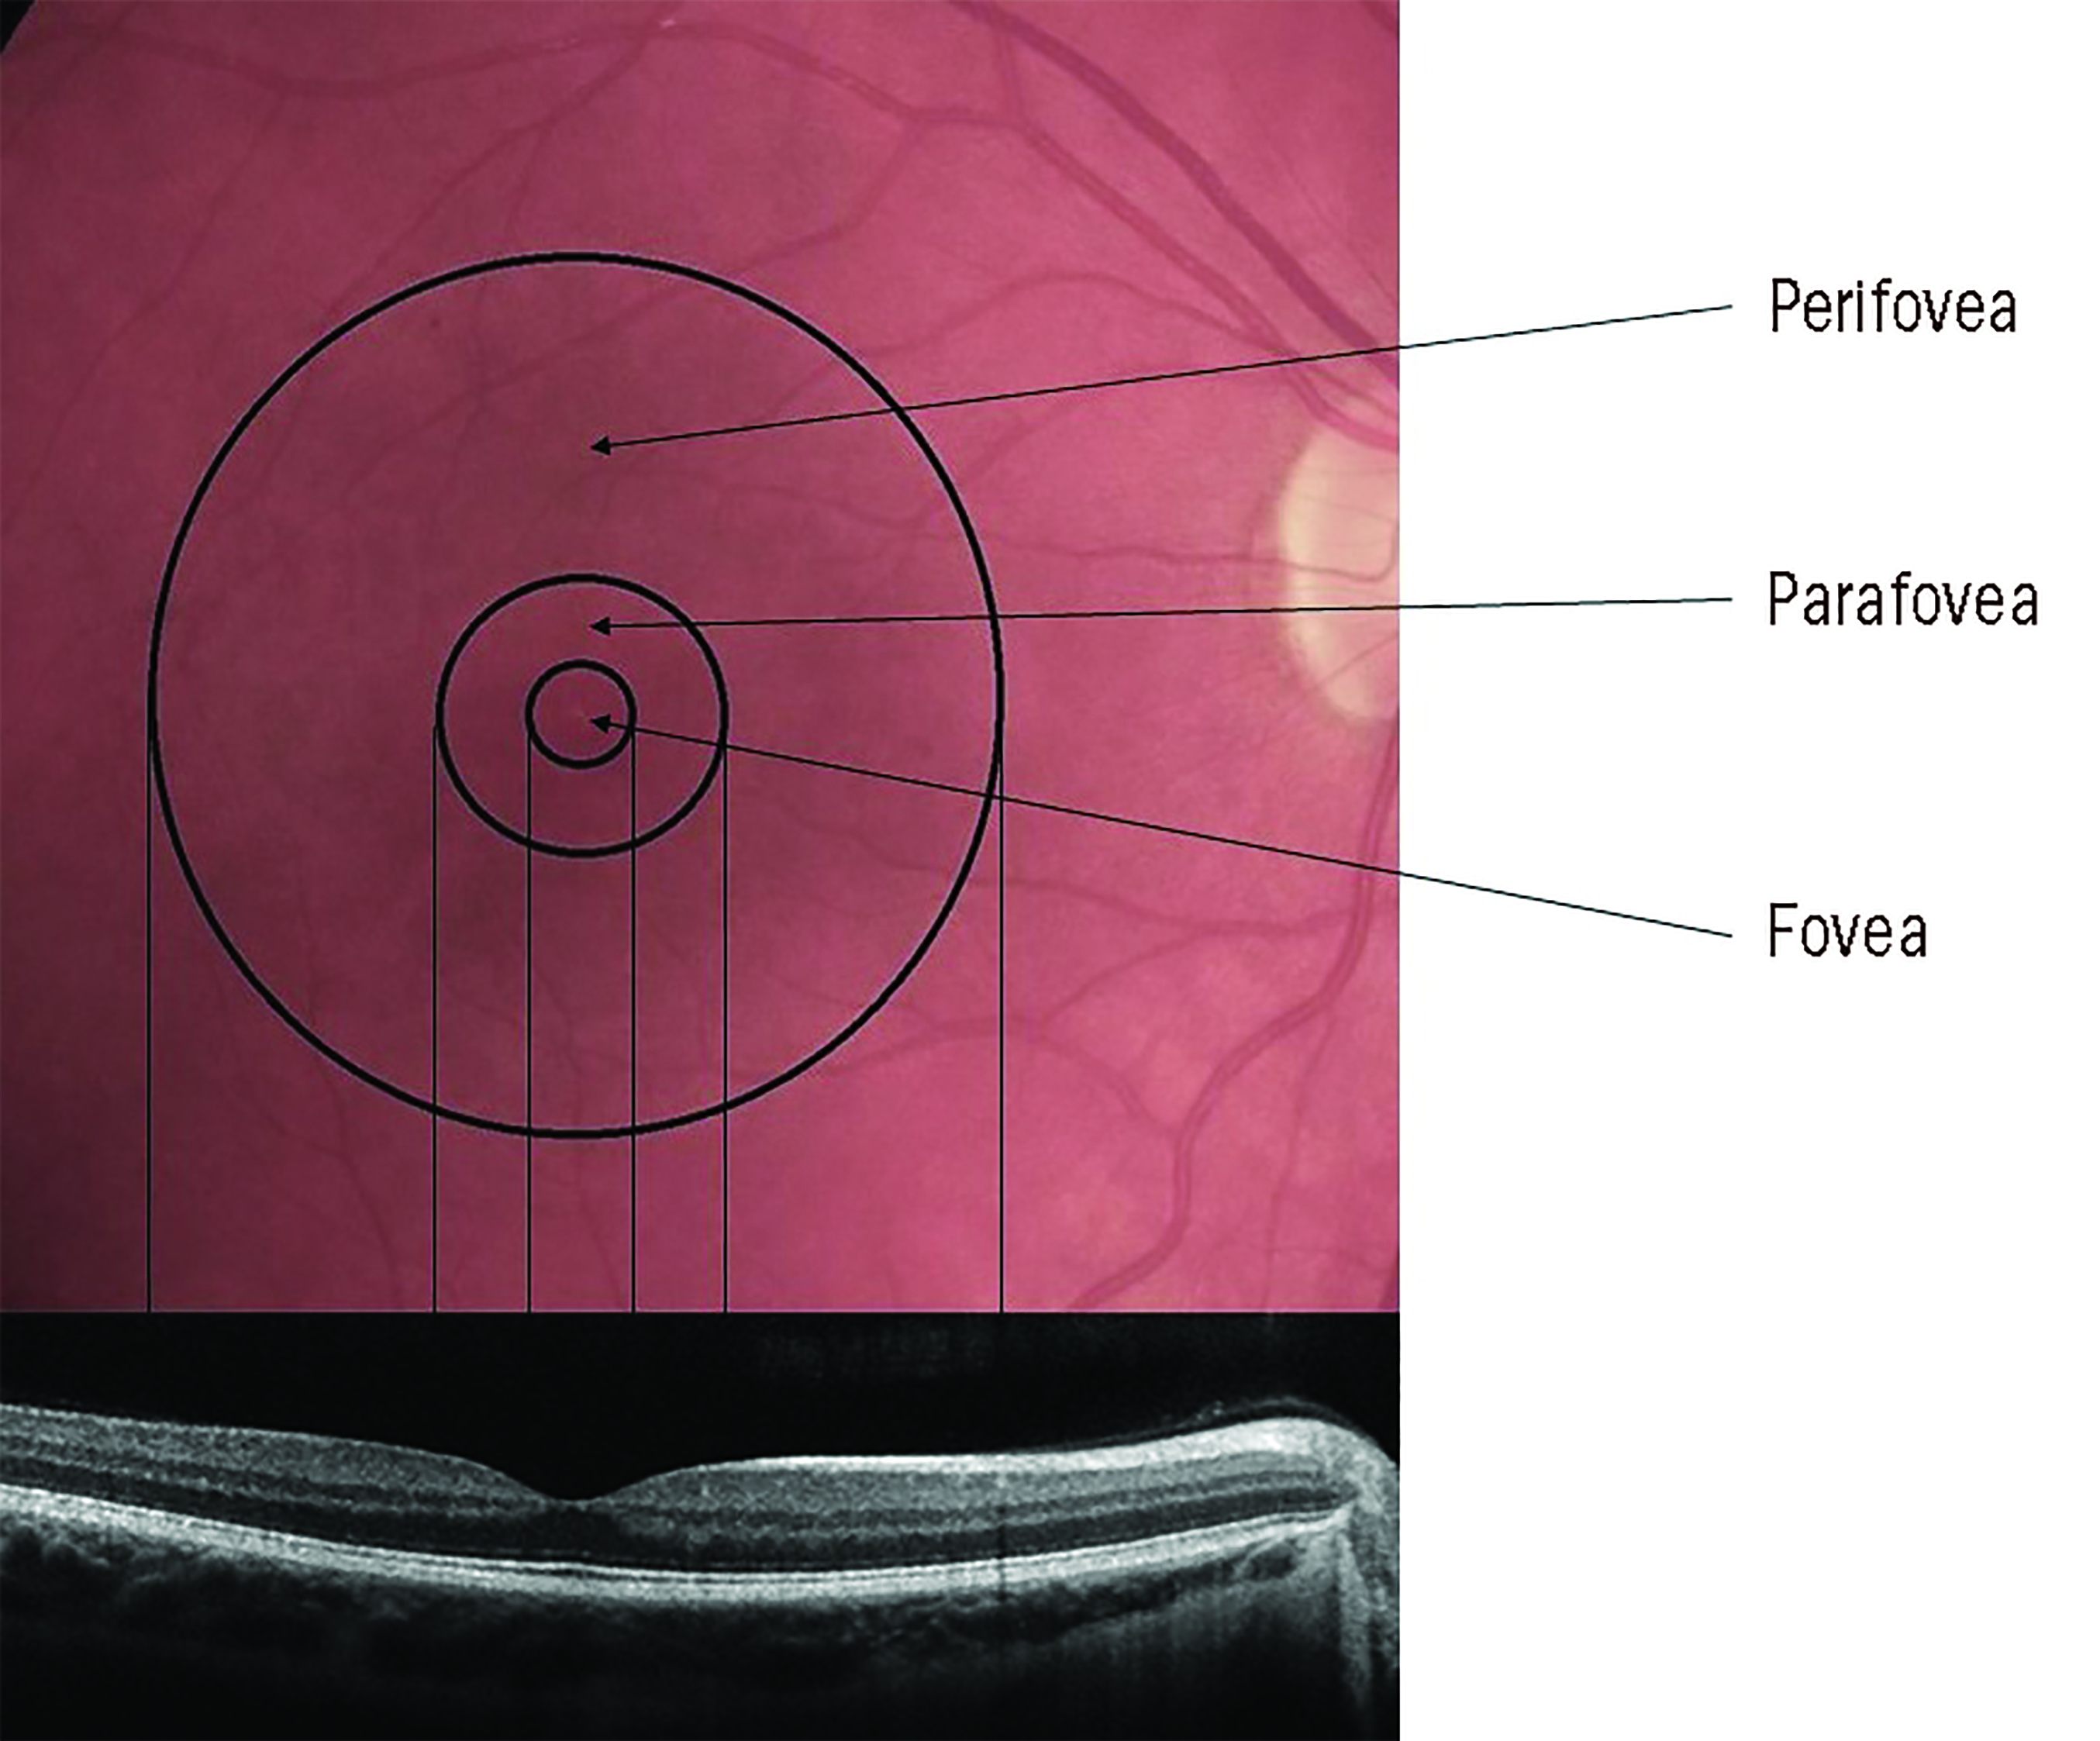 Figure 1: The anatomy of the macular area and its zonal subdivisions. Note that the foveal zone is cone-dominated but the parafovea and perifovea are rod-dominated
The rods outnumber the cones by 20:1 across the entire retina, and by 9:1 in the macular region. So, it is important to remember that the macula, despite its prominent role in photopic vision, is cone-enriched but not cone-dominated.5 The number of cones in the normal cone-dominated area remains stable throughout life, whereas rod density decreases by around 30% with the greatest loss occurring in the parafoveal area.7 Figure 2 shows how the rod and cone ratio varies with eccentricity across the retina.
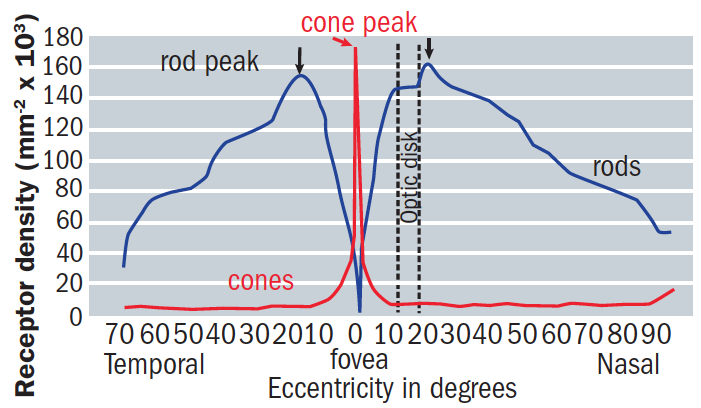 Figure 2: The changing rod:cone ratio with retinal eccentricity
Photoreceptor outer segments comprise stacked membranes containing proteins that form part of the phototransduction cascade. Outer segment components are synthesised in the photoreceptor cell body, with continual phagocytosis of the outer segments discs every day by the retinal pigment epithelium (RPE). The RPE sustains photoreceptor health in numerous ways, including maintaining proper ionic balance and hydration, transporting and filtering nutrients, providing retinoid intermediates to replenish the photopigment bleached by light exposure, and absorbing stray photons.
The RPE and photoreceptors are supplied by the choroidal vascular system, which boasts the highest rate of blood flow per unit weight of any tissue.6 Between the RPE and the choriocapillaris lies Bruch’s membrane (figure 3), a delicate wall only 2 to 6µm thick and divided into five distinct layers in the following order running anterior to posterior:
- RPE basal lamina
- Inner collagenous layer
- Elastic layer
- Outer collagenous layer
- Choriocapillary endothelium basal lamina
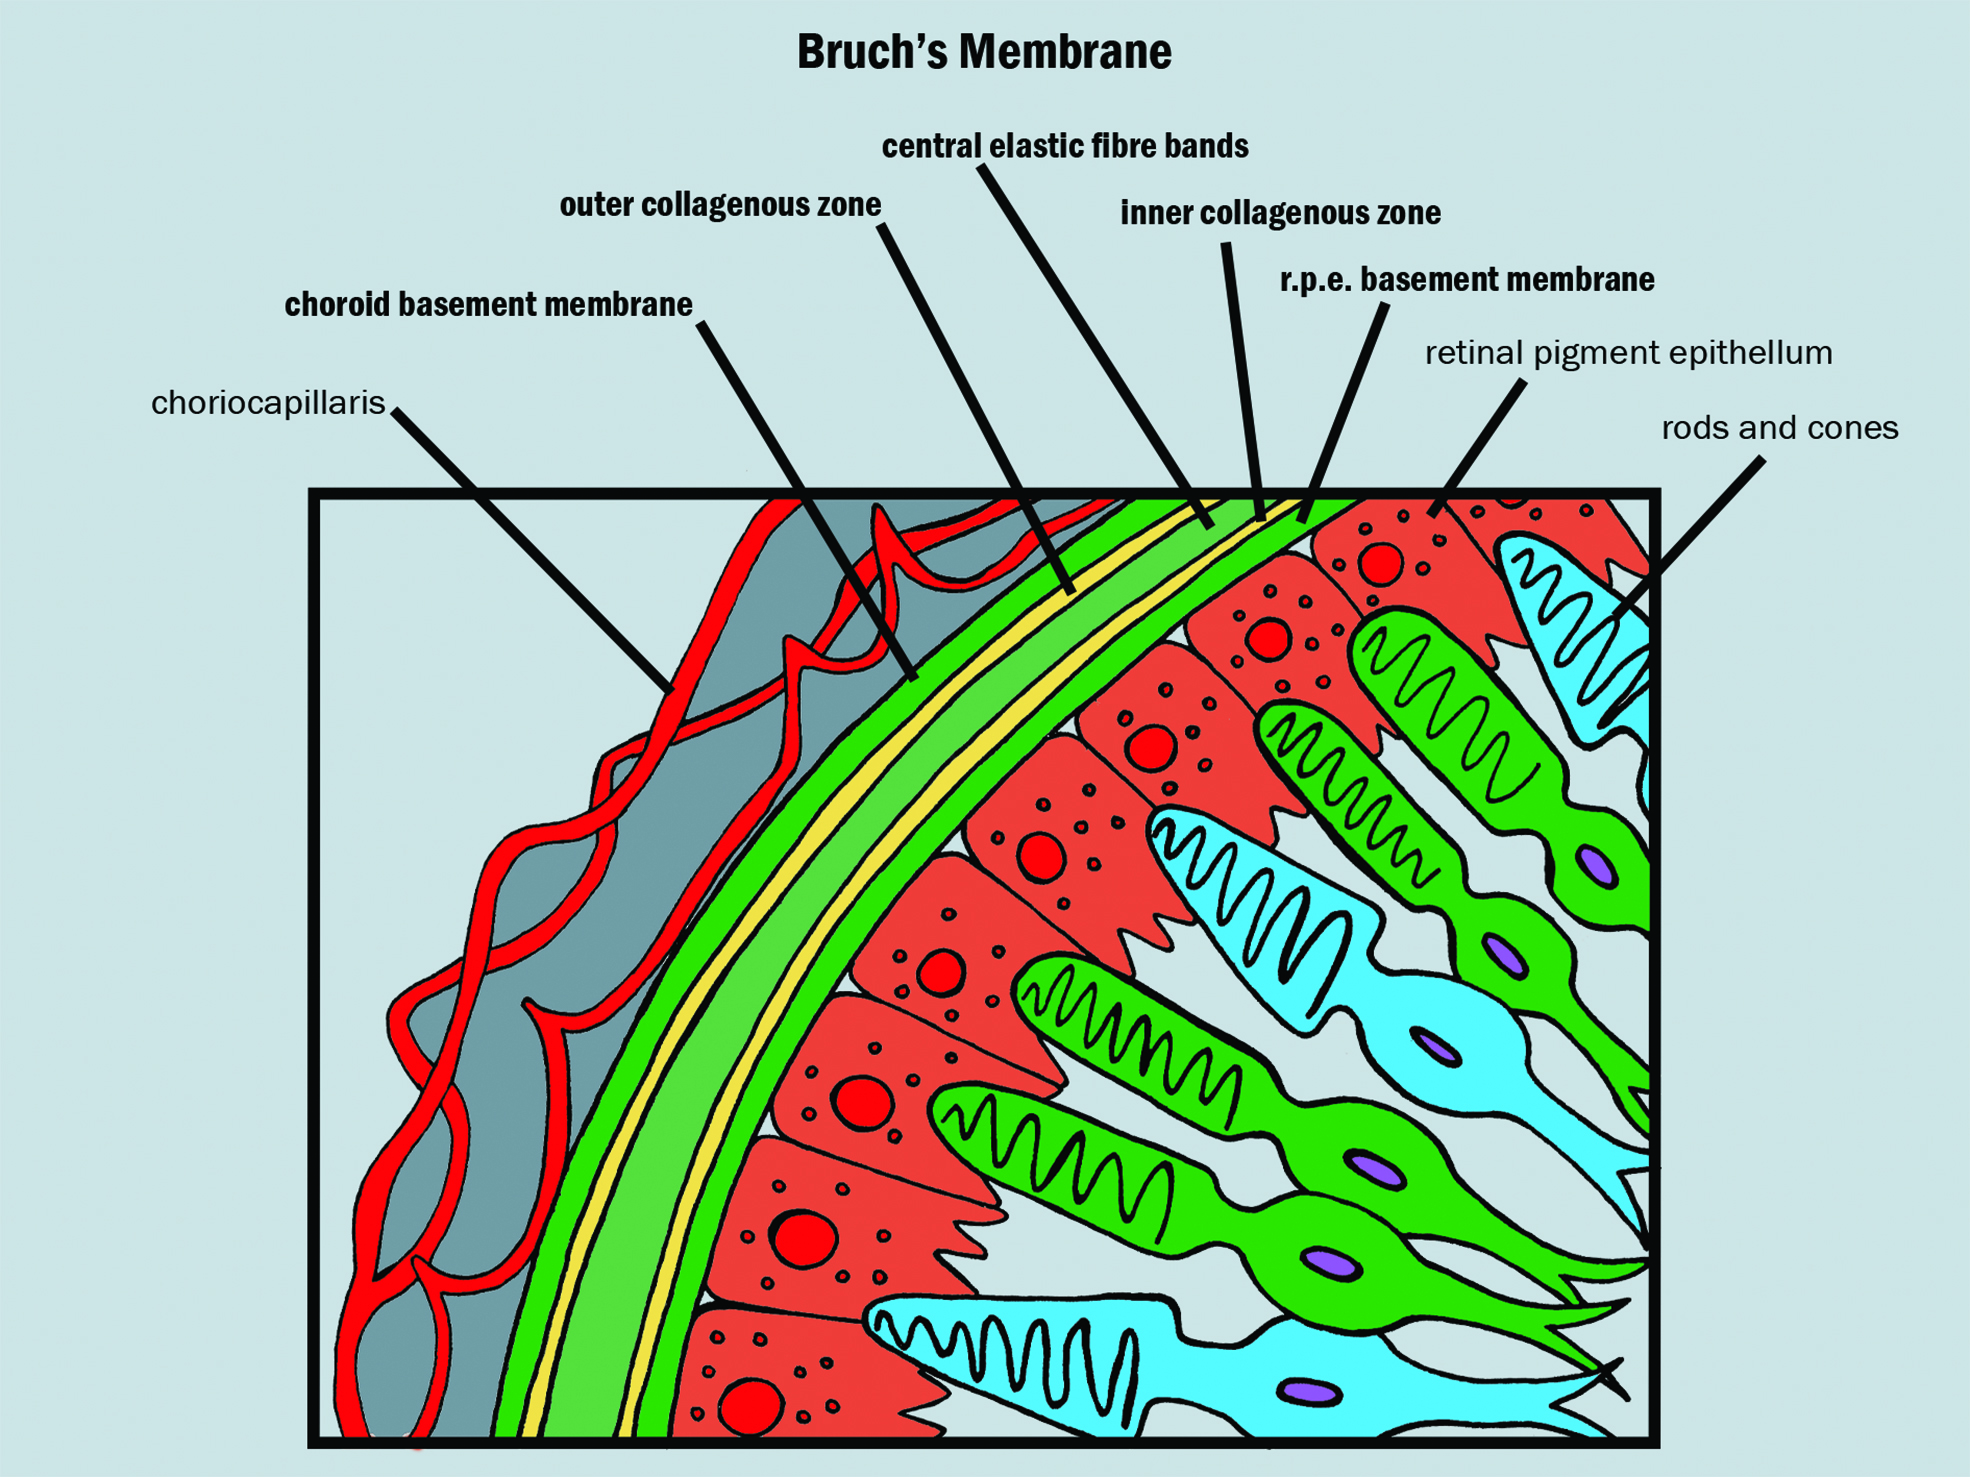 Figure 3: Structure of Bruch’s membrane (shown as bold)
All nutrients passing to and metabolites from the RPE and photoreceptors must cross Bruch’s membrane.5 This clearly has the potential to affect retinal function.
Photoreceptors
Rods and cones differ in a variety of ways as summarised in table 1. Rods have high enough sensitivity to detect a single photon, so making them function better in dim or scotopic conditions, albeit responding more slowly. Their light-sensing ability is not lost under mesopic light conditions where they still contribute significantly.
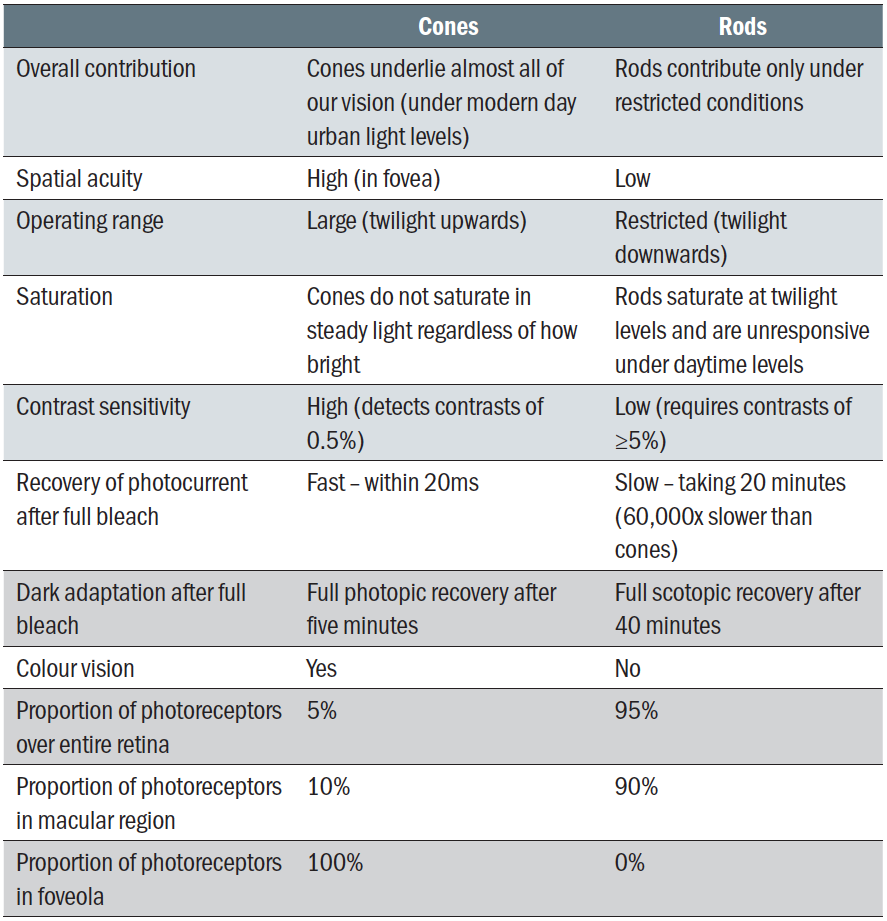 Table 1: Distinction between rods and cones
Cones, on the other hand, are less sensitive and function better under photopic conditions. Their response to light is rapid and they recover quickly following bright light exposure.
A third type of photoreceptor, light-sensitive ganglion cells, are involved in driving circadian rhythms and are not discussed further in this article.
Visual pigment describes the molecules that capture light photons in the photoreceptors. The molecules are found in the outer segments of the rods and cones within the cell membrane which are arranged into discs. The visual pigment in the cones is known as cone pigment and that within the rods is called rhodopsin.
The detection of light by rods and cones requires a photosensitive derivative of vitamin A known as 11-cis retinal (11-cis RAL, sometimes described as the chromophore). The membranous photoreceptor protein opsin contains 11-cis retinal. In rod cells, these together are called rhodopsin. In cone cells, there are different types of opsins that combine with the retinal to form pigments called photopsins. Three different classes of photopsins in the cones react to different ranges of light frequency, a differentiation that allows the visual system to calculate colour.
When a photon of light is absorbed in the rod outer segments by rhodopsin, the 11-cis RAL changes shape to become ‘all-trans’ retinal (all-trans RAL). This then promotes the rapid activation (somewhere around 1ms) of the rhodopsin (R) which triggers the ‘phototransduction’ pathway, resulting in the generation of an electrical signal.9,10
After further conformational shape changes to the opsin component, the activated pigment is broken down to free opsin and all-trans RAL.11 It is important to note that neither all-trans RAL or opsin are light sensitive, highlighting the need for an adequate supply of 11-cis RAL for appropriate photoreceptor functioning. This supply occurs by the conversion of all-trans RAL back to 11-cis RAL through a series of enzymatic steps, also known as the visual cycle, and relies heavily on the RPE to allow for successful completion. We will now look at each of these in some more detail.
Phototransduction
In addition to rhodopsin (R), which is packed into the disc membrane, three other species of protein play an essential role in the response to light:
- Transducin; found in the rods
- Phosphodiesterase (PDE)
- Cyclic GMP (cGMP)
These all play a role in a cascade response, which can be broken down into the five steps indicated in figure 4. The first three steps involve proteins associated with the disc membrane (rhodopsin, transducin and PDE) while the final two steps involve the cytoplasmic messenger, cyclic GMP (cGMP) and its action at the plasma membrane as are now described in a little more detail:12
- Step 1. Activation of rhodopsin; a photon of light (hv) is absorbed by a rhodopsin molecule (R) in the outer segment, isomerizing the chromophore to its all-trans configuration, thereby activating the rhodopsin molecule (R*).
- Step 2. Activation of transducin; all the proteins are mobile in (or at the surface of) the disc membrane, so that they diffuse laterally. As a result of this, activated R* comes into contact with transducin (G) and promotes the exchange of a molecule of GDP that had been bound to transducin, for a molecule of GTP from the cytoplasm to bind in its place. This process, nucleotide exchange, activates transducin (G*), which dissociates from R*. The activated rhodopsin (R*) has not been altered in any way by this interaction, and so it can contact another and activate other molecules of transducin. This process can be repeated as long as rhodopsin remains active, and rhodopsin can be considered as an enzyme that catalytically activates numerous molecules of transducin, resulting in amplification of the initial signal.
- Step 3. Activation of the PDE; once transducin is activated, it continues to diffuse laterally and into contact with, and activates the protein phosphodiesterase (PDE). Unlike the previous step, this activation has no amplification.
- Step 4. Hydrolysis of cyclic GMP; the activated PDE (E*) increases the rate of hydrolysis of cyclic GMP in the cytoplasm, resulting in a lowering of the cGMP concentration.
- Step 5. Closure of ion channels and production of electrical signal; at its resting concentration in the dark, cyclic GMP binds to, and holds open ion channels in the cell’s plasma membrane. The reduction in cGMP concentration results in cGMP unbinding from these ion channels, causing the ion channels to close, greatly reducing the ingress of Na+ and Ca2+ ions into the cell. The K+ channels remain open, creating hyperpolarisation of the cell. This decreases the release of neurotransmitter at the synapse. Counterintuitively, this reduction in neurotransmitter at the synapse is relayed to the postsynaptic neurons as an electrical signal.12
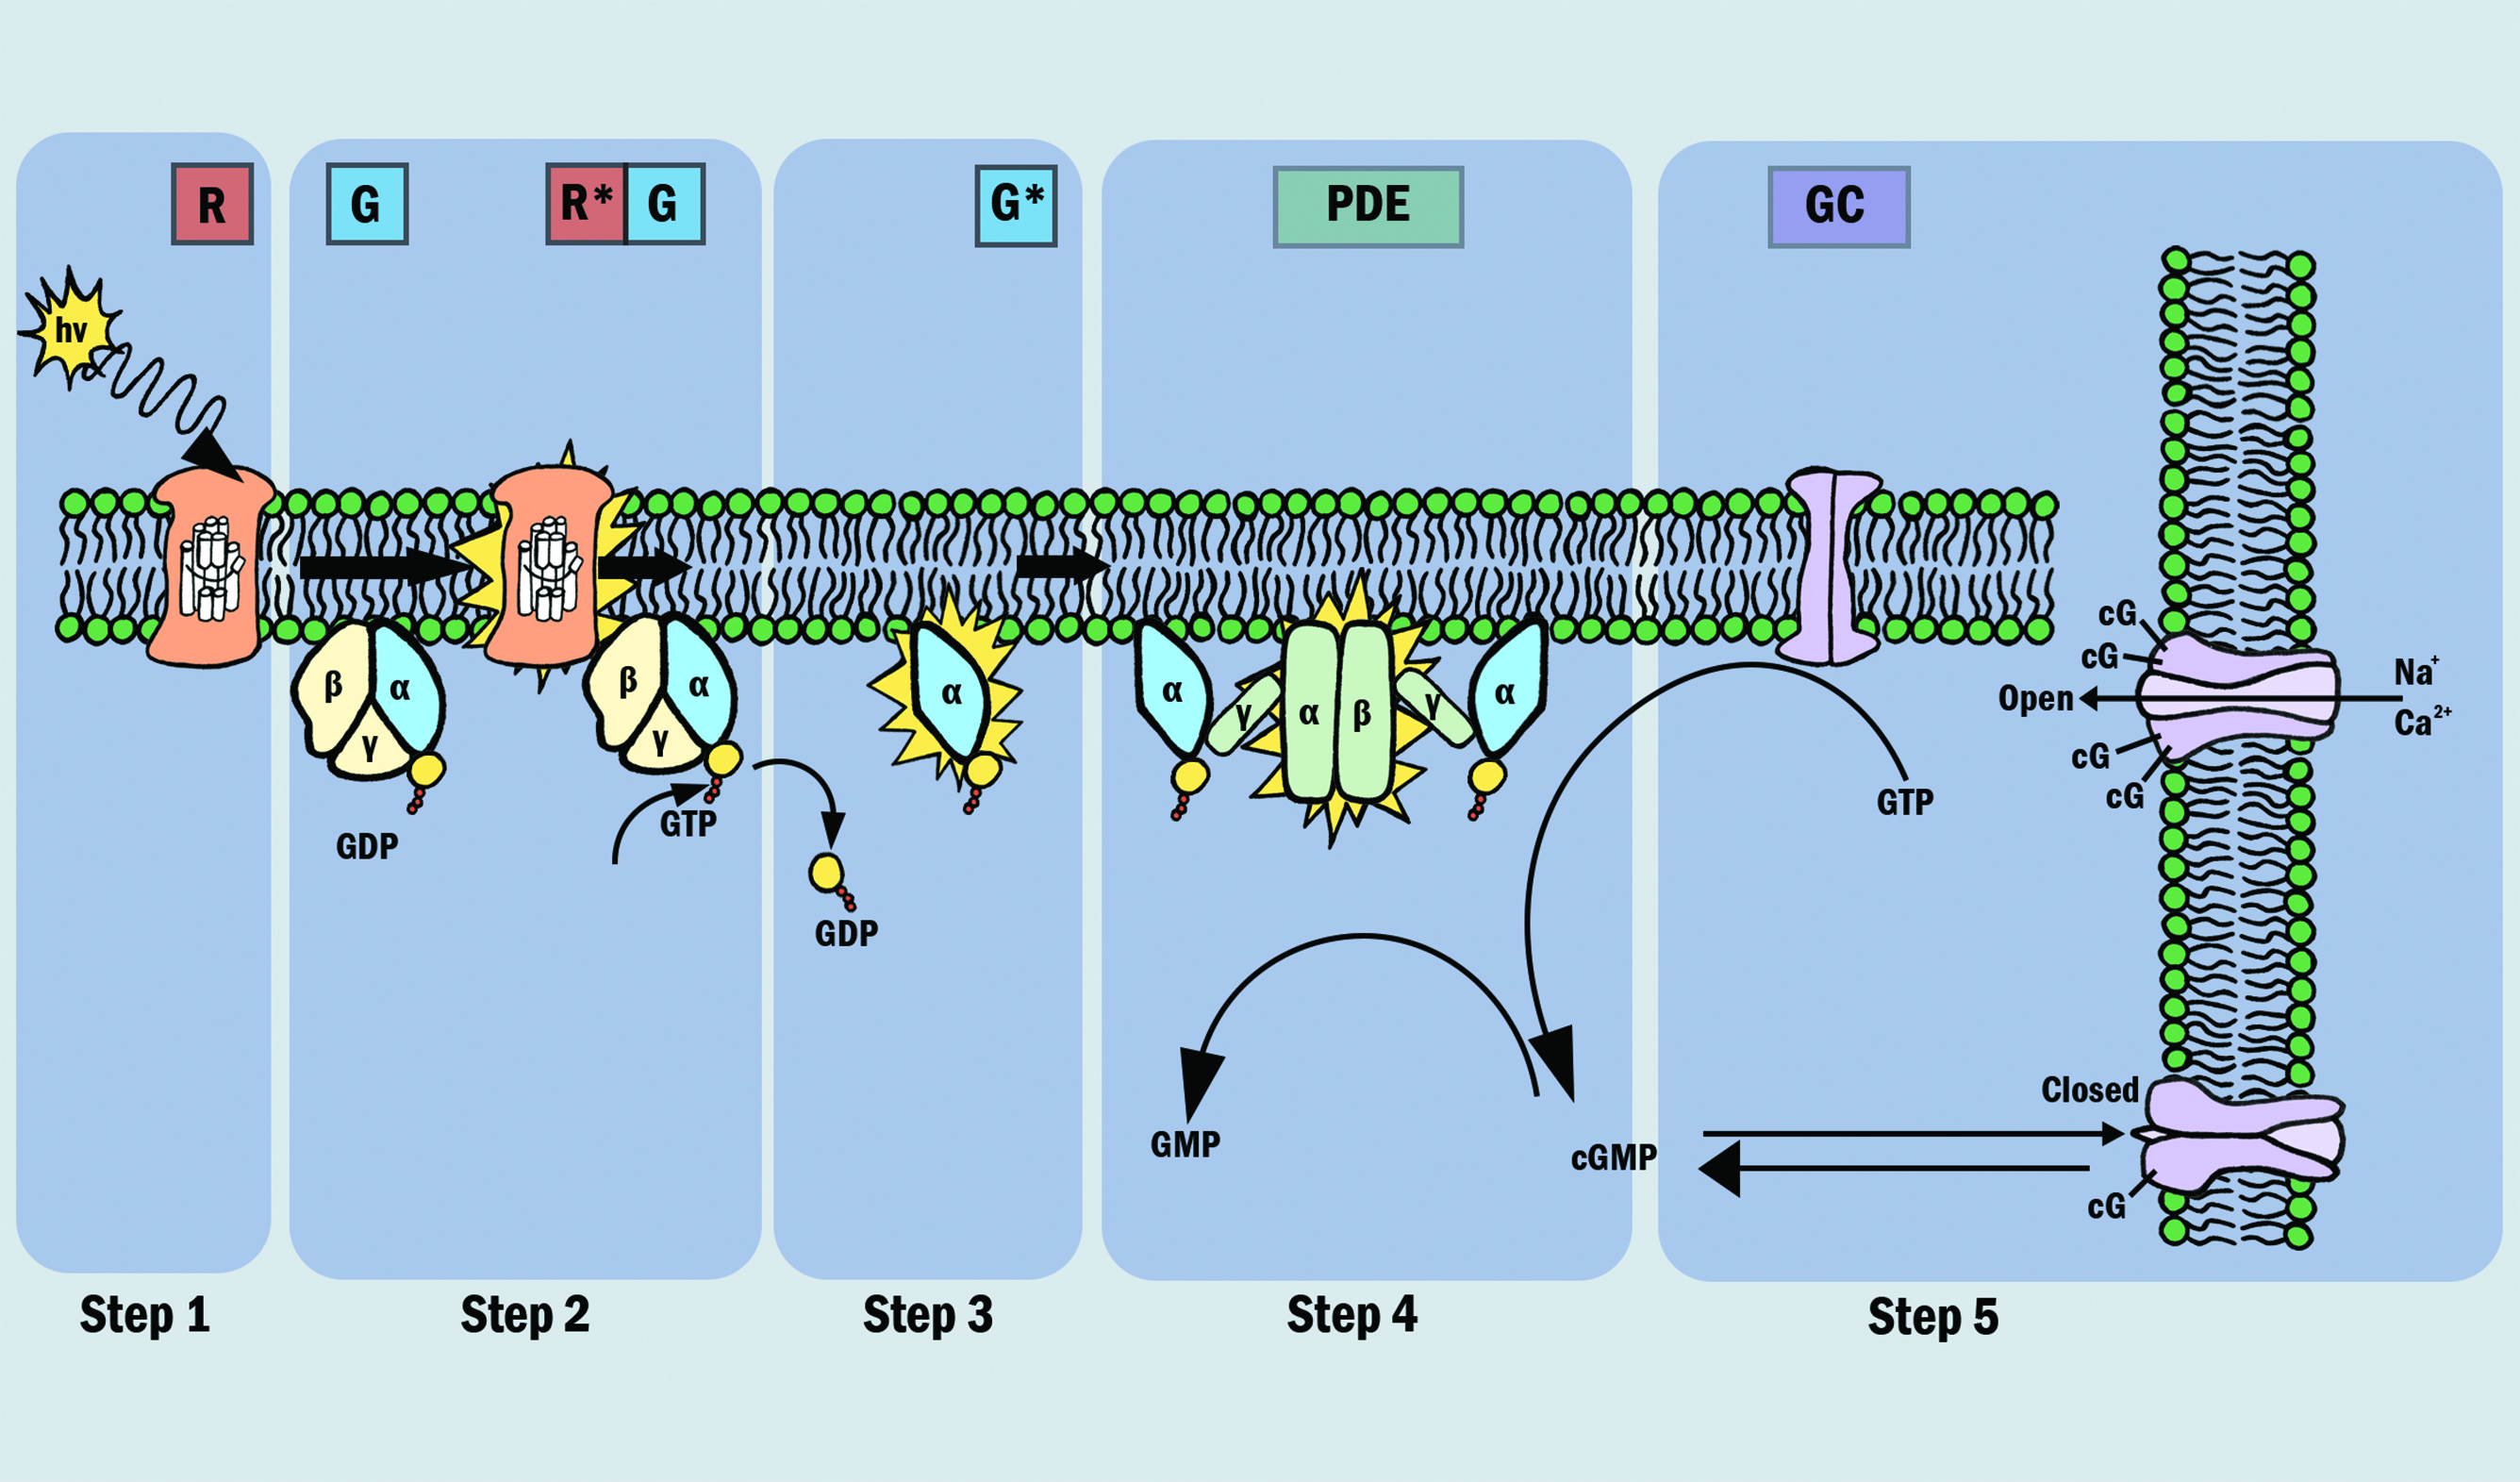 Figure 4: The phototransduction process
The outer segments of the photoreceptors are where the conversion of light into electrical neural signals takes place. The photoreceptors possess various ion channels along the plasma membrane. In the dark, some of these channels are open, by virtue of cGMP attached to the channel, which creates an electrochemical gradient, promoting inward movement of Na+ and Ca2+ ions. Other channels exist on the photoreceptor that promote the movement of K+ ions from the photoreceptor to the outside, creating a hyperpolarising influence. In a darkened state, the overall effect of this inward or ‘dark current’ is to depolarise the photoreceptors, resulting in a steady release of neurotransmitter (glutamate) from the synaptic terminals. This acts as a signal to prevent the initiation of a neural signal as will be discussed later.
So, to summarise, once a photon has been absorbed, a cascade of processes occurs to alter the electrical state of the photoreceptor.
Visual cycle
The original source of the chromophore in the visual system is all-trans retinol (all-trans ROL), a derivative of vitamin A and comes from the blood circulation. The all-trans ROL travels through the choroidal vessels and is taken up by the RPE, where it is converted to 11-cis RAL and transported to the photoreceptors and combines with opsin to form the visual pigment, rhodopsin.1
The cycle of components of the process of photoreception, the visual cycle, is summarised in figure 5. Following photo-activation, the chromophore is released as all-trans RAL and further reduced back again to all-trans ROL. The chromophore moves as if on a ‘conveyor belt’ between the photoreceptor and RPE, undergoing various biochemical modifications along its journey.1 The all-trans ROL is carried from the outer segment of the photoreceptor to the apical processes of the RPE cells, via chromophore binding proteins (IRBP). Once in the RPE, all-trans ROL is moved (via chromophore binding protein CRBP) to the RPE cell body, undergoing conversion to 11-cis ROL. The 11-cis ROL is moved back to the apical portion of the RPE and undergoes it final transformation into 11-cis RAL. From here, 11-cis RAL begins the ‘return journey’, and is carried back to the outer segment of the photoreceptor for pigment regeneration, where it combines with opsin to form inactive rhodopsin. The supply of chromophore, therefore, is both from the blood supply and from recycling all-trans ROL derived from the bleached photoreceptors.1,11,13
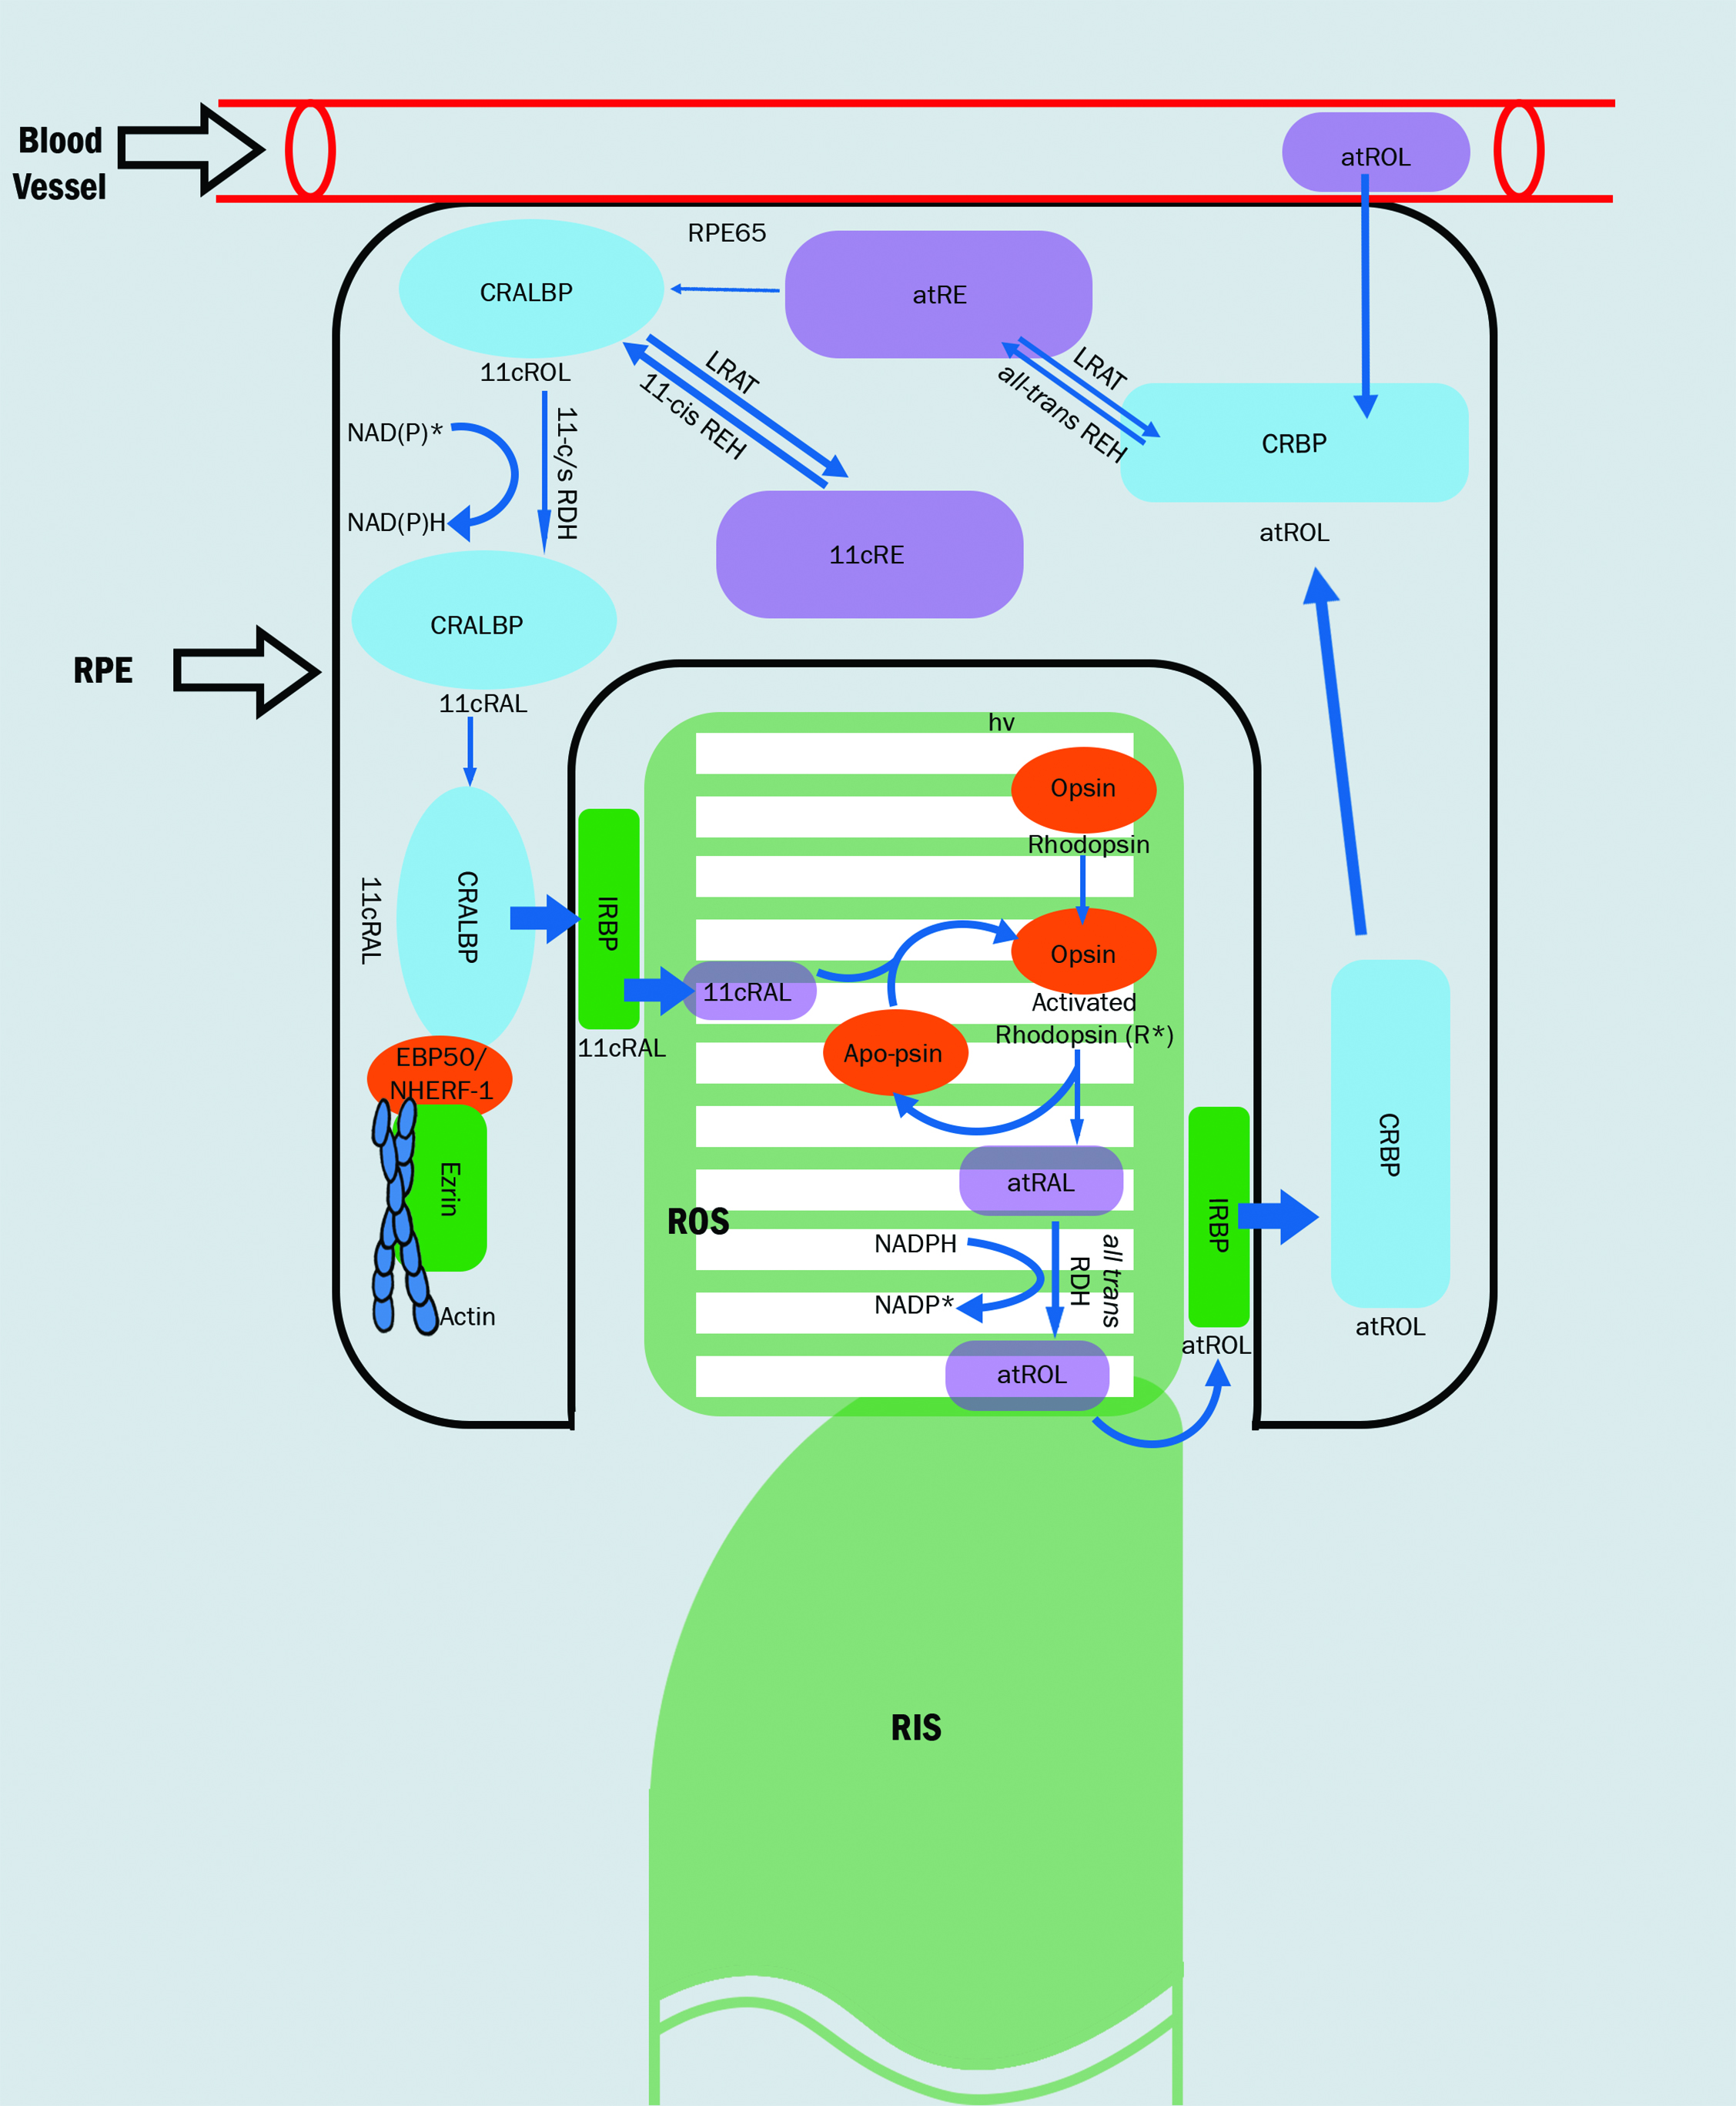 Figure 5: The visual cycle1
By understanding this cycle, it becomes apparent that the integrity and functioning of the RPE/Bruch’s membrane complex, and its interplay with the photoreceptors, is critical to the maintenance of appropriate visual signalling. Subsequent disruption of this complex can negatively impact upon visual functioning, as the cycling of all-trans RAL to 11-cis RAL is hampered, along with nutrient and oxygen transport to the photoreceptors.
The efficiency with which Bruch’s membrane allows transport of nutrients and removal of toxins lessens with age 14 and can be caused by a variety of triggers. These include the calcification and deposition of cholesterol. Some researchers suggest there is more than a 90% reduction in efficiency by the ninth decade compared to the first decade.15 Investigation of this membrane complex is possible by measuring dark adaptation, which has been likened to a bioassay of the health of this membrane complex.16
When one considers that the supply of vitamin A, a precursor to rhodopsin, comes via the choroid and travels through Bruch’s membrane and the RPE to eventually reach the rod photoreceptors, the status of these structures becomes crucial.18 It is important to point out that, in the cone-specific visual cycle, the regeneration of cone photopigment occurs rapidly through the Müller cells and is therefore less reliant upon, and less impacted upon, by the RPE for its source of Vitamin A as the rod visual cycle.1,18
Additionally, functional and anatomical changes occur before drusen are visible clinically, by which time AMD has actually already been present for many years. A microscopic cholesterol layer, not visible with current diagnostic tools, is produced by the RPE and laid down in Bruch’s membrane.19 This thin layer of
cholesterol impairs the functioning of the visual cycle and results in impaired dark adaptation.20 As the disease progresses, the cholesterol layer continues to be laid down and can give rise to areas of focal thickening, seen clinically as drusen. This accumulation of cholesterol causes local inflammation, oxidative stress and further disruption of oxygen and nutrient exchange to the outer retina. The retina has a defence mechanism, in the form of the anti-oxidants lutein and zeaxanthin. However, if this proves insufficient, the pro-inflammatory mechanism continues and ultimately results in apoptosis of photoreceptors in macula.21
The dark side; Dark adaptation
The visual system can function over a wide range of light intensities, covering over 10 log units (figure 6). This adaptation of our visual system occurs rapidly in most levels of illumination, often within seconds.10 Following light exposure, photoreceptor pigment is bleached, triggering a cascade of biochemical reactions in the outer retina and resulting in a profound loss of sensitivity.17 The dark adaptation (DA curve represents the ability of the retina to regain its sensitivity in a darkened room following exposure to a bright light stimulus and thus reflects the retinol cycle.10,22 The DA curve plots the recovery of scotopic sensitivity (over a range of five to six log units), going from no/minimal sensitivity immediately following light exposure, to complete recovery within 40 minutes.
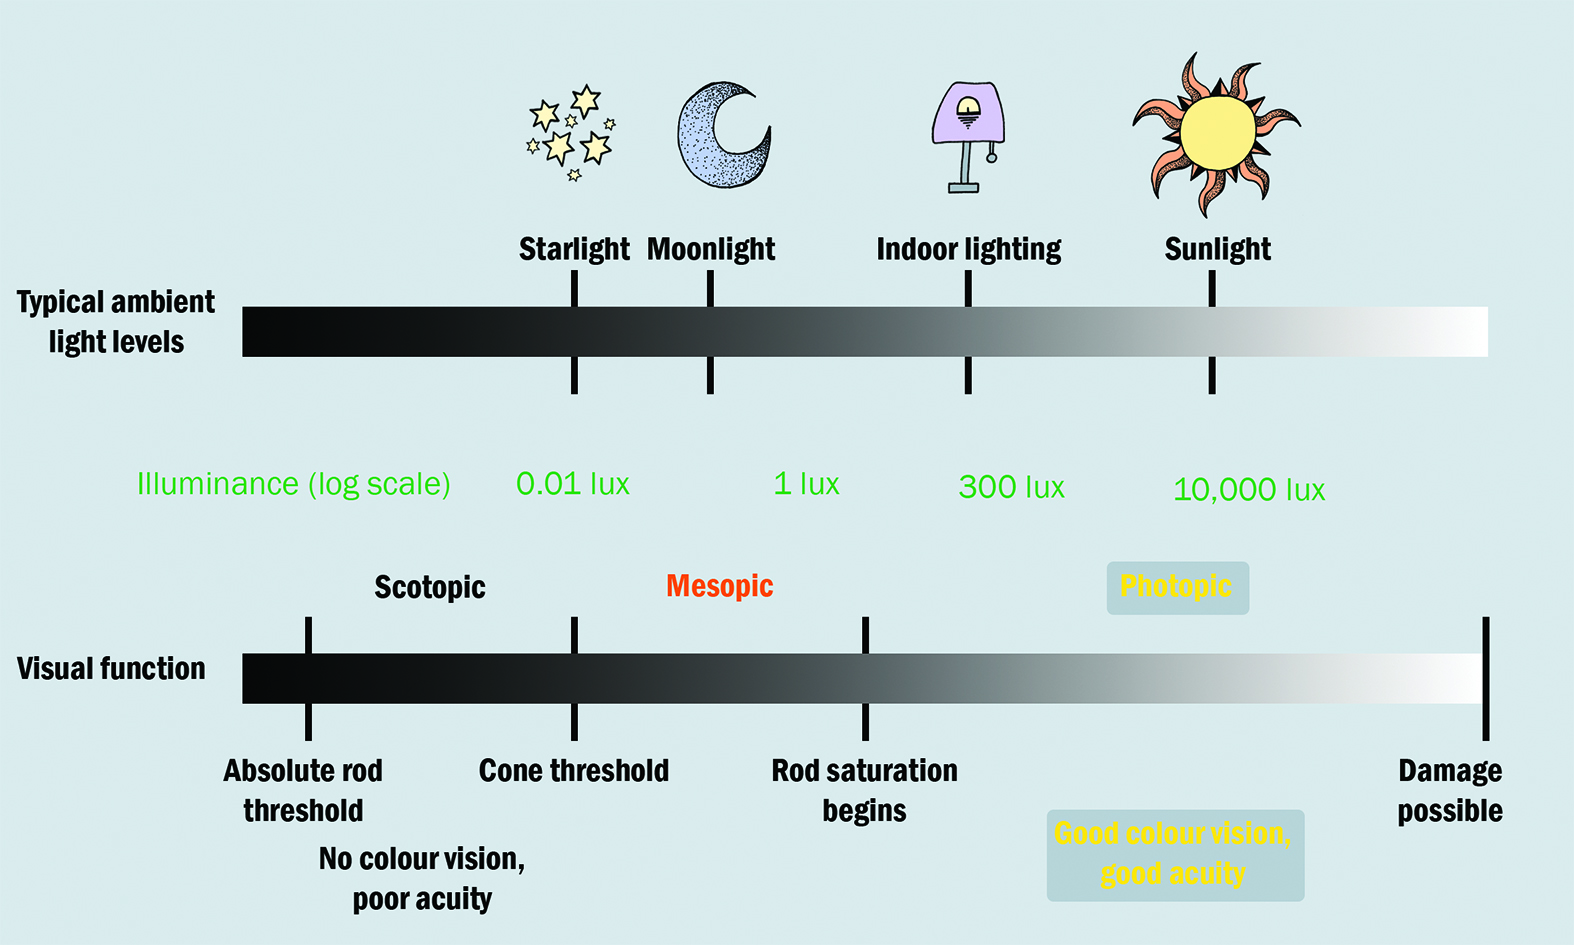
Figure 6: Relating light levels with visual function23
Research into this delay in retinal sensitivity following exposure to a bright stimulus has been ongoing since the 1930s and is a familiar part of the physiological optics module that readers may recall from their undergraduate days.
Immediately after bleaching, both rods and cones begin to recover sensitivity. The recovery plot is usually considered to be biphasic, having cone-mediated and rod-mediated sections.17 Cones achieve sensitivity quicker than rods, obscuring the first component of rod-mediated DA 23 as seen in the initial curve, and reach their maximum sensitivity after five to seven minutes (figure 7).2,17
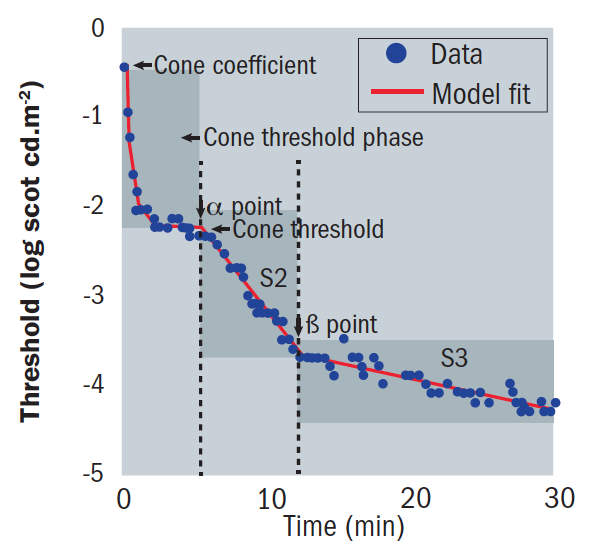 Figure 7: The modern dark adaptation curve
Rods recover their sensitivity, ultimately becoming more sensitive than cones, creating an inflection point known as the rod-cone break or α point (figure 8). The rod-mediated recovery has two components, S2 and S3, which have different slopes.
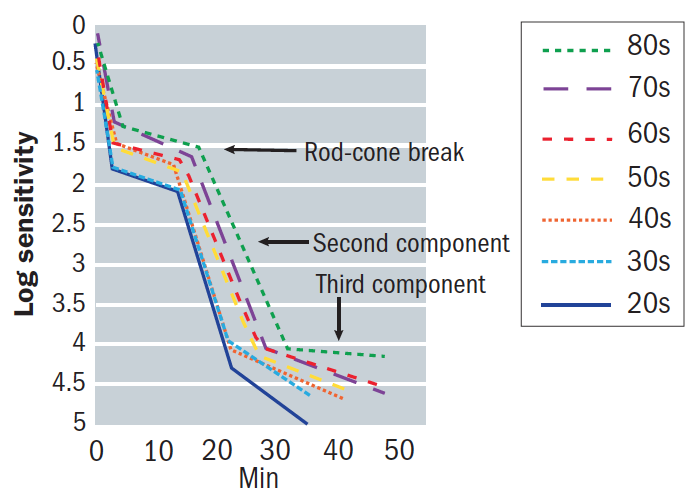 Figure 8: An example of a dark adaptation function showing the rod-cone break and influence of age
The S2 slope, also known as the S2 time constant,17 is of importance when obtaining DA measurements as it is largely dictated by the rate of rhodopsin regeneration.23 The transition from S2 to S3 is referred to as the β point.17 The slope of S2 is important and affected by certain conditions, including ageing and the severity of AMD.
In addition to the importance of S2, an additional parameter called the rod intercept time (RIT) has been specified.24 This describes the time taken after bleaching for the subject to recover a specific level of sensitivity (often quoted as three to four log units) that falls along the S2 slope and is therefore completely rod mediated.25 Patients with impaired dark adaptation have longer rod intercept times than those with normal dark adaptation, and this prolongation can be used as a functional outcome measure.26 Patients with delayed DA generally notice impaired night vision (figure 9).27
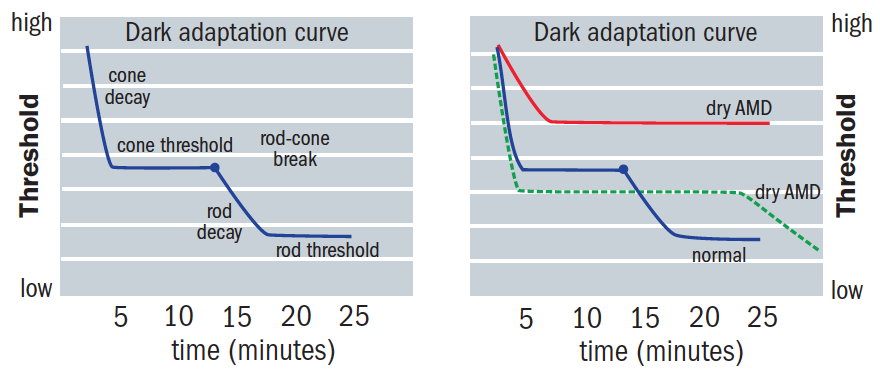 Figure 9: AMD patients show longer recovery times, which are attributed to rod dysfunction specific to AMD27
This sensitivity recovery after a bleach is dependent upon the ability of the rod outer segments and the RPE to regenerate rhodopsin and can vary with the intensity of the bleaching stimulus.12,17 For bleaches of high intensities (>20% bleach of local rhodopsin), the recovery rate of S2 is limited by the active transport system between the choriocapillaris and RPE on which the retinoid cycle, which controls the regeneration of rhodopsin, depends. S2 is remarkably linear, and the fact that it is an accurate index of the efficiency of rhodopsin renewal can be considered a bioassay of retinal health.12,17,28,29
DA impairment is primarily rod-mediated, with no significant impairment found in cone-mediated DA in early AMD patients.27 The cone-mediated impairment occurs as AMD severity increases. Cones have other pathways to obtain nourishment, whereas rods are wholly dependent upon the transport route across the RPE/ Bruch’s membrane complex.30 Rod functioning is more susceptible to aging than cones and the rod-mediated portion of dark adaptation is significantly slower than younger adults.12,31
There are thought to be two processes to explain why rods are negatively impacted by age:
- The number of rods decreases by 30% from middle age to the ninth decade
- Bruch’s membrane becomes thicker and accumulates a fine lipid layer31
The latter of these processes creates a barrier to the movement of the visual cycle components.7 The effect of this barrier upon RPE cells and the knock-on impact upon their role in photopigment replenishment impairs rod performance,18,33 resulting in a change in the slope of S2.10 It therefore becomes apparent that, as the retina ages, the slope of S2 shallows compared with that of younger subjects, resulting in a delayed rod-cone α break and β points, with a particularly large effect on the β point (figure 10). Scotopic impairment and sensitivity decline throughout adulthood faster than photopic sensitivity.7,34
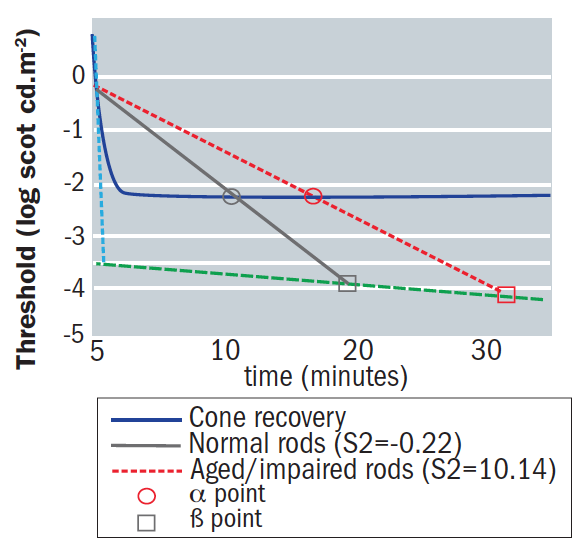 Figure 10: The impact of age on rod and cone functionality shown by the dark adaptation response for normal rod recovery (grey line), normal cone recovery (black line). And aged/impaired rod recovery (red line). The theoretical S1 (dashed line) and theoretical S3 (dashed dotted line) are indicated by small arrows. Note that a shallower slope for S2 will result in extended α (circles) and β (squares) points compared to normal2
This general slowing of DA with age appears to be predictable and uniform across the retina,2 acting as a baseline against which comparison can be made when considering patients with potential retinal pathology.
Measuring DA
The various devices for DA measurement fall into two categories:
- Traditional adaptometers
- Rapid adaptometers
The former includes the ‘gold standard’ Goldmann-Weekers adaptometer (Haag-Streit, figure 11), which has been used primarily in research for many decades. Testing in a clinical setting is hampered by a long test duration and patient fatigue, with testing often taking 90 minutes or so and requiring as many as 100 threshold readings to be taken. More recently, devices have been developed for the clinical setting, including the Roland (figure 12), Metro-vision and YAK-II.
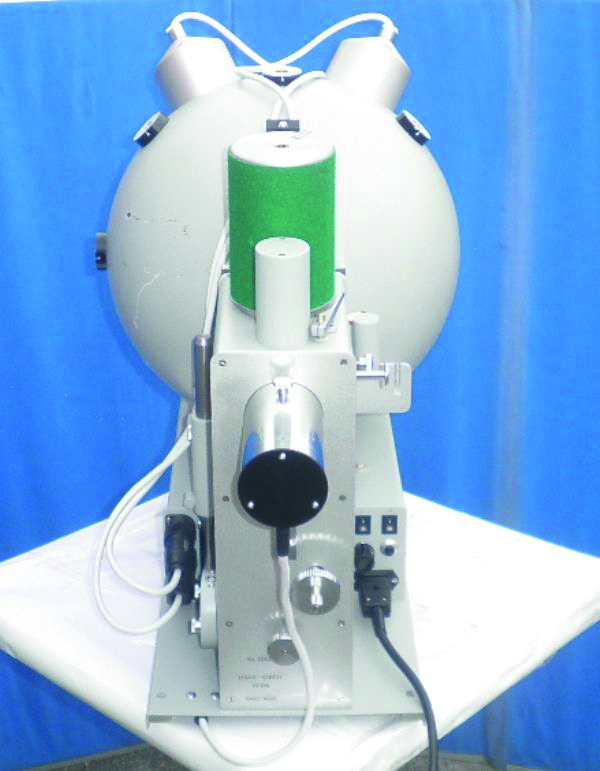 Figure 11: The Goldmann-Weekers adaptometer from Haag Streit
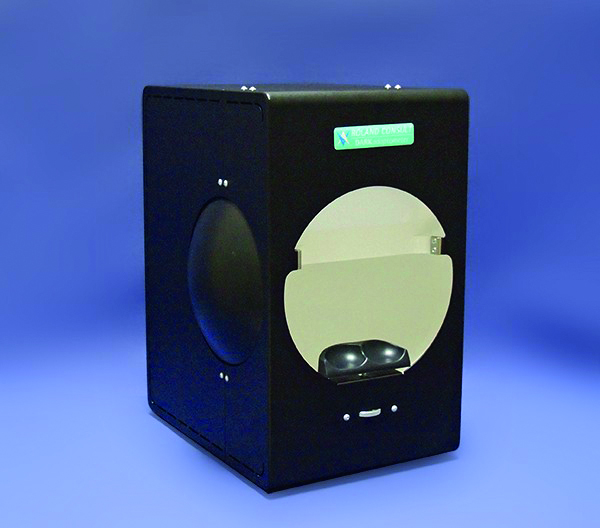 Figure 12: The Roland adaptometer
Newer DA instruments allow more rapid testing by incorporating different protocols, such as reduced bleaching intensity and by applying the stimulus to the area of greatest rod dysfunction. Such instruments include the RapiDA, 35 the AdaptDx and, most recently, the AdaptDx-Pro (figure 13). The latter two devices, both from Maculogix, offer screenings in less than seven minutes and allow for more practical use clinically. With a sensitivity and specificity of over 90%, the AdaptDx-Pro offers greater insight into the AMD status of patients.
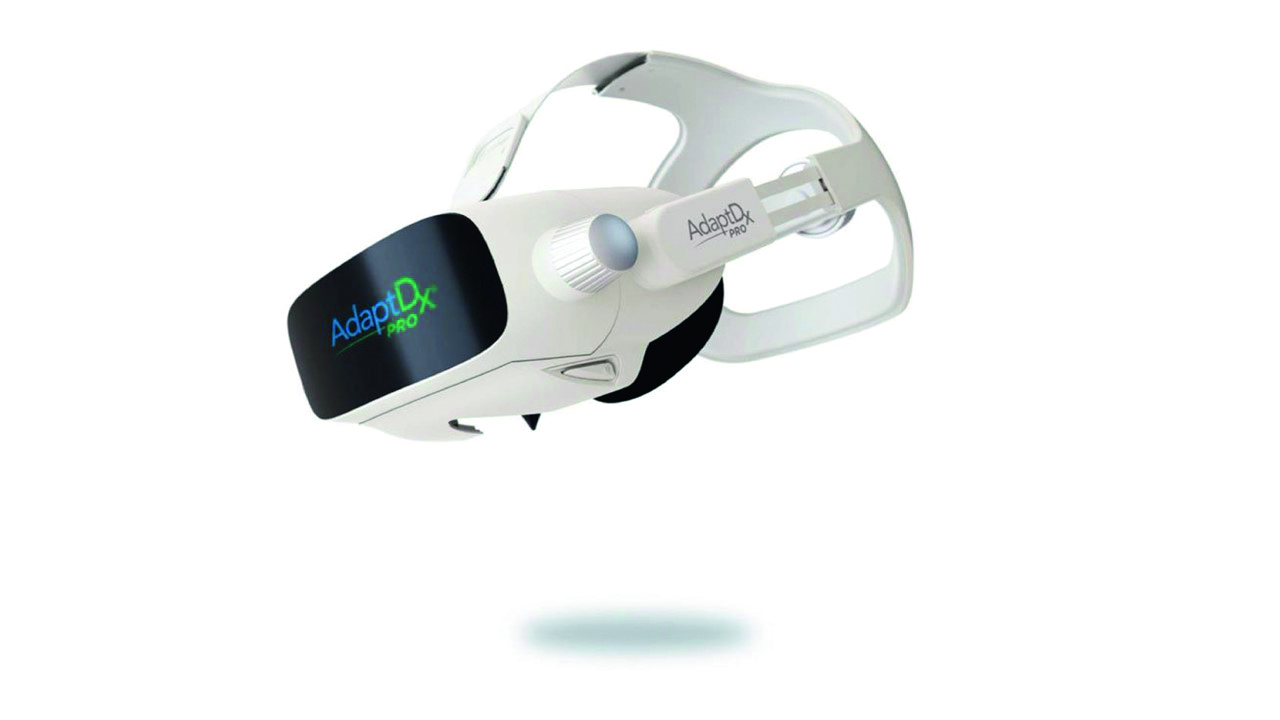 Figure 13: The AdaptDx-Pro (from Maculogix)
Discussing maculopathy
Visual acuity is typically the most commonly used measurement when considering visual function. In reality, acuity is a poor indicator of early AMD.28,29 The Beaver Dam study noted a two-letter reduction with early AMD, implying that visual acuity is minimally impacted in early AMD.4,20 Other tests exist to assess visual function in early AMD, including contrast sensitivity, shape discrimination hyperacuity, and colour discrimination.36 It is essential to find a visual function test or combination of tests that could be introduced into a clinical setting and that is easy, reliable, repeatable, and relatively quick to perform. DA is impacted in AMD before significant visual acuity loss (figures 14 and 15) and so DA testing offers an insight into functional changes long before significant visual acuity loss.
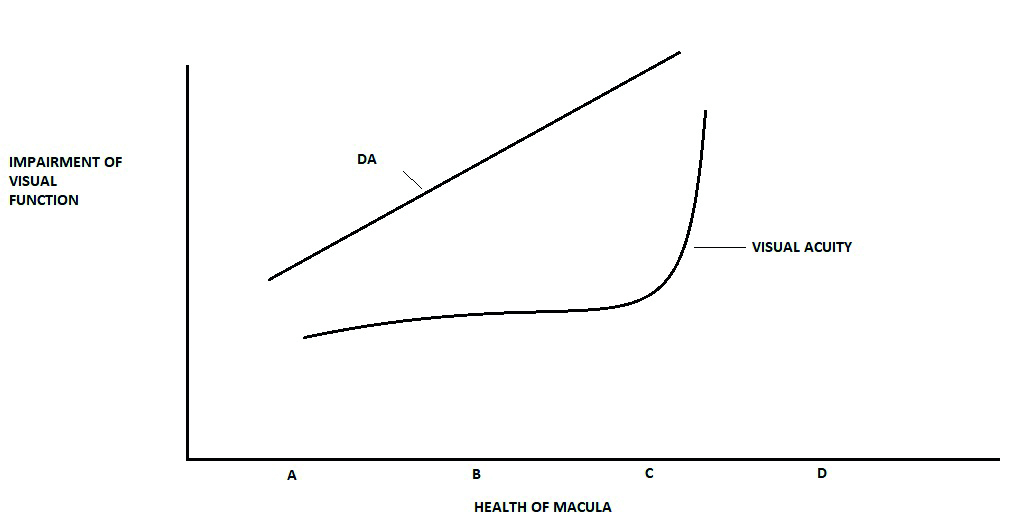 Figure 14: Dark adaptation (DA) offers an earlier and more regular indication of the impact of macular disease (A = normal adult, B = early AMD, C = intermediate AMD, D = advanced AMD)
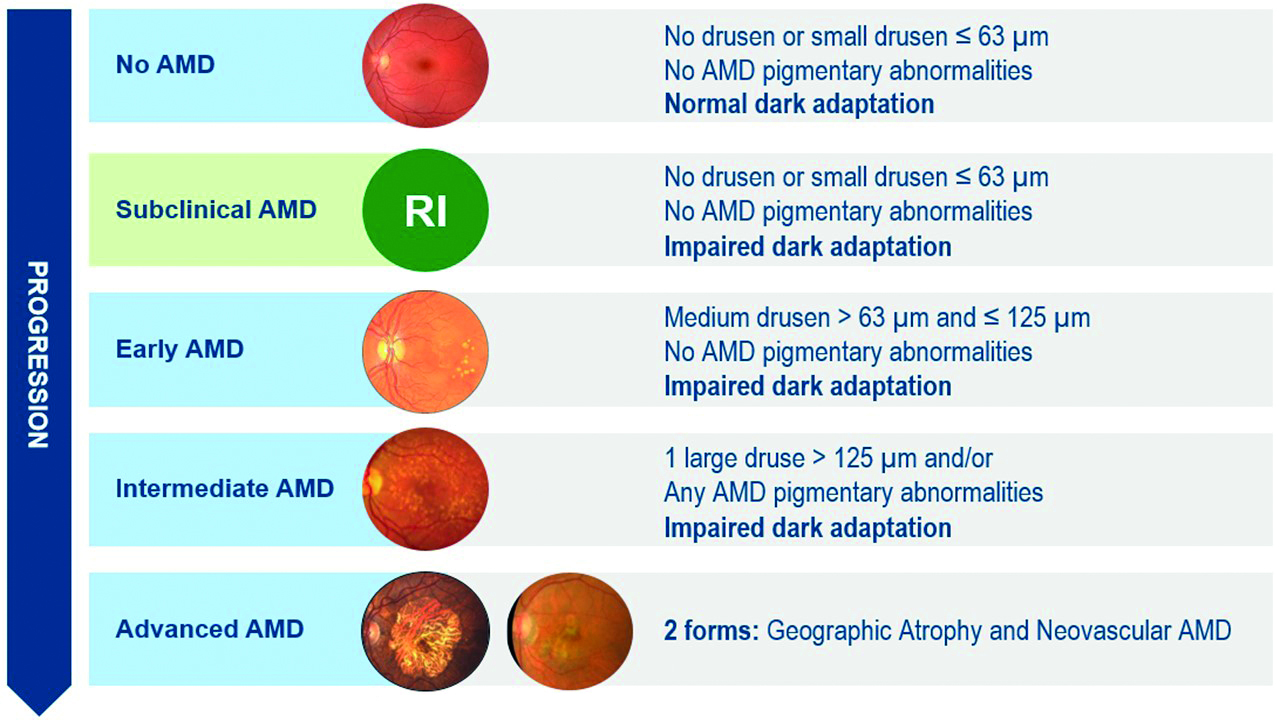 Figure 15: Stages of AMD and its presentation with DA (courtesy of Maculogix)
Studies show impaired rod-mediated DA in patients with early AMD compared to age matched normal subjects despite both groups having good acuity. Specifically, the rod-cone break time takes longer to occur before the rod dominated function begins, and is indicative of ARM related changes in the Bruch’s membrane/RPE complex.2,23 As the disease progresses, the RPE/Bruch’s membrane complex deteriorates, thereby hampering nutrient and oxygen transport to the photoreceptors.37 This limits the regeneration of photopigments, resulting in impaired dark adaptation. The delay in DA function appears to have potential in predicting who will go on to develop AMD. Studies have shown that older adults with normal VA and macular health, yet abnormal DA at baseline, were twice as likely to develop early AMD three years later.20 This reduced DA function has an impact equivalent to losing three lines of VA on the ETDRS chart.38
Interestingly, those patients with early AMD still retained good visual acuity, low luminance acuity, macular light sensitivity, and spatial contrast sensitivity when compared to normal subjects.20 We can, therefore, conclude that dark adaptation can differentiate normal ageing changes from sub-clinical deficit and so can be used a predictive tool (figure 16). DA is significantly impacted in AMD, long before significant loss of visual acuity or other functional tests are noted, and boasts a high level of sensitivity as a test when compared with others (table 2).20
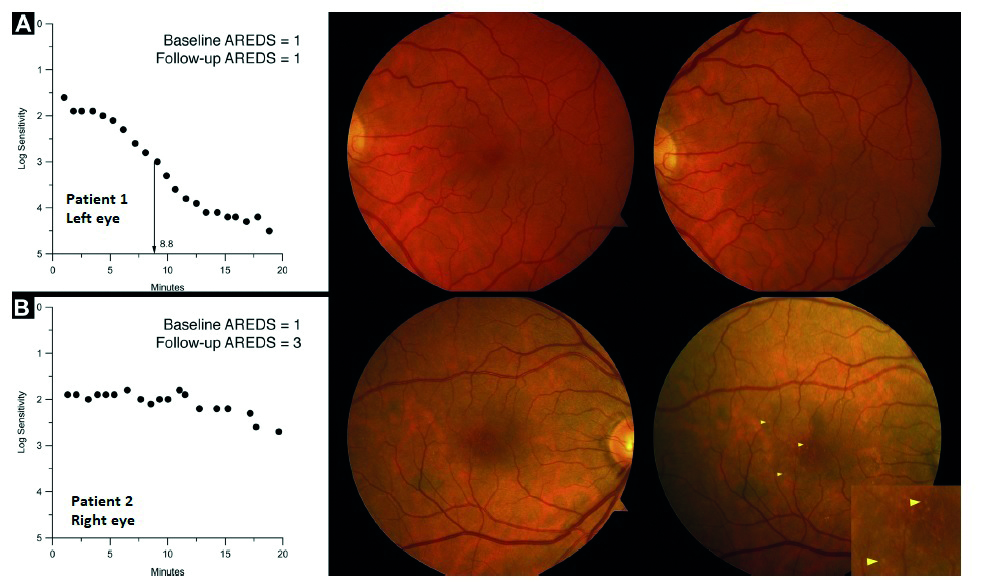 Figure 16: DA testing as a predictive tool. Row A; participant 1 showing normal dark adaptation with a rod intercept of 8.8 minutes at baseline (left panel); normal macular health at baseline (middle panel); and normal macular health (right panel) at the three-year follow-up. Row B; participant 2 showing abnormal dark adaptation at baseline (left panel); dark adaptation was still incomplete at 20 minutes, with a rod intercept of 24.5 minutes, nearly 4 times worse than participant 1; normal macular health at baseline (middle panel), and early AMD at the three-year follow-up. Inset magnifies drusen shown at arrowheads on this eye. (adapted from reference 20 with permission)
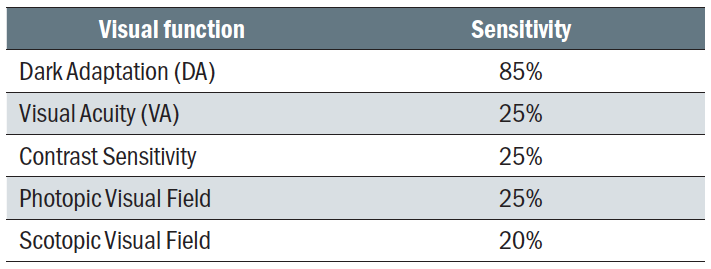 Table 2: Comparison of predictive sensitivity between different vision function tests
Conclusion
As rods account for 90% of the photoreceptors in the healthy macula, the severity of AMD can have a profound effect on this percentage. AMD appears to begin in the parafoveal area, affecting rods predominantly. This preferential loss of rods over cones has been verified in histological studies that show cones survive longer than rods in AMD.6,7 Studies have established that slowed RMDA is associated with increasing AMD severity.20
DA has the potential to detect functional effects that are subclinical and aid in predicting patients at risk of developing AMD. By pairing DA functional testing with established structural exams and imaging, our ability to be better diagnosticians is improved. Confirmation that the patient has delayed DA allows for tailoring their management through frequency of visits and by making appropriate recommendations about their lifestyle risks.39
- Dr Rohit Narayan is a therapeutic optometrist and visiting clinician at Aston University.
References
- Wang, J.S. and Kefalov, V.J., 2011. The cone-specific visual cycle. Progress in Retinal and Eye Research, 30(2), pp.115-128
- Tahir, H.J., Rodrigo-Diaz, E., Parry, N.R., Kelly, J.M., Carden, D., Aslam, T.M. and Murray, I.J., 2018. Slowed dark adaptation in early AMD: dual stimulus reveals scotopic and photopic abnormalities. Investigative Ophthalmology & Visual Science, 59(4), pp.AMD202-AMD210
- Chua, J., Tham, Y.C., Tan, B., Devarajan, K., Schwarzhans, F., Gan, A., Wong, D., Cheung, C.Y., Majithia, S., Thakur, S. and Fischer, G., 2019. Age-related changes of individual macular retinal layers among Asians. Scientific Reports, 9(1), pp.1-11
- Klein, R., Wang, Q., Klein, B.E., Moss, S.E. and Meuer, S.M., 1995. The relationship of age-related maculopathy, cataract, and glaucoma to visual acuity. Investigative Ophthalmology & Visual Science, 36(1), pp.182-191
- Jackson, G.R., Owsley, C. and Curcio, C.A., 2002. Photoreceptor degeneration and dysfunction in aging and age-related maculopathy. Ageing Research Reviews, 1(3), pp.381-396
- Curcio, C.A., Sloan, K.R., Kalina, R.E. and Hendrickson, A.E., 1990. Human photoreceptor topography. Journal of Comparative Neurology, 292(4), pp.497-523
- Curcio, C.A., Owsley, C. and Jackson, G.R., 2000. Spare the rods, save the cones in aging and age-related maculopathy. Investigative Ophthalmology & Visual Science, 41(8), pp.2015-2018
- Alm A, Bill A. A study with radioactively labelled microspheres including flow determinations in brain and some other tissues. Experimental Eye Research. 1973 Jan 1; 15(1):15-29
- Muniz, A., Greene, W.A., Plamper, M.L., Choi, J.H., Johnson, A.J., Tsin, A.T. and Wang, H.C., 2014. Retinoid uptake, processing, and secretion in human iPS-RPE support the visual cycle. Investigative Ophthalmology & Visual Science, 55(1), pp.198-209
- Lamb, T.D. and Pugh, E.N., 2006. Phototransduction, dark adaptation, and rhodopsin regeneration the proctor lecture. Investigative Ophthalmology & Visual Science, 47(12), pp.5138-5152
- Tsin, A., Betts-Obregon, B. and Grigsby, J., 2018. Visual cycle proteins: structure, function, and roles in human retinal disease. Journal of Biological Chemistry, 293(34), pp.13016-13021
- Lamb, T.D. and Pugh Jr, E.N., 2004. Dark adaptation and the retinoid cycle of vision. Progress in Retinal and Eye Research, 23(3), pp.307-380
- Pepperberg, D.R. and Clack, J.W., 1984. Rhodopsin photoproducts and the visual response of vertebrate rods. Vision Research, 24(11), pp.1481-1486
- Richer, S., Ulanski, L., Popenko, N.A., Pratt, S.G., Hitchmoth, D., Chous, P., Patel, S., Sockanathan, S. and Sardi, B., 2016. Age-related macular degeneration beyond the Age-related Eye Disease Study II. Advances in Ophthalmology and Optometry, 1(1), pp.335-369
- Van der Schaft, T.L., Mooy, C.M., de Bruijn, W.C., Oron, F.G., Mulder, P.G. and de Jong, P.T., 1992. Histologic features of the early stages of age-related macular degeneration: a statistical analysis. Ophthalmology, 99(2), pp.278-286
- Curcio, C.A., Medeiros, N.E. and Millican, C.L., 1996. Photoreceptor loss in age-related macular degeneration. Investigative Ophthalmology & Visual Science, 37(7), pp.1236-1249
- Tahir, H.J., Rodrigo-Diaz, E., Parry, N.R., Kelly, J.M., Carden, D. and Murray, I.J., 2017. Slowed dark adaptation in older eyes; effect of location. Experimental Eye Research, 155, pp.47-53
- Owsley, C., Huisingh, C., Jackson, G.R., Curcio, C.A., Szalai, A.J., Dashti, N., Clark, M., Rookard, K., McCrory, M.A., Wright, T.T. and Callahan, M.A., 2014. Associations between abnormal rod-mediated dark adaptation and health and functioning in older adults with normal macular health. Investigative Ophthalmology & Visual Science, 55(8), pp.4776-4789
- Pikuleva, I.A. and Curcio, C.A., 2014. Cholesterol in the retina: the best is yet to come. Progress in Retinal and Eye Research, 41, pp.64-89
- Owsley, C., McGwin Jr, G., Clark, M.E., Jackson, G.R., Callahan, M.A., Kline, L.B., Witherspoon, C.D. and Curcio, C.A., 2016. Delayed rod-mediated dark adaptation is a functional biomarker for incident early age-related macular degeneration. Ophthalmology, 123(2), pp.344-351
- Legge, T., 2019. How to stay one step ahead of AMD. Review of Optometry, 156(6), pp.42-50
- Leibrock, C.S., Reuter, T. and Lamb, T.D., 1998. Molecular basis of dark adaptation in rod photoreceptors. Eye, 12(3), pp.511-520
- Owsley, C., Jackson, G.R., White, M., Feist, R. and Edwards, D., 2001. Delays in rod-mediated dark adaptation in early age-related maculopathy. Ophthalmology, 108(7), pp.1196-1202
- Jackson, G.R. and Edwards, J.G., 2008. A short-duration dark adaptation protocol for assessment of age-related maculopathy. Journal of Ocular Biology, Diseases, and Informatics, 1(1), pp.7-11
- Jackson, G.R., Scott, I.U., Kim, I.K., Quillen, D.A., Ianaccone, A. and Edwards, J.G., 2014. Diagnostic sensitivity and specificity of dark adaptometry for detection of age-related macular degeneration. Investigative Ophthalmology & Visual Science, 55(3), pp.1427-1431
- Chen, K.G., Alvarez, J.A., Yazdanie, M., Papudesu, C., Wong, W.T., Wiley, H.E., Keenan, T.D., Chew, E.Y., Ferris III, F.L. and Cukras, C.A., 2019. Longitudinal study of dark adaptation as a functional outcome measure for age-related macular degeneration. Ophthalmology, 126(6), pp.856-865
- Lesmes LA, Jackson ML, Bex P. Visual function endpoints to enable dry AMD clinical trials. Drug Discoveries Today and Therapeutic Strategy. 2013 Spring;10(1):e43-e50
- Dimitrov, P.N., Robman, L.D., Varsamidis, M., Aung, K.Z., Makeyeva, G.A., Guymer, R.H. and Vingrys, A.J., 2011. Visual Function Tests as Potential Biomarkers in Age-Related Macular Degeneration. Investigative Ophthalmology & Visual Science, 52(13)
- Owsley, C., Clark, M.E. and McGwin, G., 2017. Natural history of rod-mediated dark adaptation over 2 years in intermediate age-related macular degeneration. Translational Vision Science & Technology, 6(3), pp.15-15
- Echols, B.S., Clark, M.E., Swain, T.A., Chen, L., Kar, D., Zhang, Y., Sloan, K.R., McGwin Jr, G., Singireddy, R., Mays, C. and Kilpatrick, D., 2020. Hyper-reflective foci and specks are associated with delayed rod-mediated dark adaptation in non-neovascular age-related macular degeneration. Ophthalmology Retina, 4(11), pp.1059-1068
- Jackson, G.R., Owsley, C. and McGwin Jr, G., 1999. Aging and dark adaptation. Vision Research, 39(23), pp.3975-3982
- Ruberti, J.W., Curcio, C.A., Millican, C.L., Menco, B.P., Huang, J.D. and Johnson, M., 2003. Quick-freeze/deep-etch visualization of age-related lipid accumulation in Bruch’s membrane. Investigative Ophthalmology & Visual Science, 44(4), pp.1753-1759
- Patryas, L., Parry, N.R., Carden, D., Baker, D.H., Kelly, J.M., Aslam, T. and Murray, I.J., 2013. Assessment of age changes and repeatability for computer-based rod dark adaptation. Graefe's Archive for Clinical and Experimental Ophthalmology, 251(7), pp.1821-1827
- Jackson, G.R. and Owsley, C., 2000. Scotopic sensitivity during adulthood. Vision Research, 40(18), pp.2467-2473
- Murray, I., Carden, D. and Kelly, J., 2016. A new instrument for assessing rod function in early AMD. Optician, 2016(7), pp.143791-1
- Lott, L.A., Schneck, M.E., Haegerstrom-Portnoy, G., Hewlett, S., Stepien-Bernabe, N., Gauer, B.M., Zaidi, A., Fu, A.D. and rabyn, J.A., 2020. Simple Vision Function Tests that Distinguish Eyes with Early to Intermediate Age-related Macular Degeneration. Ophthalmic Epidemiology, pp.1-12
- Hess, K., Gliem, M., Birtel, J., Müller, P., Hendig, D., Andrews, C., Murray, I.J., Holz, F.G. and Issa, P.C., 2020. Impaired dark adaptation associated with a diseased Bruch membrane in pseudoxanthoma elasticum. Retina, 40(10), pp.1988-1995
- Owsley, C., Jackson, G.R., Cideciyan, A.V., Huang, Y., Fine, S.L., Ho, A.C., Maguire, M.G., Lolley, V. and Jacobson, S.G., 2000.