As I clicked on save to send the dataset from the eye examination scurrying down a fibre optic cable to its digital home somewhere in the cloud, I reflected on how much things have changed since an enthusiastic young optometrist was first released on the public some 40 years ago. Back then, the dataset (then called a record) was written on a blank card on which the receptionist had kindly added the patient’s name and address.
Even though the abbreviation NAD (meaning ‘nothing abnormal detected’) was denigrated, even then, it really was a reasonable description of the outcome of many tests. Given the tools available at the time, it was often impossible to declare with any great certainty that a patient’s eyes were entirely healthy. I tried my best but, in truth, my efforts to view fundi through small pupils and cloudy media using a direct ophthalmoscope were often rewarded with no more than a fleeting glimpse of a disc or an occasional blood vessel.
Assessment of vision was limited to recording the lowest row of letters the patient could read on a back-illuminated Snellen chart. In one practice where I worked, a note beneath the chart warned that the chart was actually at 4.8m (rather than the 6m it was designed for) so a ‘suitable allowance should be made’ – time to dig out some old visual optics notes.
In another practice, I was always baffled by the fact that patients seemed to struggle to read the letters on the left side of the lower rows. The mystery was solved one day when a receptionist entered the consulting room, opened the Snellen cabinet, and placed the day’s takings in a secure place, resting against the letters on the left side. She was clearly unaware of the relationship between acuity and luminance. Replacing the light bulbs in a Snellen cabinet also caused some excitement with patients often experiencing a miraculous improvement in visual acuity.
Near ‘acuity’ was assessed using a yellowing card showing paragraphs of obscure prose (who remembers ‘I am glad to say that I have never seen a spade vows mice immune’?), of varying sizes marked in units of 1/72 of an inch (point size) and a plethora of other cards and books provided an eclectic mix of tests including stereopsis, central vision and colour vision. Binocular vision was assessed using a cover test, Maddox Rod and Wing and the revolutionary Mallett units. Visual fields were assessed using a Bjerrum screen (yes, I am that old).
There is absolutely no doubt that patients I have examined more recently have received a better standard of care. Partly because, hopefully, I have honed my skills as a clinician somewhat over the years, but mainly because of advances in the technology used during a typical eye examination.
Thanks to OCT and related technology, it is now possible to visualise all parts of the eye with a clarity and resolution that was only available in artists’ impressions 40 years ago. Autorefractors and corneal topographers provide a mindboggling array of information about a patient’s refractive status before going near a trial lens. Instruments for assessing visual fields have also benefitted from technological advances and elegant algorithms now provide information about the most subtle changes in sensitivity across the visual field. More recently, even the assessment of binocular vision has begun to catch up, with tools such as the Clinical Eye Tracker becoming increasingly familiar in eye care practice.
Last, but not least, back-illuminated test charts and projectors have largely been replaced by computerised test charts. These have greatly improved the accuracy of visual acuity measurements and provided clinicians with a wide range of new tools for vision assessment.
These two articles will explore the evolution of vision assessment and answer some of the common questions about the implementation of test charts in practice based on the author’s experience of developing test chart software that is now used in more than 8,000 consulting rooms around the world. The potential of new technology for remote vision assessment and self-administered testing will also be explored.
High Contrast Visual Acuity
Given that the primary role of optometrists is to optimise vision, having a set of robust tools for quantifying each patient’s visual experience would seem to be a prerequisite.
Historically, high contrast visual acuity has been the mainstay of clinical vision assessment.1-3 The test is simple and quick to perform, and, in most cases, measurements correlate reasonably well with the patient’s visual experience – symptoms of poor vision usually equate to reduced visual acuity. As the ability to read letters is a common task in everyday life, the use of letters for assessing visual acuity also gives the test good face validity. Visual acuity is also remarkably robust and measurements remain reasonably stable over a range of test conditions.
High contrast visual acuity is sensitive to refractive blur (the most common cause of poor vision) and changes affecting the macula/central visual field.4 While there are occasions when high contrast acuity can overestimate and occasionally underestimate a patient’s visual capability, these cases are relatively rare and will be covered later.
Design Of Acuity Charts
The first letter chart for measuring visual acuity was introduced in 1862 by Dutch ophthalmologist Herman Snellen.4,5 He selected a subset of characters and stylised them to fit on a 5x5 grid where the thickness of the strokes of the letters was one unit on the grid (1/5th of the letter size). The letters (optotypes) were then arranged in decreasing size on a rectangular panel as shown in figure 1.
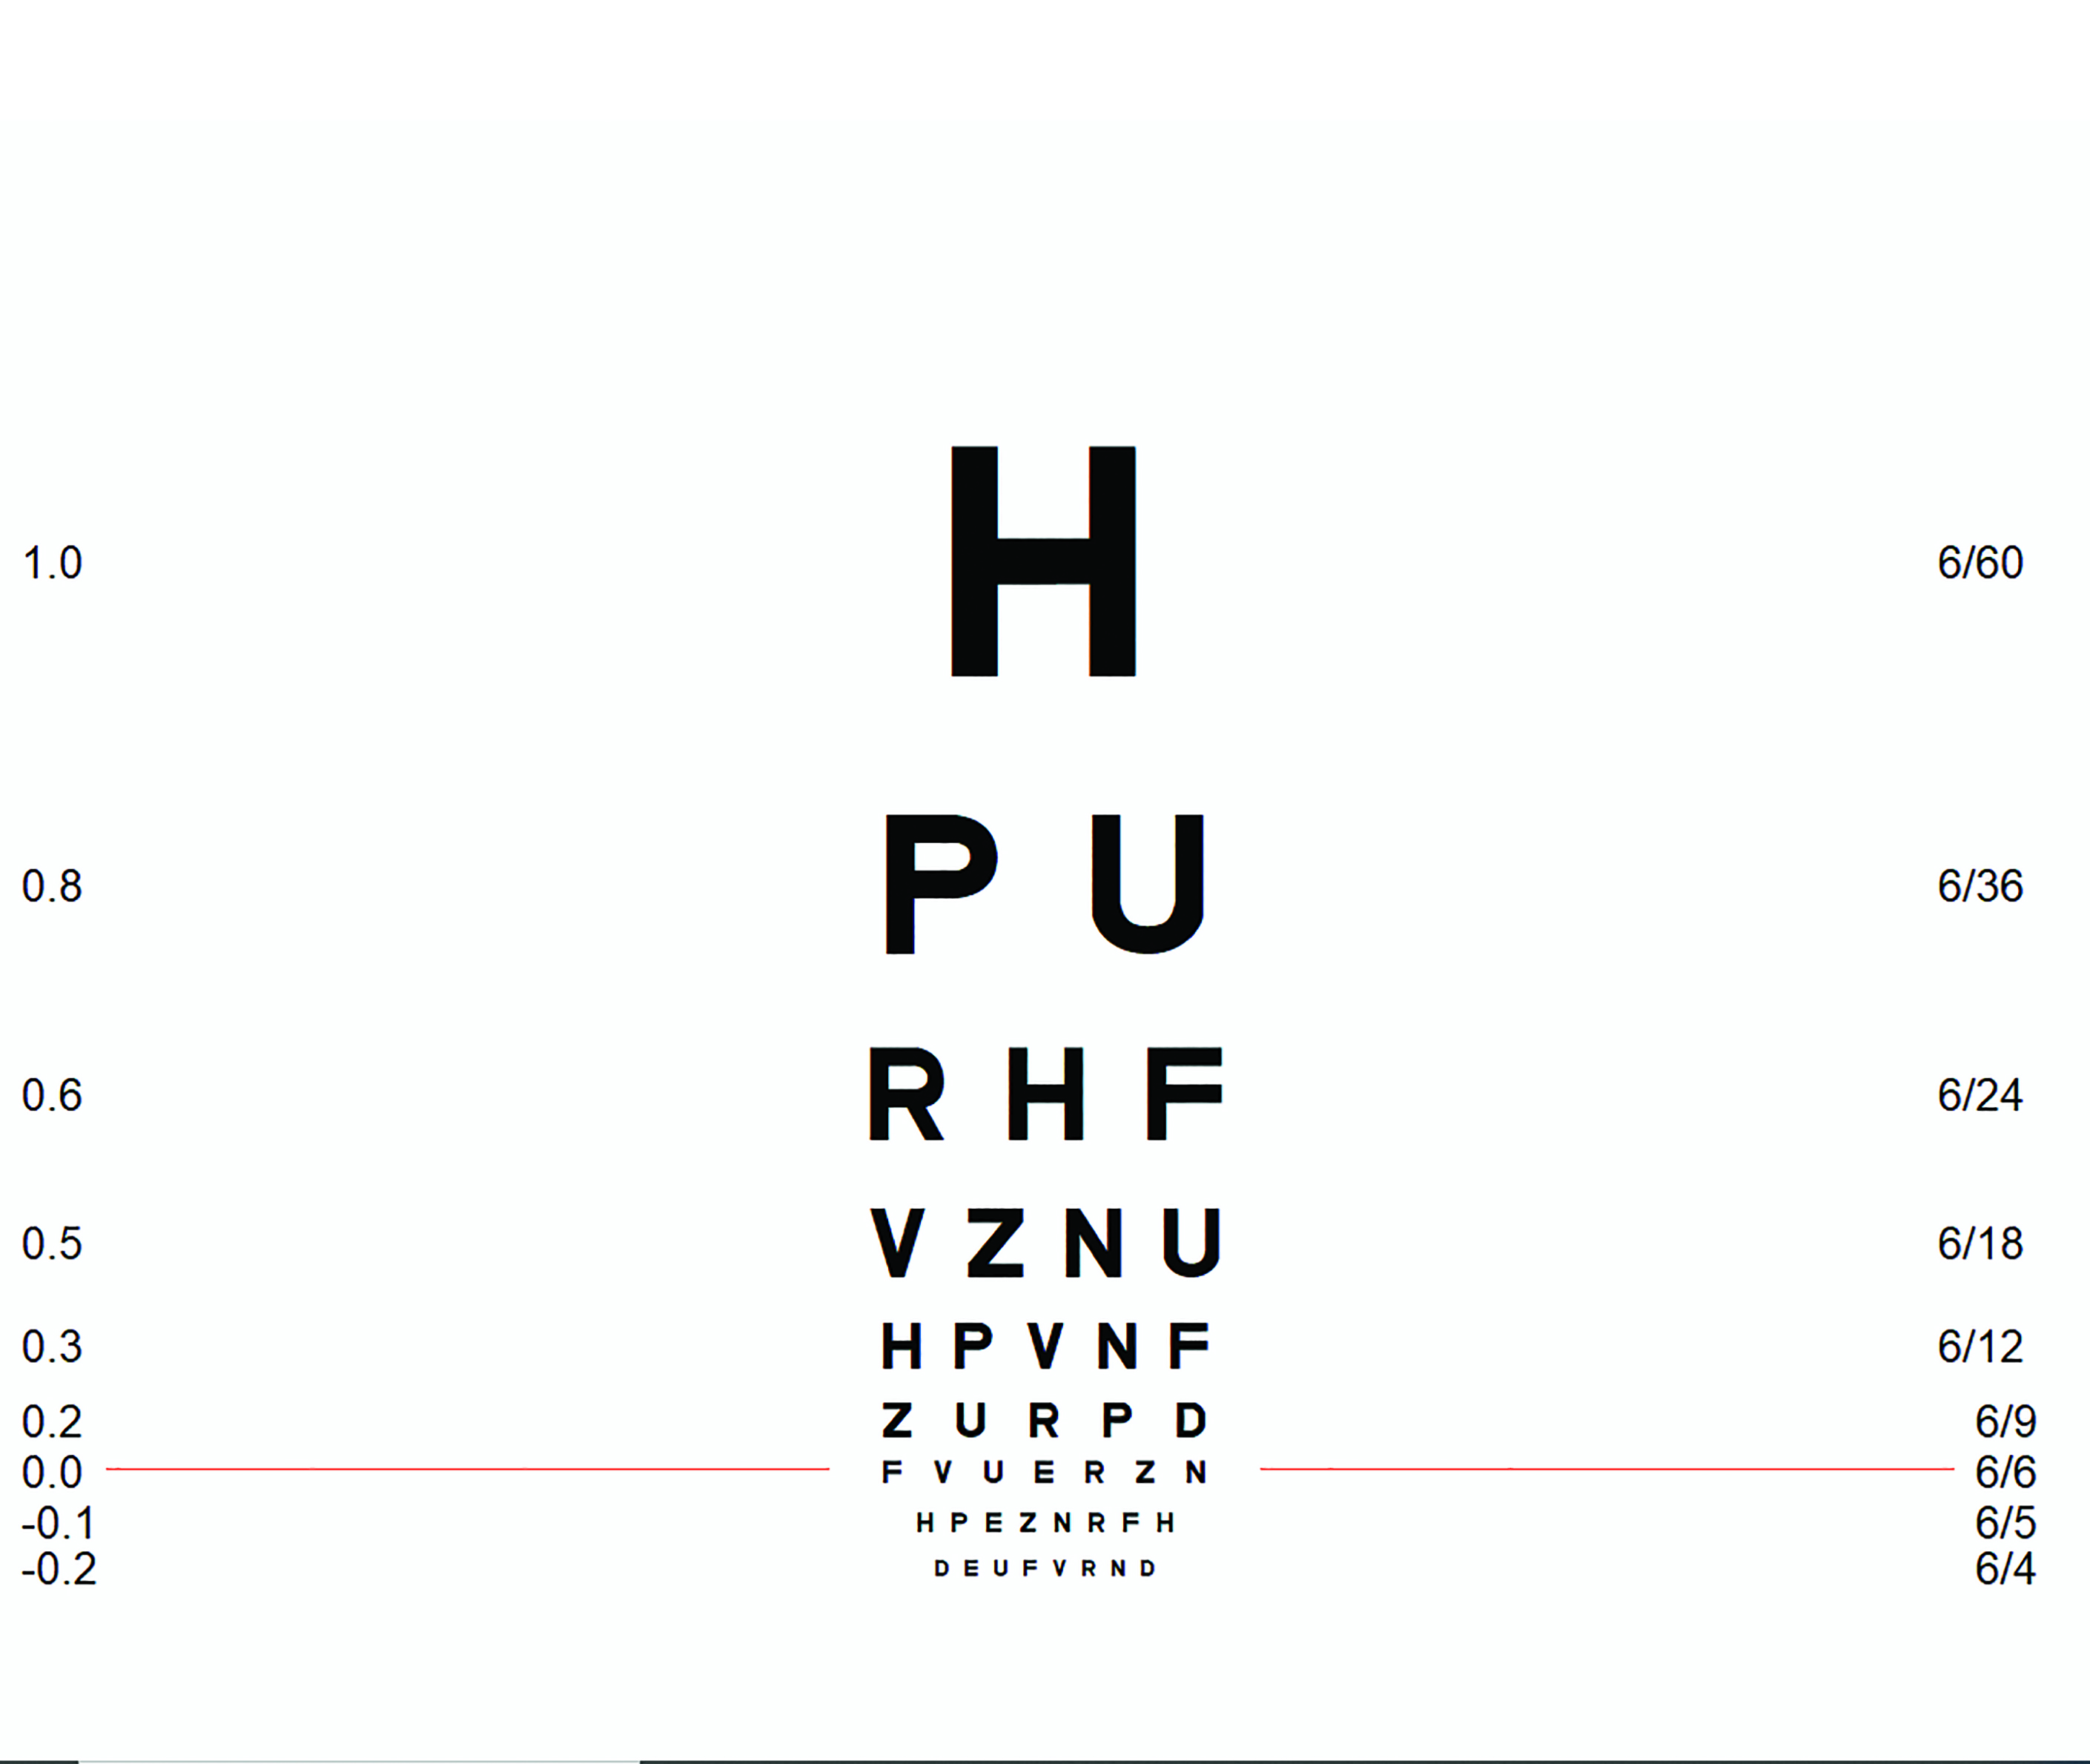
Figure 1: Snellen chart labelled in LogMAR and Snellen notation (image courtesy of Thomson Software Solutions)
Snellen defined ‘standard vision’ as the ability to recognise one of his optotypes when it subtended 5 minutes of arc (5’). Thus, the strokes of the letter subtended 1’. Snellen also proposed that the size of the letters should be specified as a fraction relative to ‘standard vision’ in the format:
Chart viewing distance
_________________________________
Distance at which the letter subtends 5’
Therefore, for a chart placed at six metres, letters on the 6/6 row subtend 5’, letters on the 6/12 row subtend 10’ and letters on the 6/60 row subtend 50’ etc. In the US, and other countries that use Imperial units, the standard viewing distance is 20 feet, so the equivalent of 6/6 is 20/20, 6/12 is 20/40 and 6/60 is 20/200 etc. In most European countries, the Snellen fraction is expressed as a decimal, so the equivalent of 6/6 is 1, 6/12 is 0.5 and 6/60 is 0.1 etc (table 1).
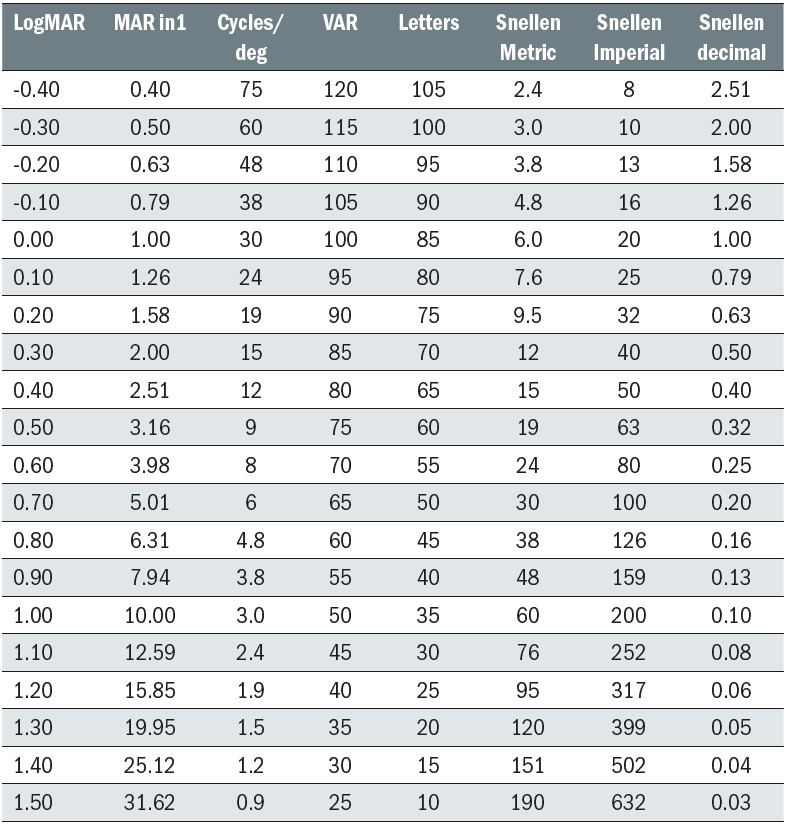 Table 1: Table showing equivalents to LogMAR scores in common notations
The Snellen chart soon became the preferred method for assessing vision and has survived to the present day with relatively few changes (see BS 4274-1:1968 and BS4274-1:2003).4
However, while the Snellen chart ‘did the job’ as a psychophysical test, it has several serious design flaws.1,4-7 These include:
- The chart has a different number of letters on each row so a patient with a visual acuity of 6/6 must read seven letters while a patient with a visual acuity of 6/60 reads only one.
- The letter size follows an irregular progression of letter sizes which is akin to using a ruler marked with different length graduations (as illustrated beautifully by an optometry student in figure 2). It also limits the usefulness of the Snellen chart for research purposes.
- The spacing between letters and rows bears no systematic relationship to letter size, resulting in varying degrees of crowding/contour interaction on each row.
- Scoring is based on the smallest row of letters that can be read. In practice, patients seldom read all the letters on one row and none of the next. Clinicians often record this as, for example, 6/9+2 or 6/12-1, but the lack of standardisation can lead to confusion and errors (figure 2).
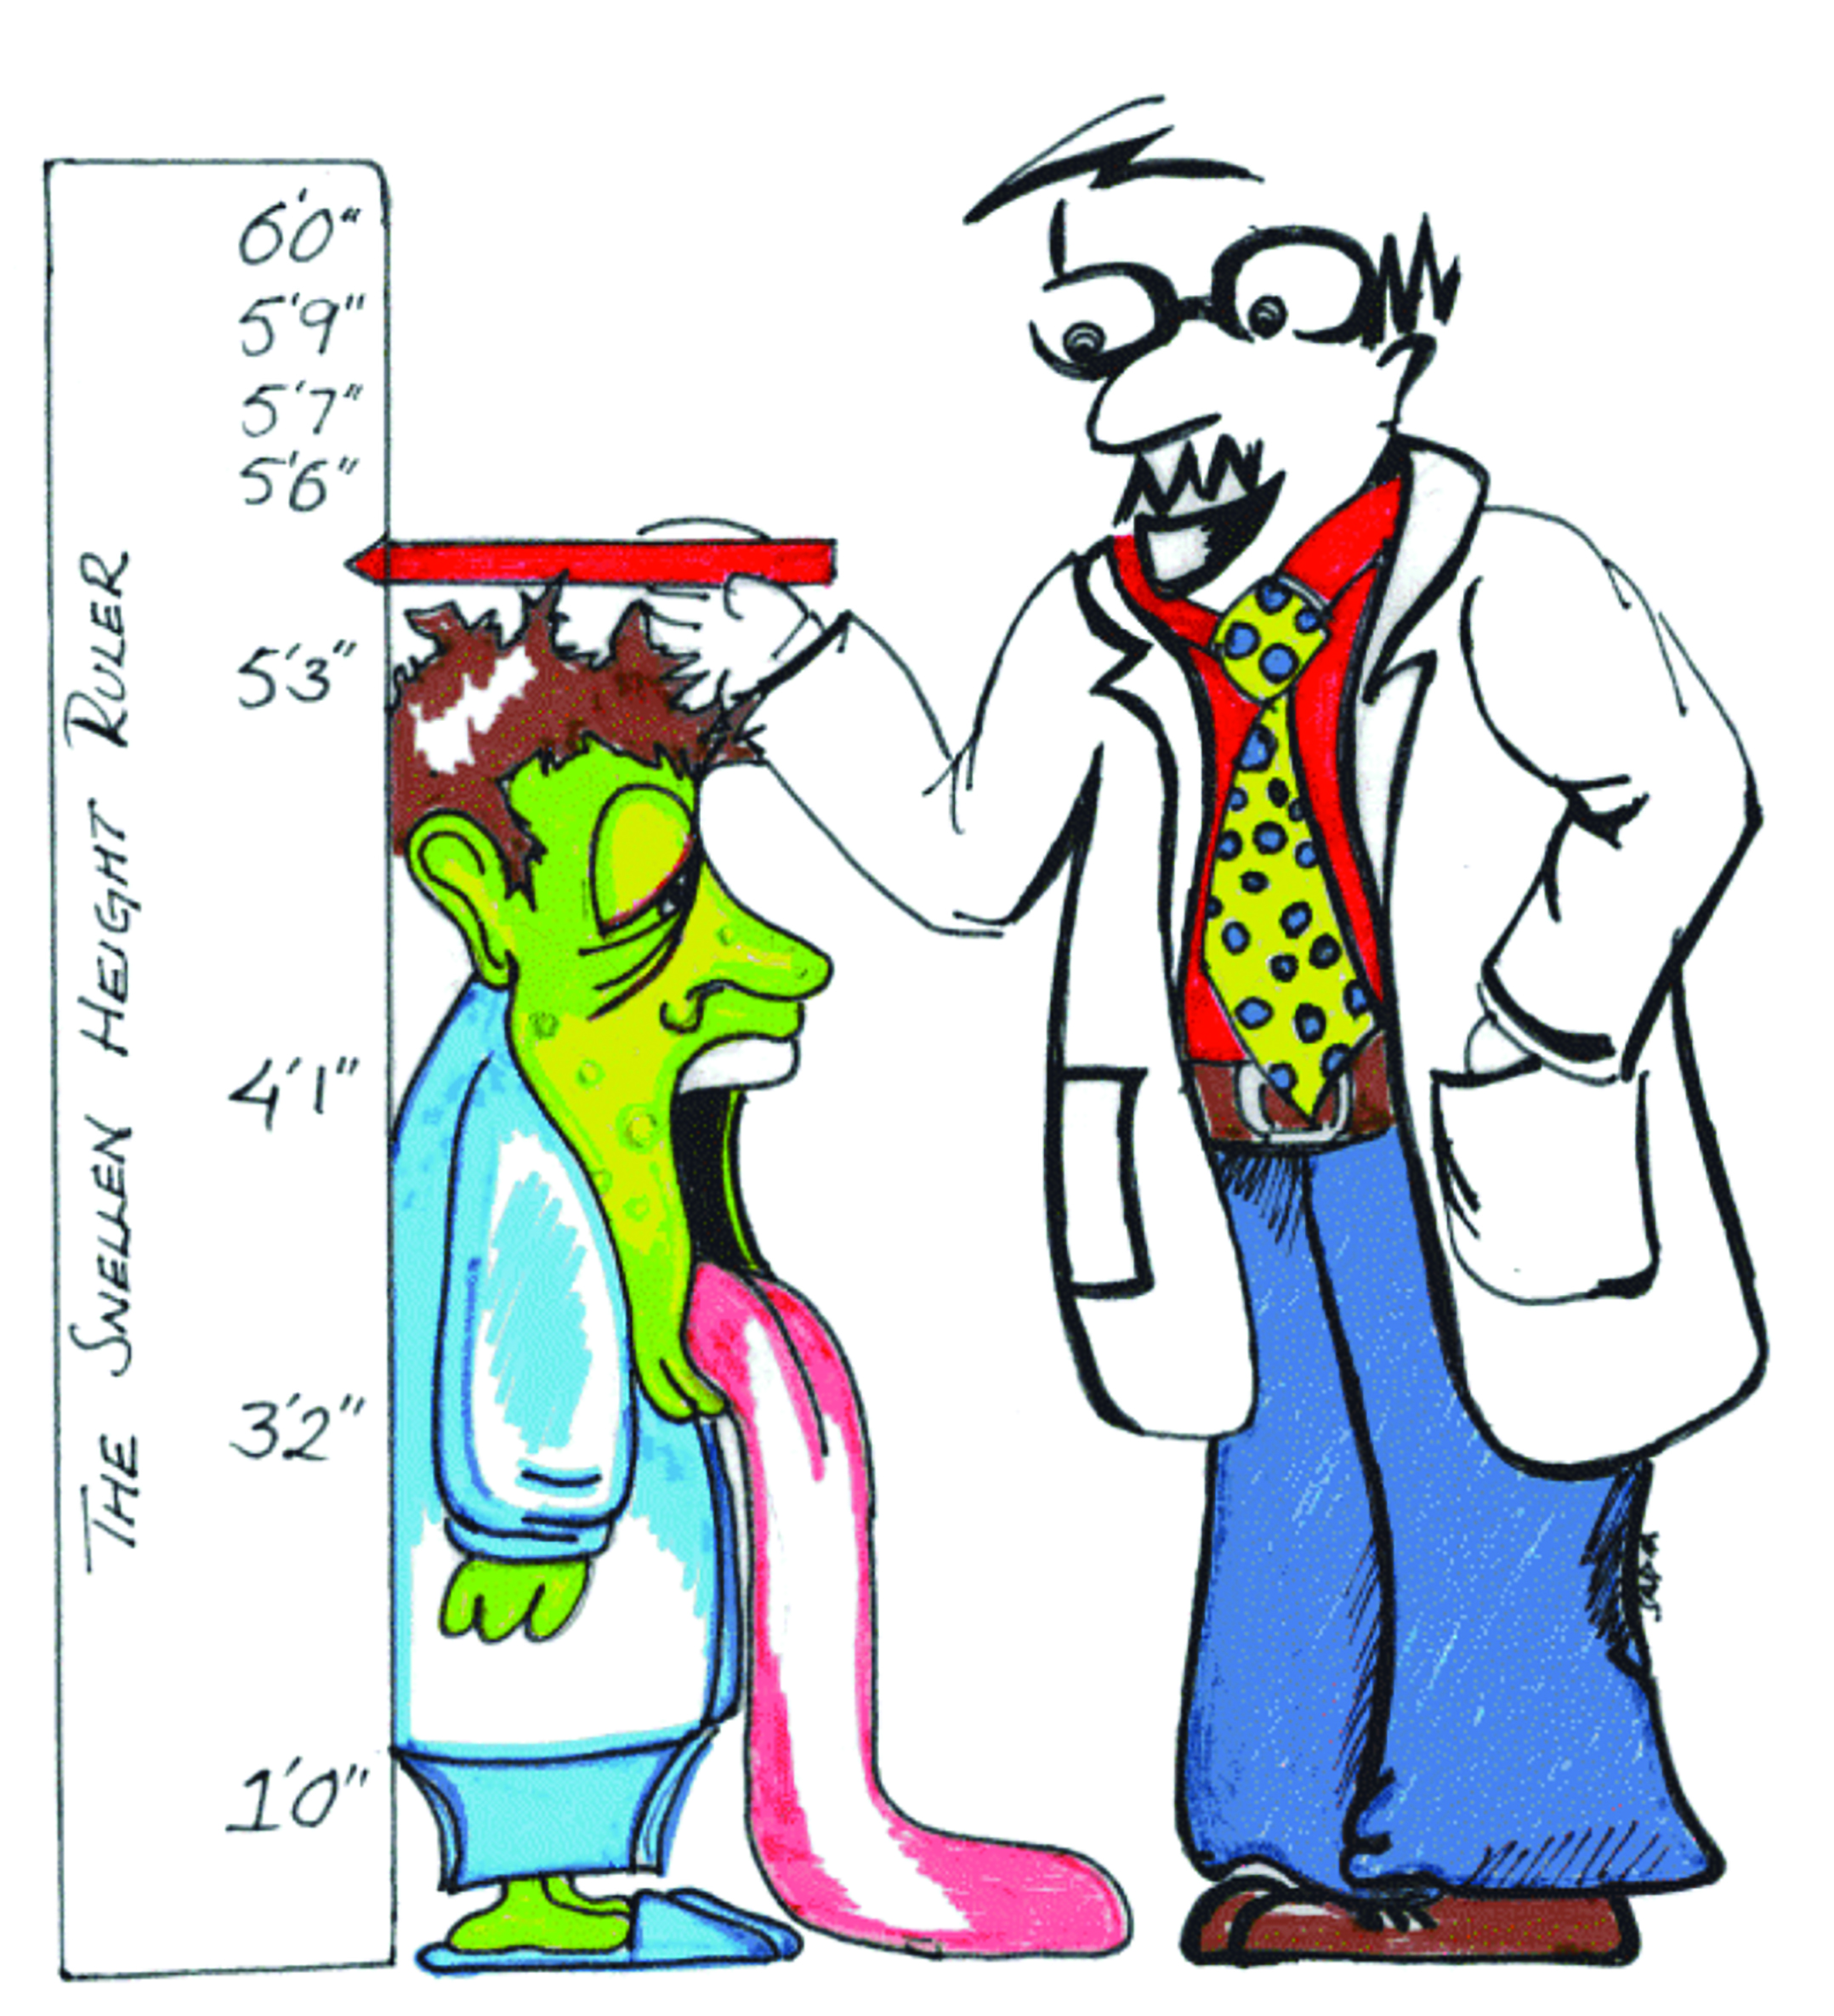 Figure 2: If there was a Snellen ruler… ‘Your Snellen height is 5’6’’ minus’
A variety of alternative chart designs have been proposed over the years, but a design rejoicing in the name ‘LogMAR’ (Bailey-Lovie) has emerged as the frontrunner to replace the Snellen chart.8,9
‘LogMAR’ is an acronym of log of the minimum angle of resolution. This refers to the smallest angle between two points that can be resolved by the eye. In a healthy emmetropic eye, this limit is set partly by the wave nature of light (Rayleigh criterion) and partly by the spacing of the cones at the fovea and is approximately one minute of arc.4 The MAR of an optotype is usually taken as being 1/5 of the angle subtended by the letter – Snellen’s definition of a ‘standard eye’ has stood the test of time.
So, the MAR of a 6/6 letter is 1’ and therefore the LogMAR equivalent is Log10 1=0, the LogMAR equivalent of 6/12 is Log10 2=0.3 and 6/60 is Log10 10=1. For letters smaller than 6/6, the LogMAR value is negative. For example, 6/3 is equivalent to Log10 0.5=-0.3 (table 1).
The LogMAR chart (see figure 3) overcomes most of the design flaws of the Snellen chart.6,10,11 For example:
- The chart has five letters on every row.
- The letter size follows a logarithmic progression of letter sizes, increasing in 0.1 LogMAR steps.
- The gap between the letters is equal to one letter width and the gap between the rows is equal to the height of the letters on the row below. Thus, the crowding/contour interaction is kept constant relative to the letter size.
- Because there are five letters on every row, scoring can give credit for every letter correctly read avoiding the ambiguity associated with Snellen scoring.
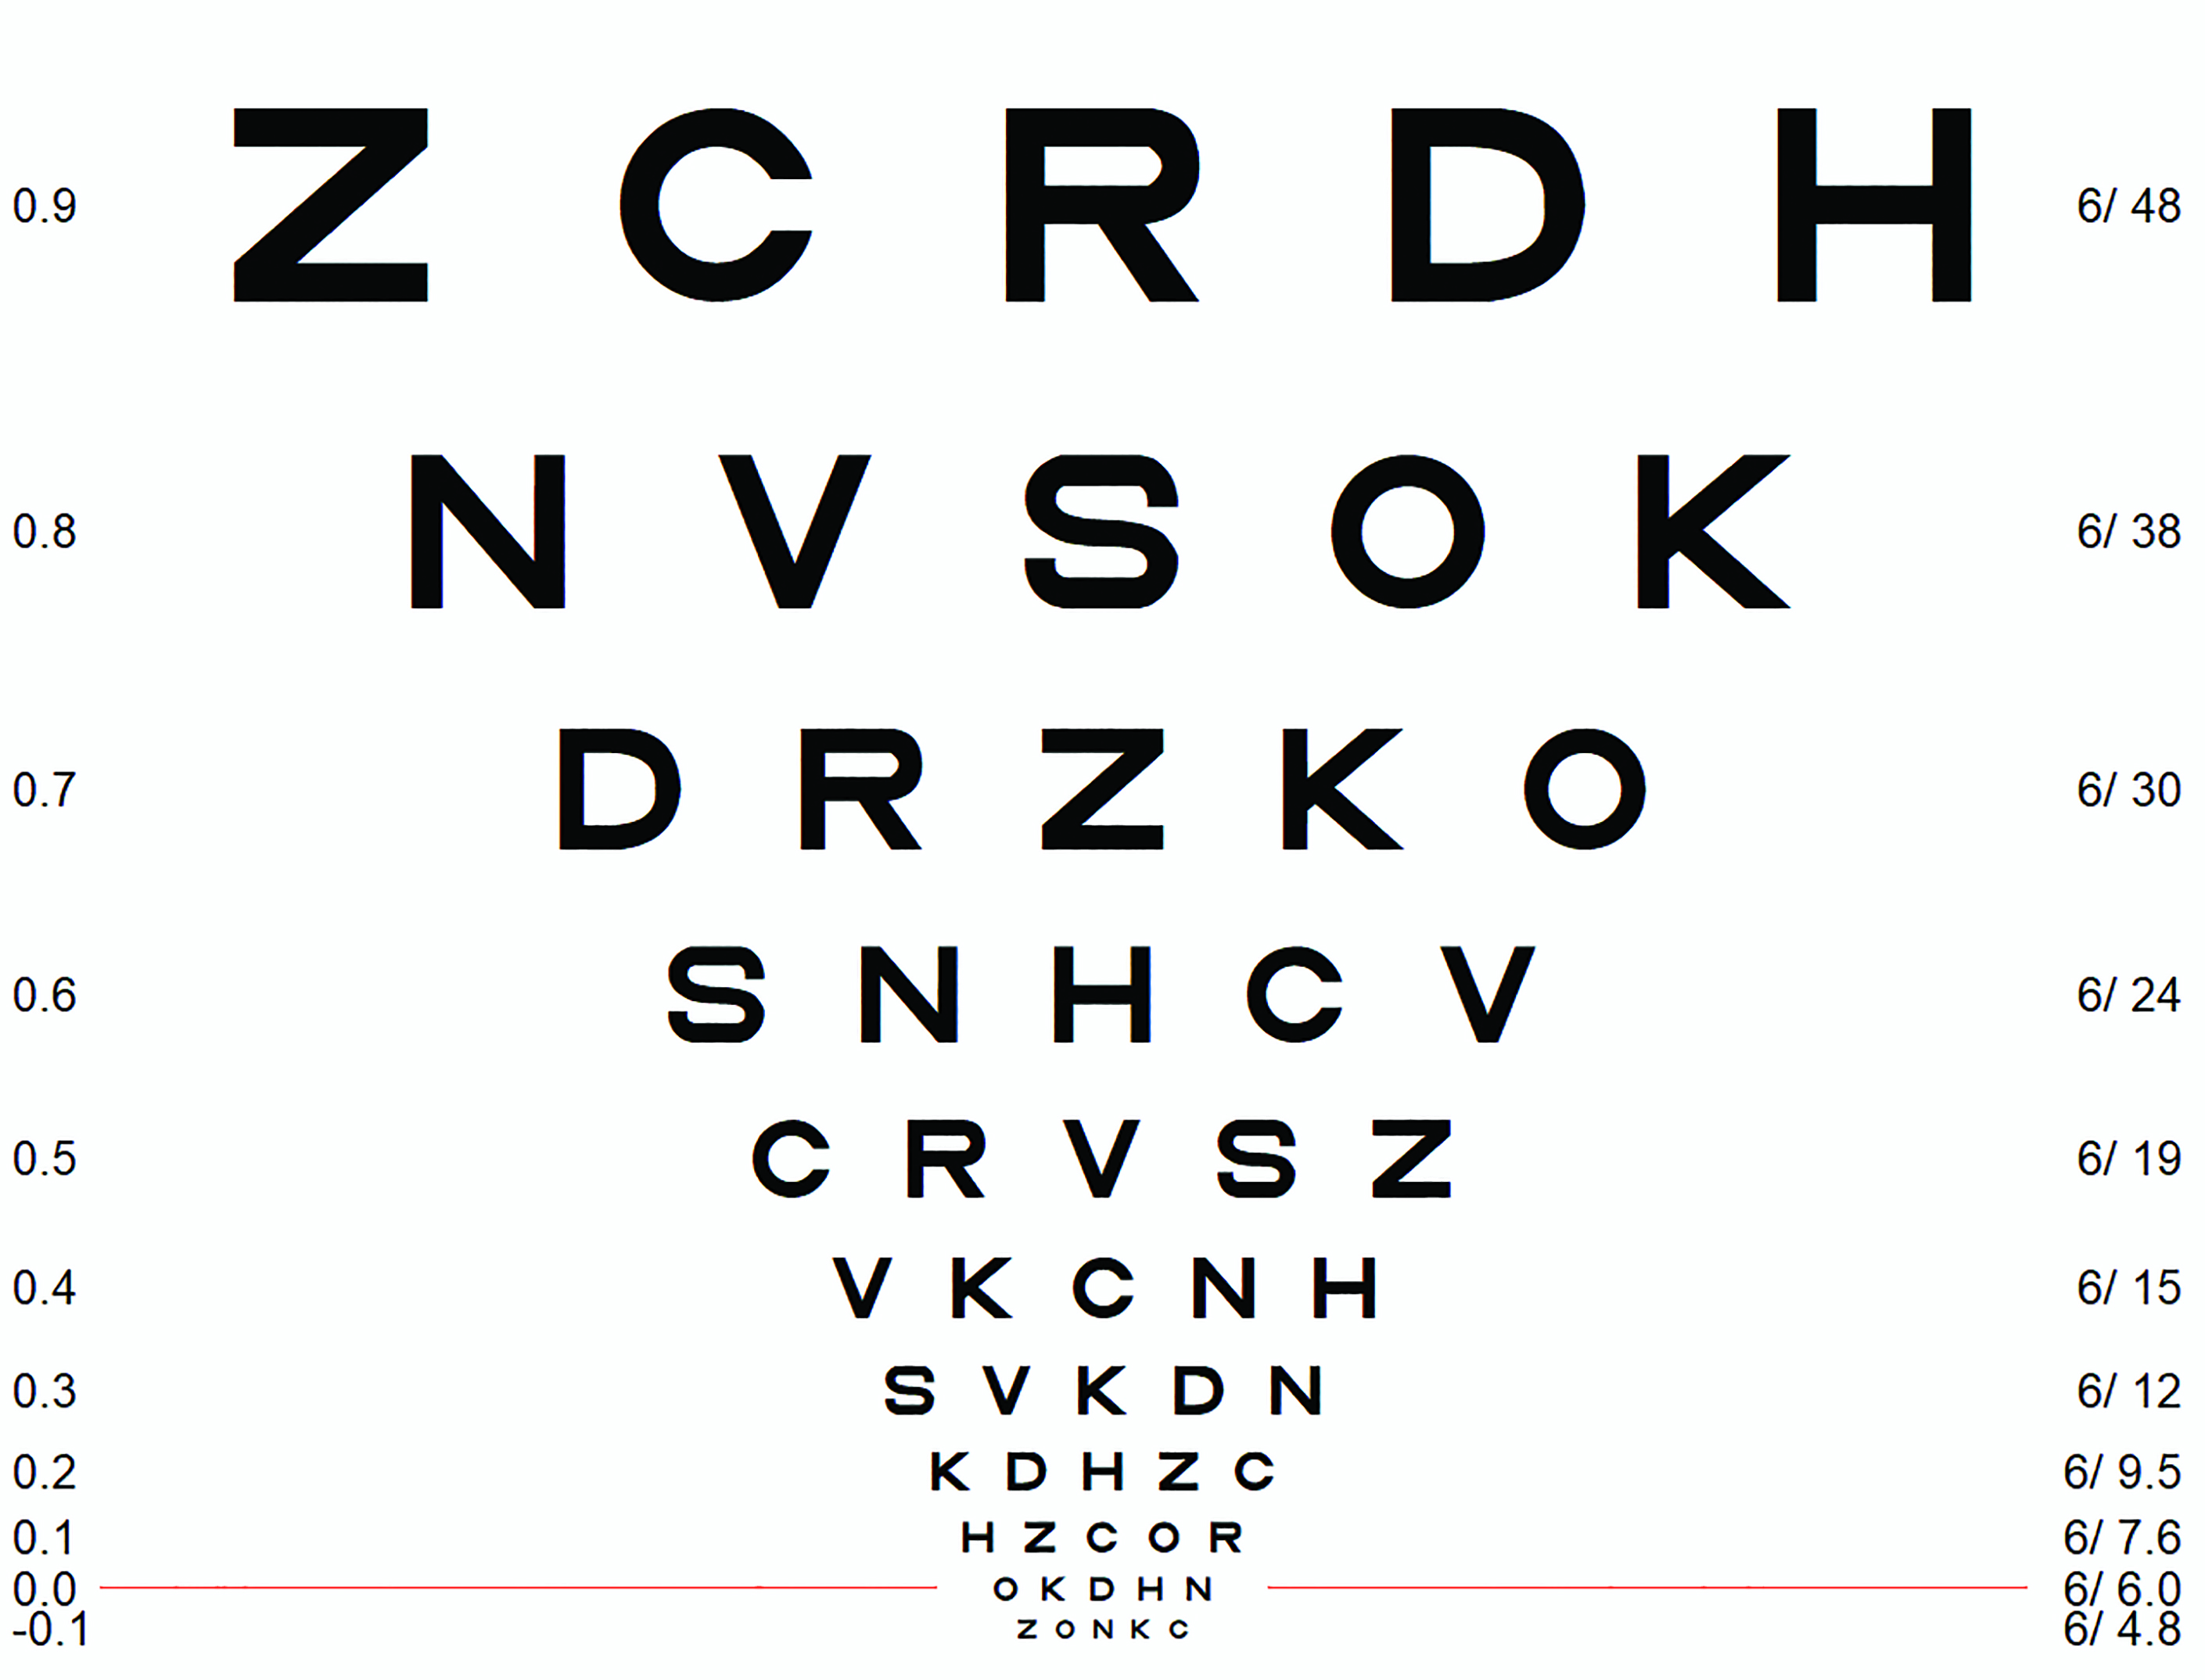 Figure 3: LogMAR chart labelled in LogMAR and Snellen notation (image courtesy of Thomson Software Solutions)
LogMAR Scoring
The standard method for scoring a LogMAR chart involves assigning a score to every letter correctly identified. As the letter size increases in steps of 0.1 LogMAR for each row and there are five letters on each row, each letter is assigned a value of 0.02 (0.1/5).
Therefore, if a patient reads all the letters on the LogMAR 0.0 row and no letters on the row below, their score is simply 0.0. If they get one letter wrong on this row, their score is 0.02, two letters wrong 0.04 etc. If they read all the letters on the 0.0 row and one on the row below, their score is -0.02, two letters on the row below -0.04 etc.
While standard LogMAR scoring has the advantage of giving credit for every letter correctly identified, the process of adding and subtracting multiples of 0.02 in a busy clinic does require a degree of mental agility. Furthermore, the fact that good vision is represented by a negative LogMAR score is rather counterintuitive.
A variety of ‘simpler’ scoring methods have been proposed.6 One method that has become popular in hospitals is counting letters from a predefined starting point (usually LogMAR 1.6). Each row is simply labelled according to the total number of letters from the starting point, so the LogMAR 0.0 row usually equates to 85. If a patient reads one letter incorrectly on this row, the score is 84, two letters 83 etc. While the simplicity of this method is attractive, the score is dependent on the starting point (which sometimes differs between clinics). The situation is often further complicated by the fact that patients with very poor vision are sometimes moved closer to the chart, which requires an appropriate number of letters to be subtracted from the score (table 1).
Another scoring method that has achieved some clinical acceptance is the Visual Acuity Rating (VAR). This is defined as 100- 50*LogMAR so that LogMAR 0.0 (6/6) equates to a VAR of 100 and each letter has a value of 1.
Therefore, if a patient reads the LogMAR 0.0 row their VAR score is 100. If they get one letter wrong, their score is 99, two letters 98, and so on. If they read all the letters on the LogMAR 0.0 row and one letter on the row below, their score is 101, two letters 102 and so on. This greatly simplifies the scoring process and provides a score which could have some meaning for patients; 100 is normal, 105 is slightly above average, 95 is slightly below average. The VAR score can also be readily converted back to a LogMAR score for referral purposes (table 1).
With students being taught LogMAR scoring from the outset, this is likely to become completely intuitive to them. For those of us converting from Snellen to LogMAR, VAR scoring has much to commend it.
Most computerised charts offer the user a choice of scoring methods for both Snellen and LogMAR charts. However, a degree of caution is required in applying a ‘non-native’ score to a chart (for example deriving a LogMAR score from a Snellen chart). Differences in chart design and the progression of letter sizes will lead to significant errors in specifying a LogMAR score from a Snellen chart and vice versa.7,12
Optotypes and Pictograms
Snellen’s original optotypes were based on a subset of letters, stylised to fit on a 5x5 grid. The original optotypes were a serif style reflecting the typography of the time. Later iterations of the Snellen chart used sans-serif characters and a reduced subset of letters.5
While the use of letters to assess vision is quick and easy and has some face validity, letters are not an ideal test of spatial resolution.13 Letters contain strokes at different orientations and have varying gaps between strokes. The overall shape and stroke area of the letter can give cues for recognition and some letters are more easily confused than others. In fact, designing an optotype is a highly complex business and is never completely successful.14,15
There have been various attempts to minimise the variability associated with letter optotypes, but the most widely accepted are the 10 ‘Early Treatment of Diabetic Retinopathy Study’ (ETDRS) Sloan letters.12 These stylised letters are arranged on a 5x5 grid and have a stroke wide of 1/5 of their overall size. Despite careful design of the optotypes, some are still easier to recognise than others. The ETDRS charts attempt to compensate for the variation in letter difficulty by mixing harder and easier optotypes on each row.16 While not perfect, the ETDRS chart has become the gold-standard for the measurements of acuity.
For patients who are unable to name letters, a truncated set of Sloan letters (HOTV) or a set of pictograms may be used. These can be used with a matching chart for individuals unable to name the letter or shape.
A variety of pictograms have been developed over the years, including Lea symbols,17 Patti Pics, Kay pictures and Allen figures. The Lea symbols and Patti Pics use a small number of simple shapes and results have been shown to be reliable and well-correlated to ETDRS measurements.17,18 However, the small number of shapes increases the probability of guessing correctly. Developing larger sets of unique, simple shapes that are equally legible/confusable is difficult and many sets include items with variable stroke width and/or irregular aspect ratios, which make it difficult to maintain consistency in the placement and size of crowding elements.18,19 The Auckland Optotypes include 10 carefully designed pictograms that show considerable promise (figure 4).14
 Figure 4: Auckland Optotypes (taken from https://auckland.figshare.com/OpenOptotypes)
Vanishing Optotypes
Another approach to assessing visual acuity was developed in the ’70s20-22 and involved the use of ‘high-pass’ acuity targets. These are stimuli that have been filtered to remove the low spatial frequency content (figure 5). Any condition that results in a loss of high spatial frequency sensitivity (visual acuity) will cause such stimuli to ‘vanish’. Hence the term ‘vanishing optotypes’.
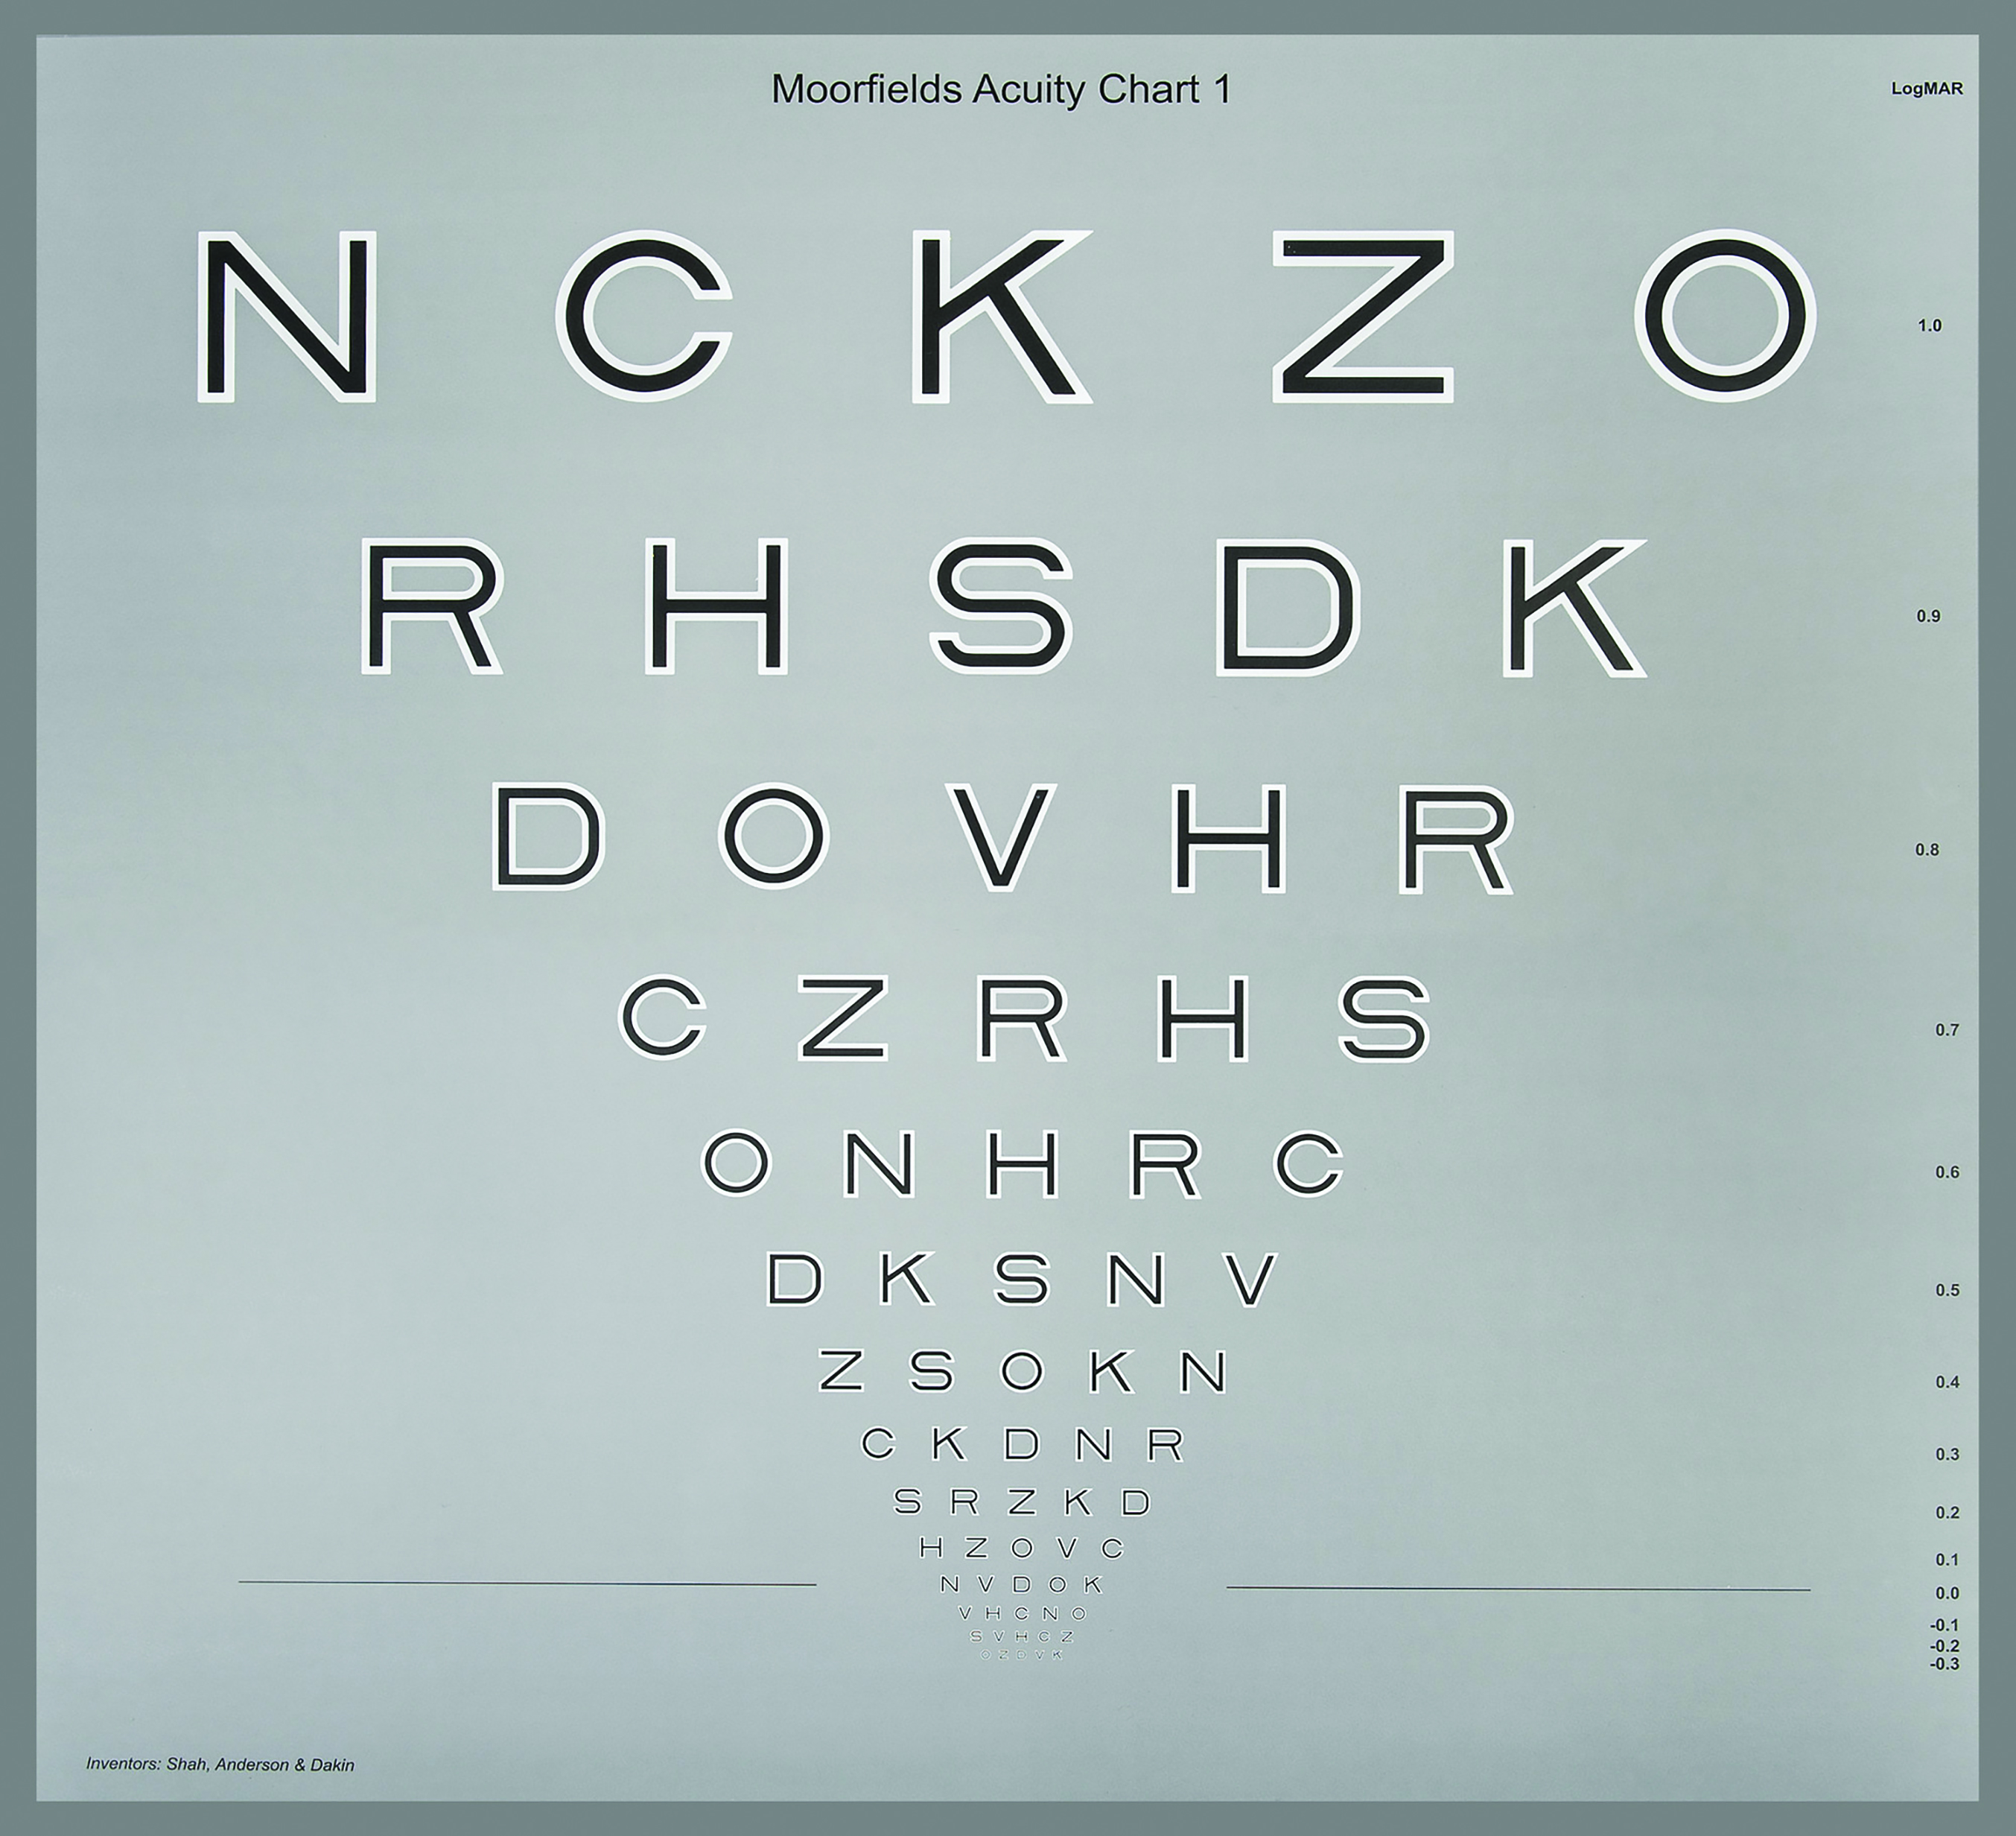 Figure 5: The Moorfields Acuity Chart (taken from www.ulster.ac.uk/research/topic/biomedical-sciences/research/optometry-and-vision-science/research/moorfields-acuity-chart)
The best-known test using high-pass targets is the Cardiff Acuity card test.23,24 This test incorporates high-pass pictograms in a preferential looking format making the test ideal for testing infants and patients with learning difficulties.
More recently, the Moorfields Acuity Chart has adopted the high-pass principle but uses Sloan letters in an ETDRS chart format (figure 5).25,26 In a study involving subjects with AMD,27 the Moorfields Acuity Chart demonstrated a significant improvement over the ETDRS chart in detecting functional vision loss.
This approach shows considerable potential for clinical vision assessment although accurate representation of vanishing optotypes on a computer screen presents some challenges in terms of screen calibration.
Charts, Projectors or Computer screens?
The first generation of test charts were printed on card and externally illuminated. Charts were designed to be used at a specific distance (usually 6m or 3m), and so providing uniform illumination could be a challenge.28
The next generation used charts printed onto translucent glass or plastic and back-illuminated. While back-illumination provided more standardisation, the back illumination was often rather non-uniform and the use of incandescent lamps in some charts resulted in significant changes in luminance as the lamps aged.
Projector charts provided more flexibility, allowing the clinician to select a variety of charts and other test stimuli. The main drawback of projection charts is that the contrast of the projected charts is compromised by any ambient illumination falling on the screen. Therefore, subdued illumination is required in consulting rooms using projection charts.28
Computer screens have been used for displaying visual test stimuli since the very early days of computers.29,30 However, it was not until the development of flat panel displays in the 1990s, that computerised test charts became a viable proposition for clinical settings. These displays were high contrast, flicker-free and light/wall-mountable. Since then, the quality and resolution of these screens has improved dramatically while the price has plummeted and modern screens provide an ideal canvas for displaying an almost infinite array of test stimuli (figure 6).
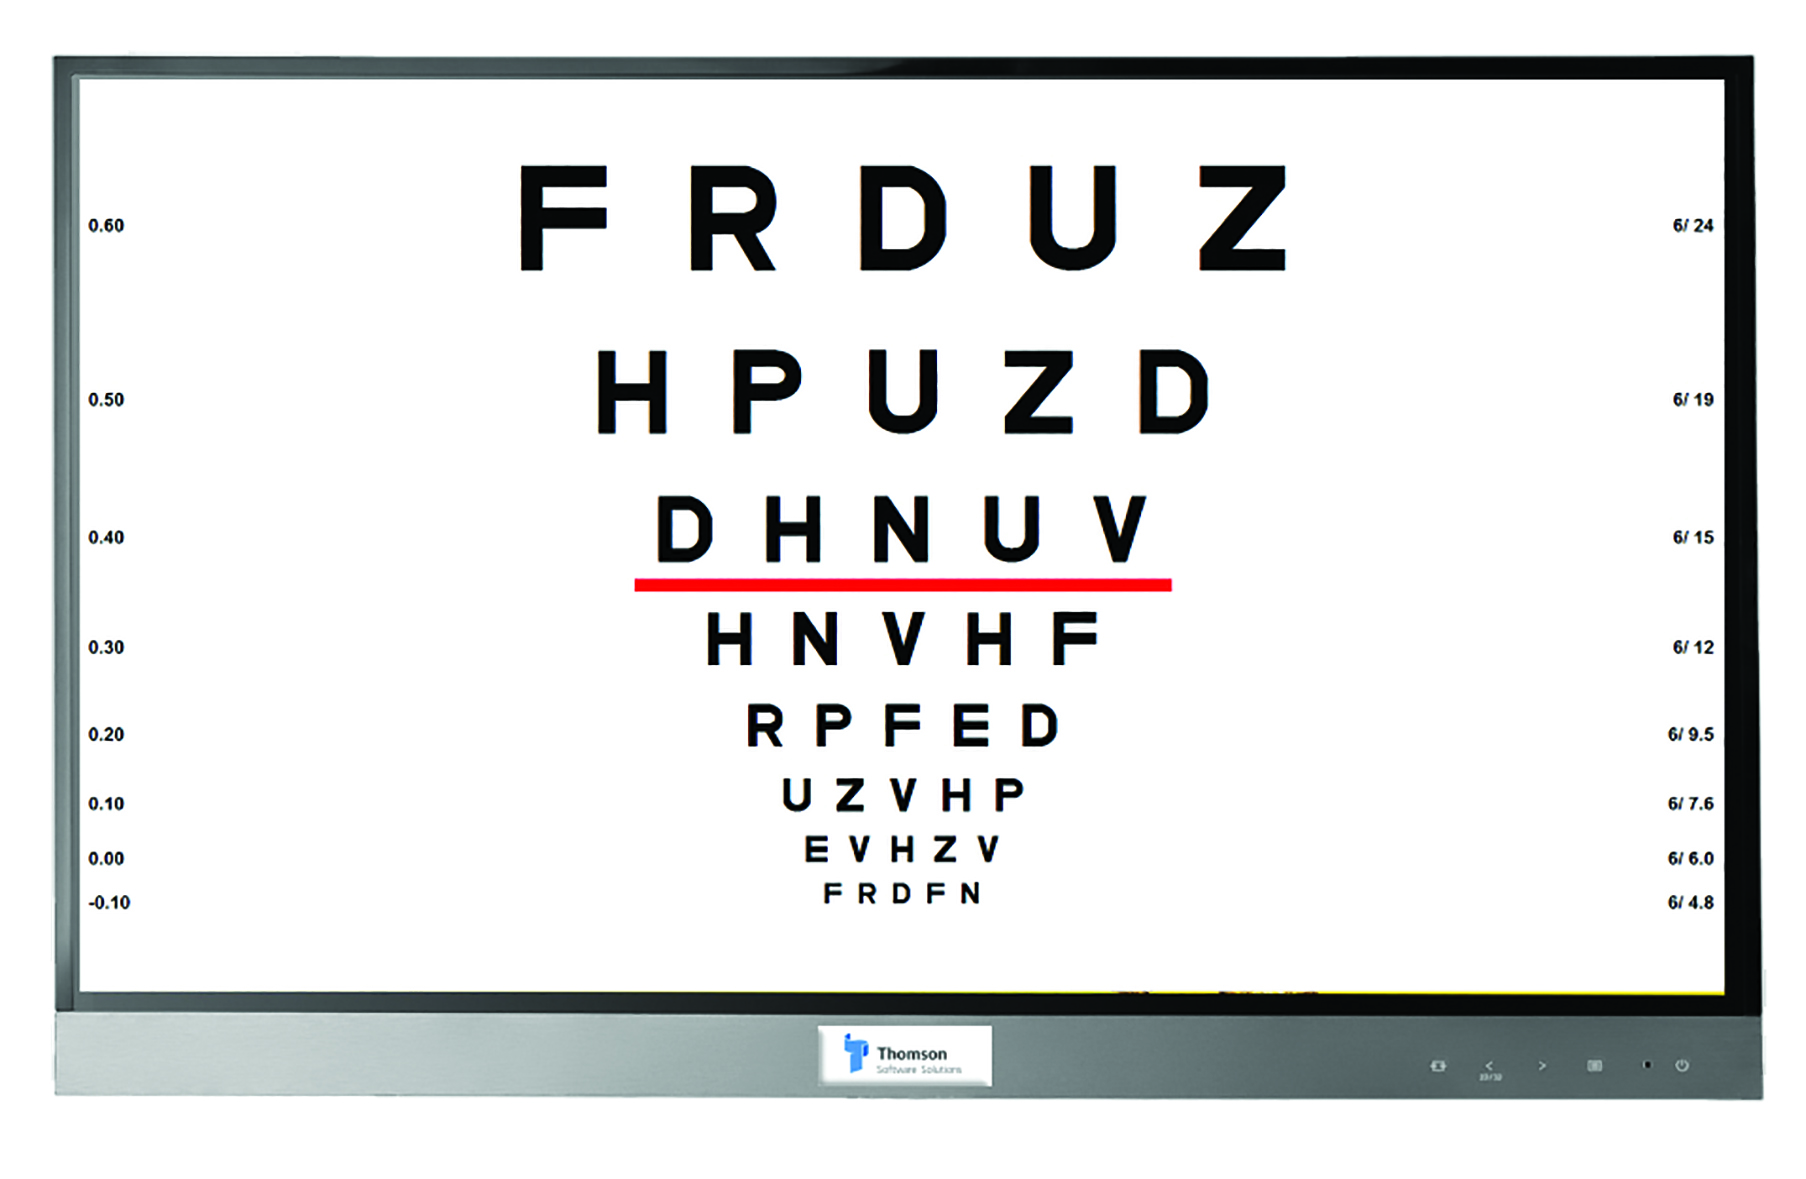 Figure 6: The Thomson Test Chart (image courtesy of Thomson Software Solutions)
Most screens can achieve a luminance of between 120 and 400cdm-2 (as required by test chart standards).4 The luminance across most screens is usually acceptably uniform and very stable over time. Screen contrast is usually in excess of 500:1 and remarkably immune to ambient lighting, which means they can be used with normal room lighting. Although visual acuity does not change significantly with luminance above 120cdm-2, it is good practice to ensure that all screens in a practice/clinic are set to the same luminance. This can be achieved using a light meter which can be purchased for approximately £20.
Most computerised test charts can be calibrated to work on any screen size or resolution. In most consulting rooms, a 24’’ or 27’’ screen is adequate. Larger screens may be advantageous if the viewing distance is greater than 6m or if there is a requirement to assess patients with low vision.
While standard off-the-shelf display screens are adequate for most tests, passive 3D monitors do offer some advantages for binocular vision testing and binocular balancing.
A passive 3D display uses a ‘micropol’ filter placed in front of the screen which polarises alternate rows of pixels in opposite directions. The screen is viewed through cross-polarised filters so that the right eye sees the odd rows of pixels and the left eye sees the even rows (or vice versa). Thus, different stimuli can be presented to each eye by drawing on the odd and even rows of pixels (figure 7).
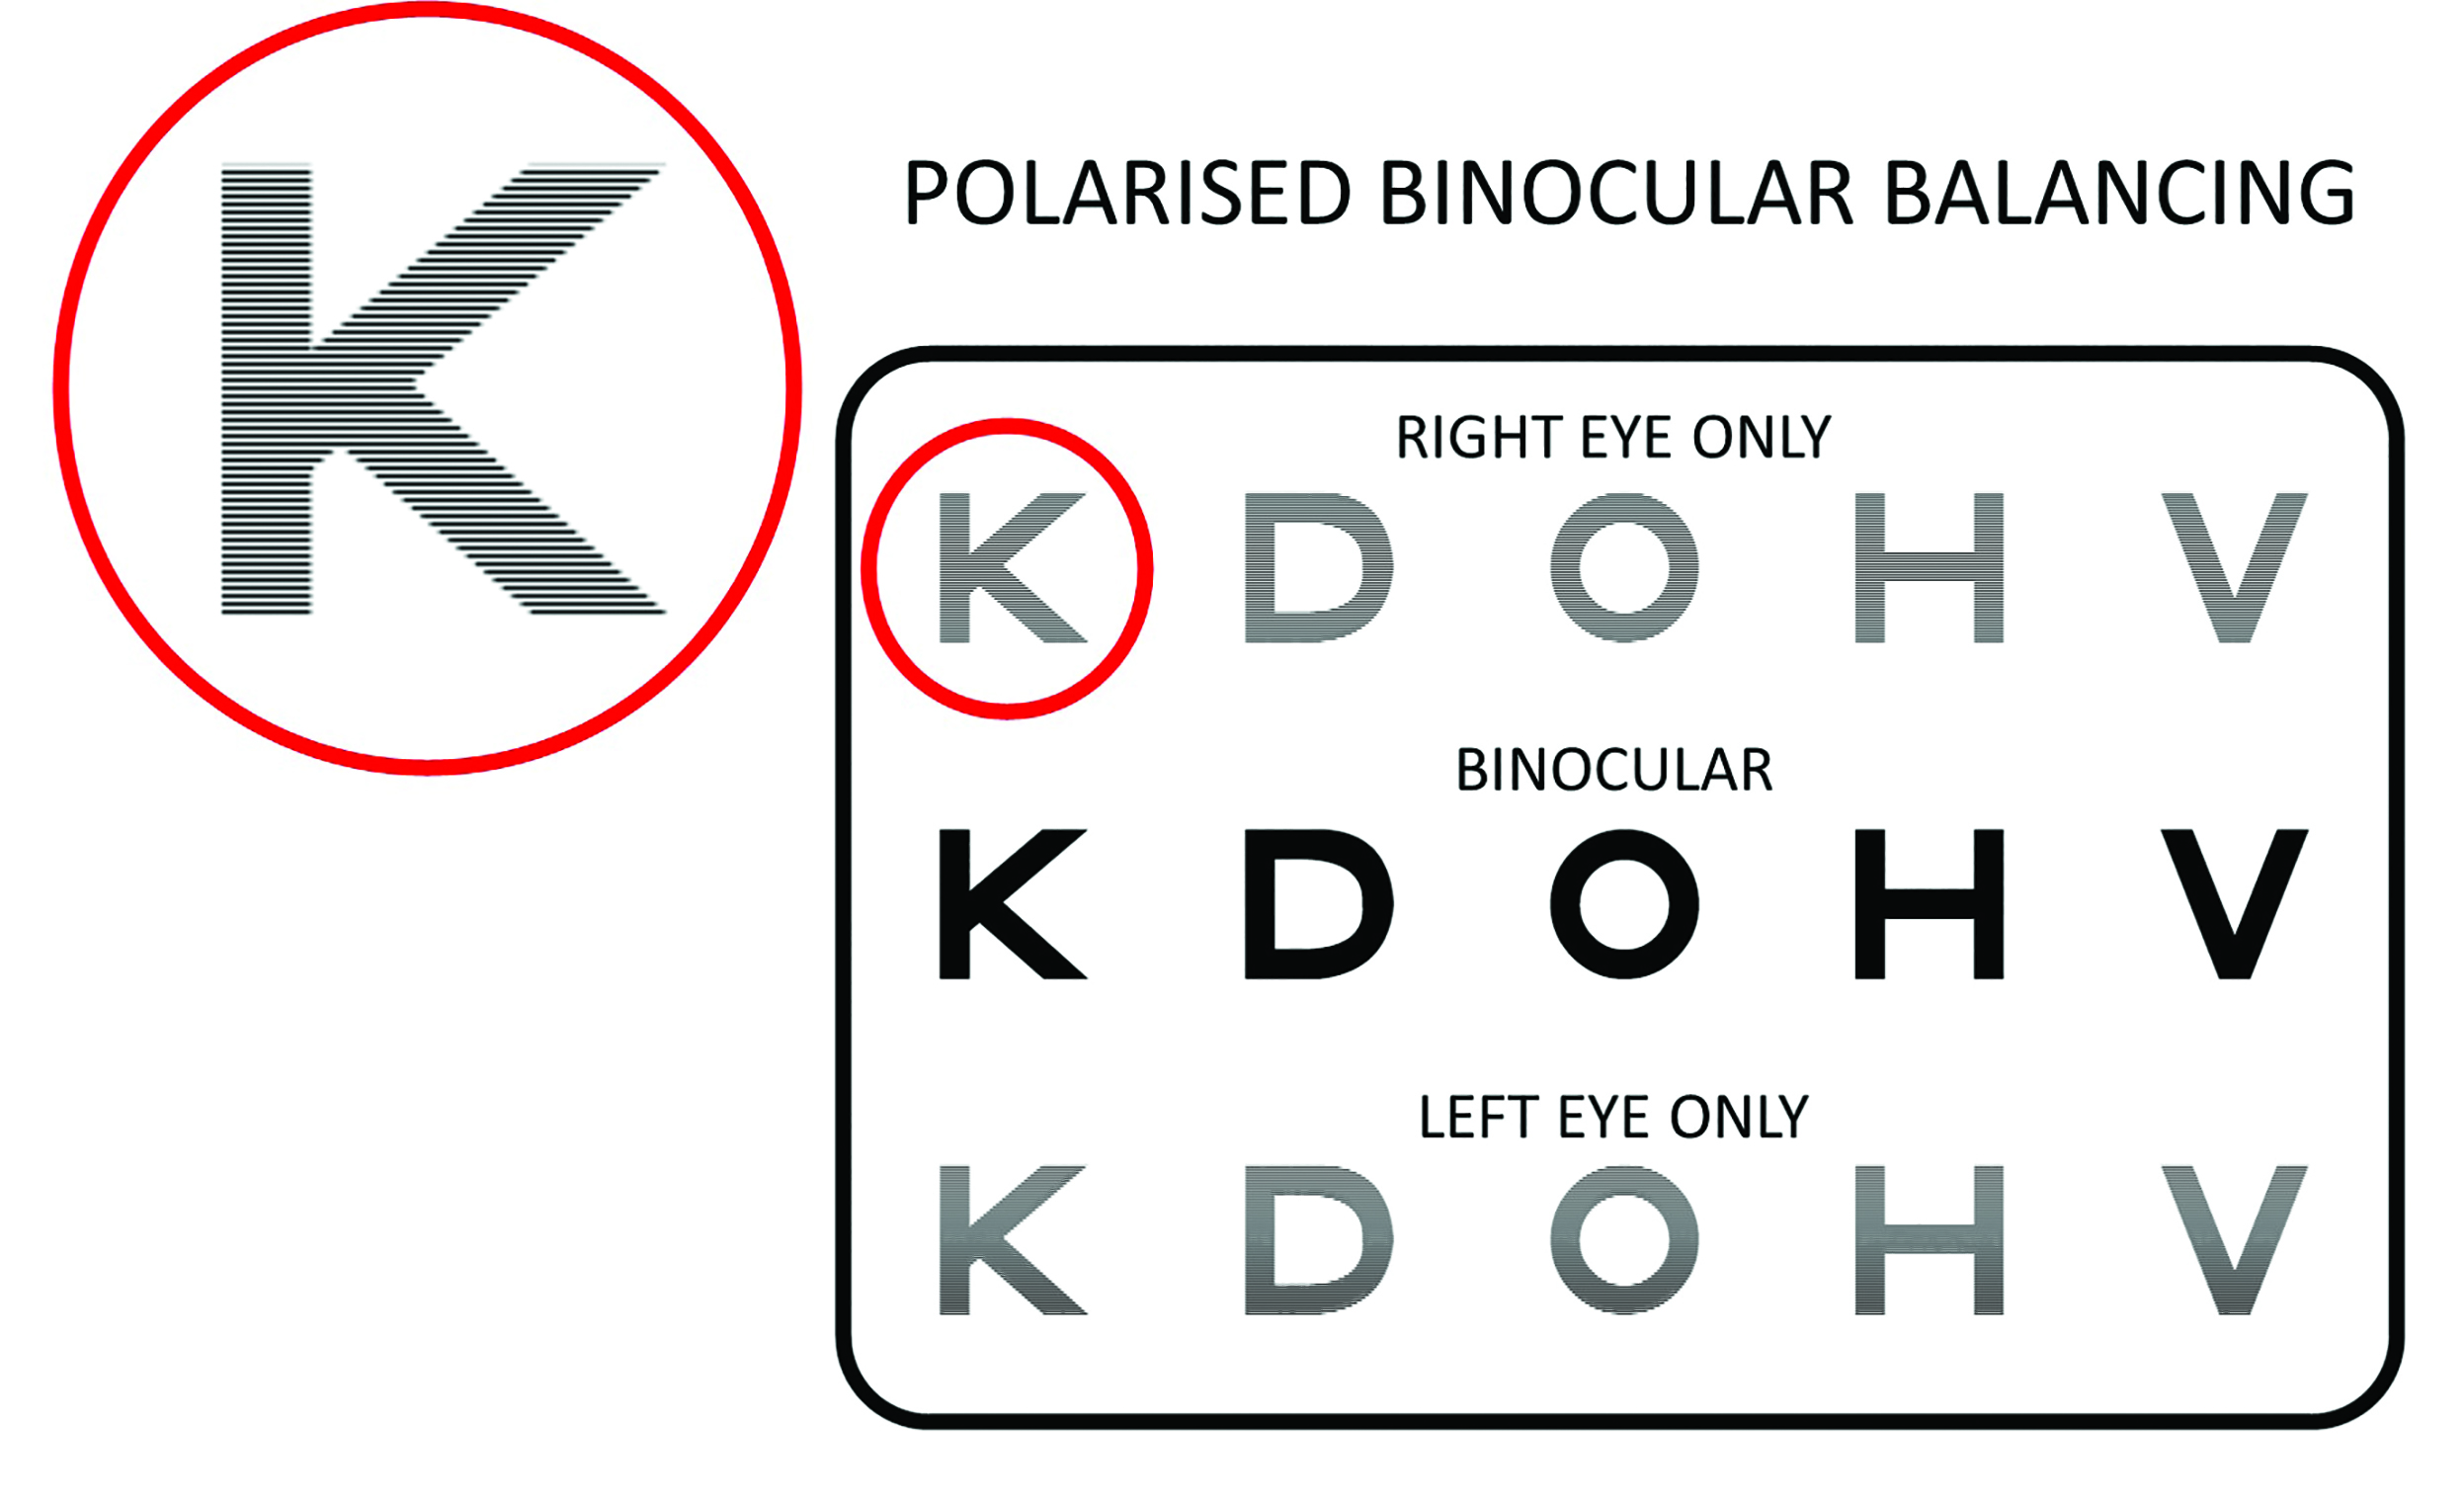 Figure 7: Polarised screens incorporate a filter which polarises alternate rows of pixels in opposite directions allowing stimuli to be presented to each eye individually or binocularly. (Thomson Test Chart image courtesy of Thomson Software Solutions)
This allows a wide range of binocular vision tests to be presented using cross polarisation rather than red/green dissociation. Cross polarisation is generally superior in this respect because it allows more natural viewing conditions.
Passive 3D screens are also valuable for binocular refraction as they allow stimuli to be presented to one eye only without occluding the other eye (see figure 7). They also allow stimuli to be presented simultaneously to each eye and binocularly, which is ideal for binocular balancing.
Unfortunately, passive 3D screens are no longer mass-produced so must be manufactured to order. However, many clinicians feel that the additional premium is worth paying for the benefits afforded by these screens.
Chart Viewing Distance
Conventional printed and back-illuminated charts are designed to be viewed at a specific distance and the consulting room must be designed to accommodate this distance.
The advent of computerised test charts that are capable of scaling charts for different viewing distances, raises the question, what is the optimum/minimum viewing distance for a chart?
As visual acuity is essentially a measurement of the minimum angle of resolution, provided that the stimuli are correctly scaled and the patient has an appropriate refractive correction for this distance, visual acuity is theoretically independent of viewing distance.
However, as visual acuity is frequently used to measure uncorrected vision, viewing distance becomes important; a chart placed at one metre will be seen clearly by a low myope even though their distance vision will be blurred. Viewing distance is also important if charts are to be used during a refraction. There is some anecdotal evidence to support the view that the endpoint of refraction is more stable for viewing distances of four metres or more. This is usually achievable using a mirror in all but the smallest consulting rooms and avoids the instability in accommodation that can occur with short-form charts.
If a chart is to be used solely for measuring visual acuity, a minimum viewing distance of three metres is generally recommended. Low vision clinics often use shorter viewing distances to extend the range of measurement. This is acceptable provided that the patient has the correct refractive correction for this distance and the chart is calibrated appropriately (if computerised) or an appropriate adjustment is made to the scoring (if printed or back-illuminated).
It is important to note that because of the non-linearities in the design of the Snellen chart, moving the patient closer to a printed/back-illuminated chart (which cannot be rescaled) will introduce some errors to the measurement, even if an appropriate compensation is made to the score. This is not the case for printed/back-illuminated LogMAR charts which can be viewed from any distance provided a suitable adjustment is made to the LogMAR score. A useful rule of thumb is that 0.3 should be added to the LogMAR score every time the viewing distance is halved.
Positioning a Test Chart
The primary consideration when positioning a test chart is the viewing distance. Computerised charts can normally be calibrated to the nearest centimetre and it is important that this distance is measured accurately. It is also good practice to place a marker at the calibrated viewing distance so that the patient’s eyes are at this distance whenever acuity is measured. Using a mirror to view the chart is often advantageous in terms of the practical layout of a consulting room and maximising the viewing distance.
Placing the chart at a height where the patient is required to look up slightly ensures that the eyelids are lifted outside the pupil area. This helps for retinoscopy/ophthalmoscopy and reduces a potential pinhole effect, which would tend to make the patient less sensitive to blur and therefore less able to provide a definitive endpoint to a refraction.
Automation and Termination Rules
All psychophysical measurements (including visual acuity) are a function of two factors:
- The underlying ‘physiological threshold’
- The criterion adopted by the observer6,22
If simply asked to read the smallest letters that they can see on a chart, two patients with the same underlying physiological visual acuity may record a different visual acuity. A cautious patient will stop at a row they can read confidently while another patient may be prepared to guess if not certain.
This difference can be minimised by ensuring that all patients are encouraged to read letters of decreasing size until they feel they are guessing.
The advent of computerised charts has introduced the possibility of automating the measurement process and employing more advanced psychometric methods to provide more reliable/
repeatable measurements (Acuity Master31 and Complog32). While these methods are undoubtedly capable of producing accurate results,19,33-36 the extra time required to complete measurements has limited their take up in clinical practice.
Does High Contrast Acuity Always Tell the Full Story?
High contrast visual acuity has proved to be the single most valuable test of visual function and remains the mainstay of clinical visual assessment. It is quick and easy to measure, and, in most cases, results correlate well with patients’ visual experience.
However, there are occasions when high contrast acuity appears to overestimate or occasionally underestimate the patient’s quality of vision. Given the complexity of the visual system, it is perhaps not surprising that a single test of visual function sometimes fails to provide a full description of the patient’s visual experience.
The research literature is laden with examples of ingenious tests and stimuli that have been designed to probe different aspects of visual performance. However, very few of these tests have enjoyed widespread adoption among clinicians.
One test which showed particular promise in this respect is contrast sensitivity (CS).37,38 The measurement of CS is based on techniques that have been applied for many years to assess the characteristics of electronic and optical systems. The technique involves investigating the response of the system to sine waves of various frequencies and gives rise to what is known as a modulation transfer function (MTF). The MTF provides a powerful description of the characteristics of a system and can be used to predict the response of the system to more complex inputs.
Applied to the visual system, the technique involves measuring the minimum contrast required to detect sine wave gratings of various spatial frequencies. The resulting contrast sensitivity function, or CSF, provides information about how well a patient sees over a range of spatial frequencies and therefore provides a more comprehensive assessment of visual function than VA (figure 8). Visual acuity can be thought of as a measure of the highest spatial frequency that can be detected at a high contrast and therefore relates (approximately) to the intersection of the CSF with the x axis (figure 8).39,40
 Figure 8: Contrast sensitivity function showing the approximate relationship between high and low contrast visual acuity and letter contrast sensitivity (image courtesy of Thomson Software Solutions)
As such, VA is sensitive to conditions that produce a loss of contrast sensitivity (CS) at high spatial frequencies, such as refractive error, macular disease. However, it is less good at predicting the quality of vision for conditions that also produce a loss of sensitivity at lower spatial frequencies such as some neurological conditions and conditions that result in increased light scatter in the eye, such as cataracts.40,41
The measurement of a full CSF is time-consuming and requires specialist equipment and therefore, its use has been mainly limited to research laboratories and specialist clinics.
The Pelli-Robson chart42 provided a relatively inexpensive and quick way of obtaining a measurement of CS at low spatial frequencies. The chart consists of rows of letters of the same size but decreasing contrast (figure 9). The chart is usually viewed from one metre, from where the letters equate to 6/275 giving an indication of CS just below the peak of the curve at 0.5 – 2 cycles per degree (figure 8).
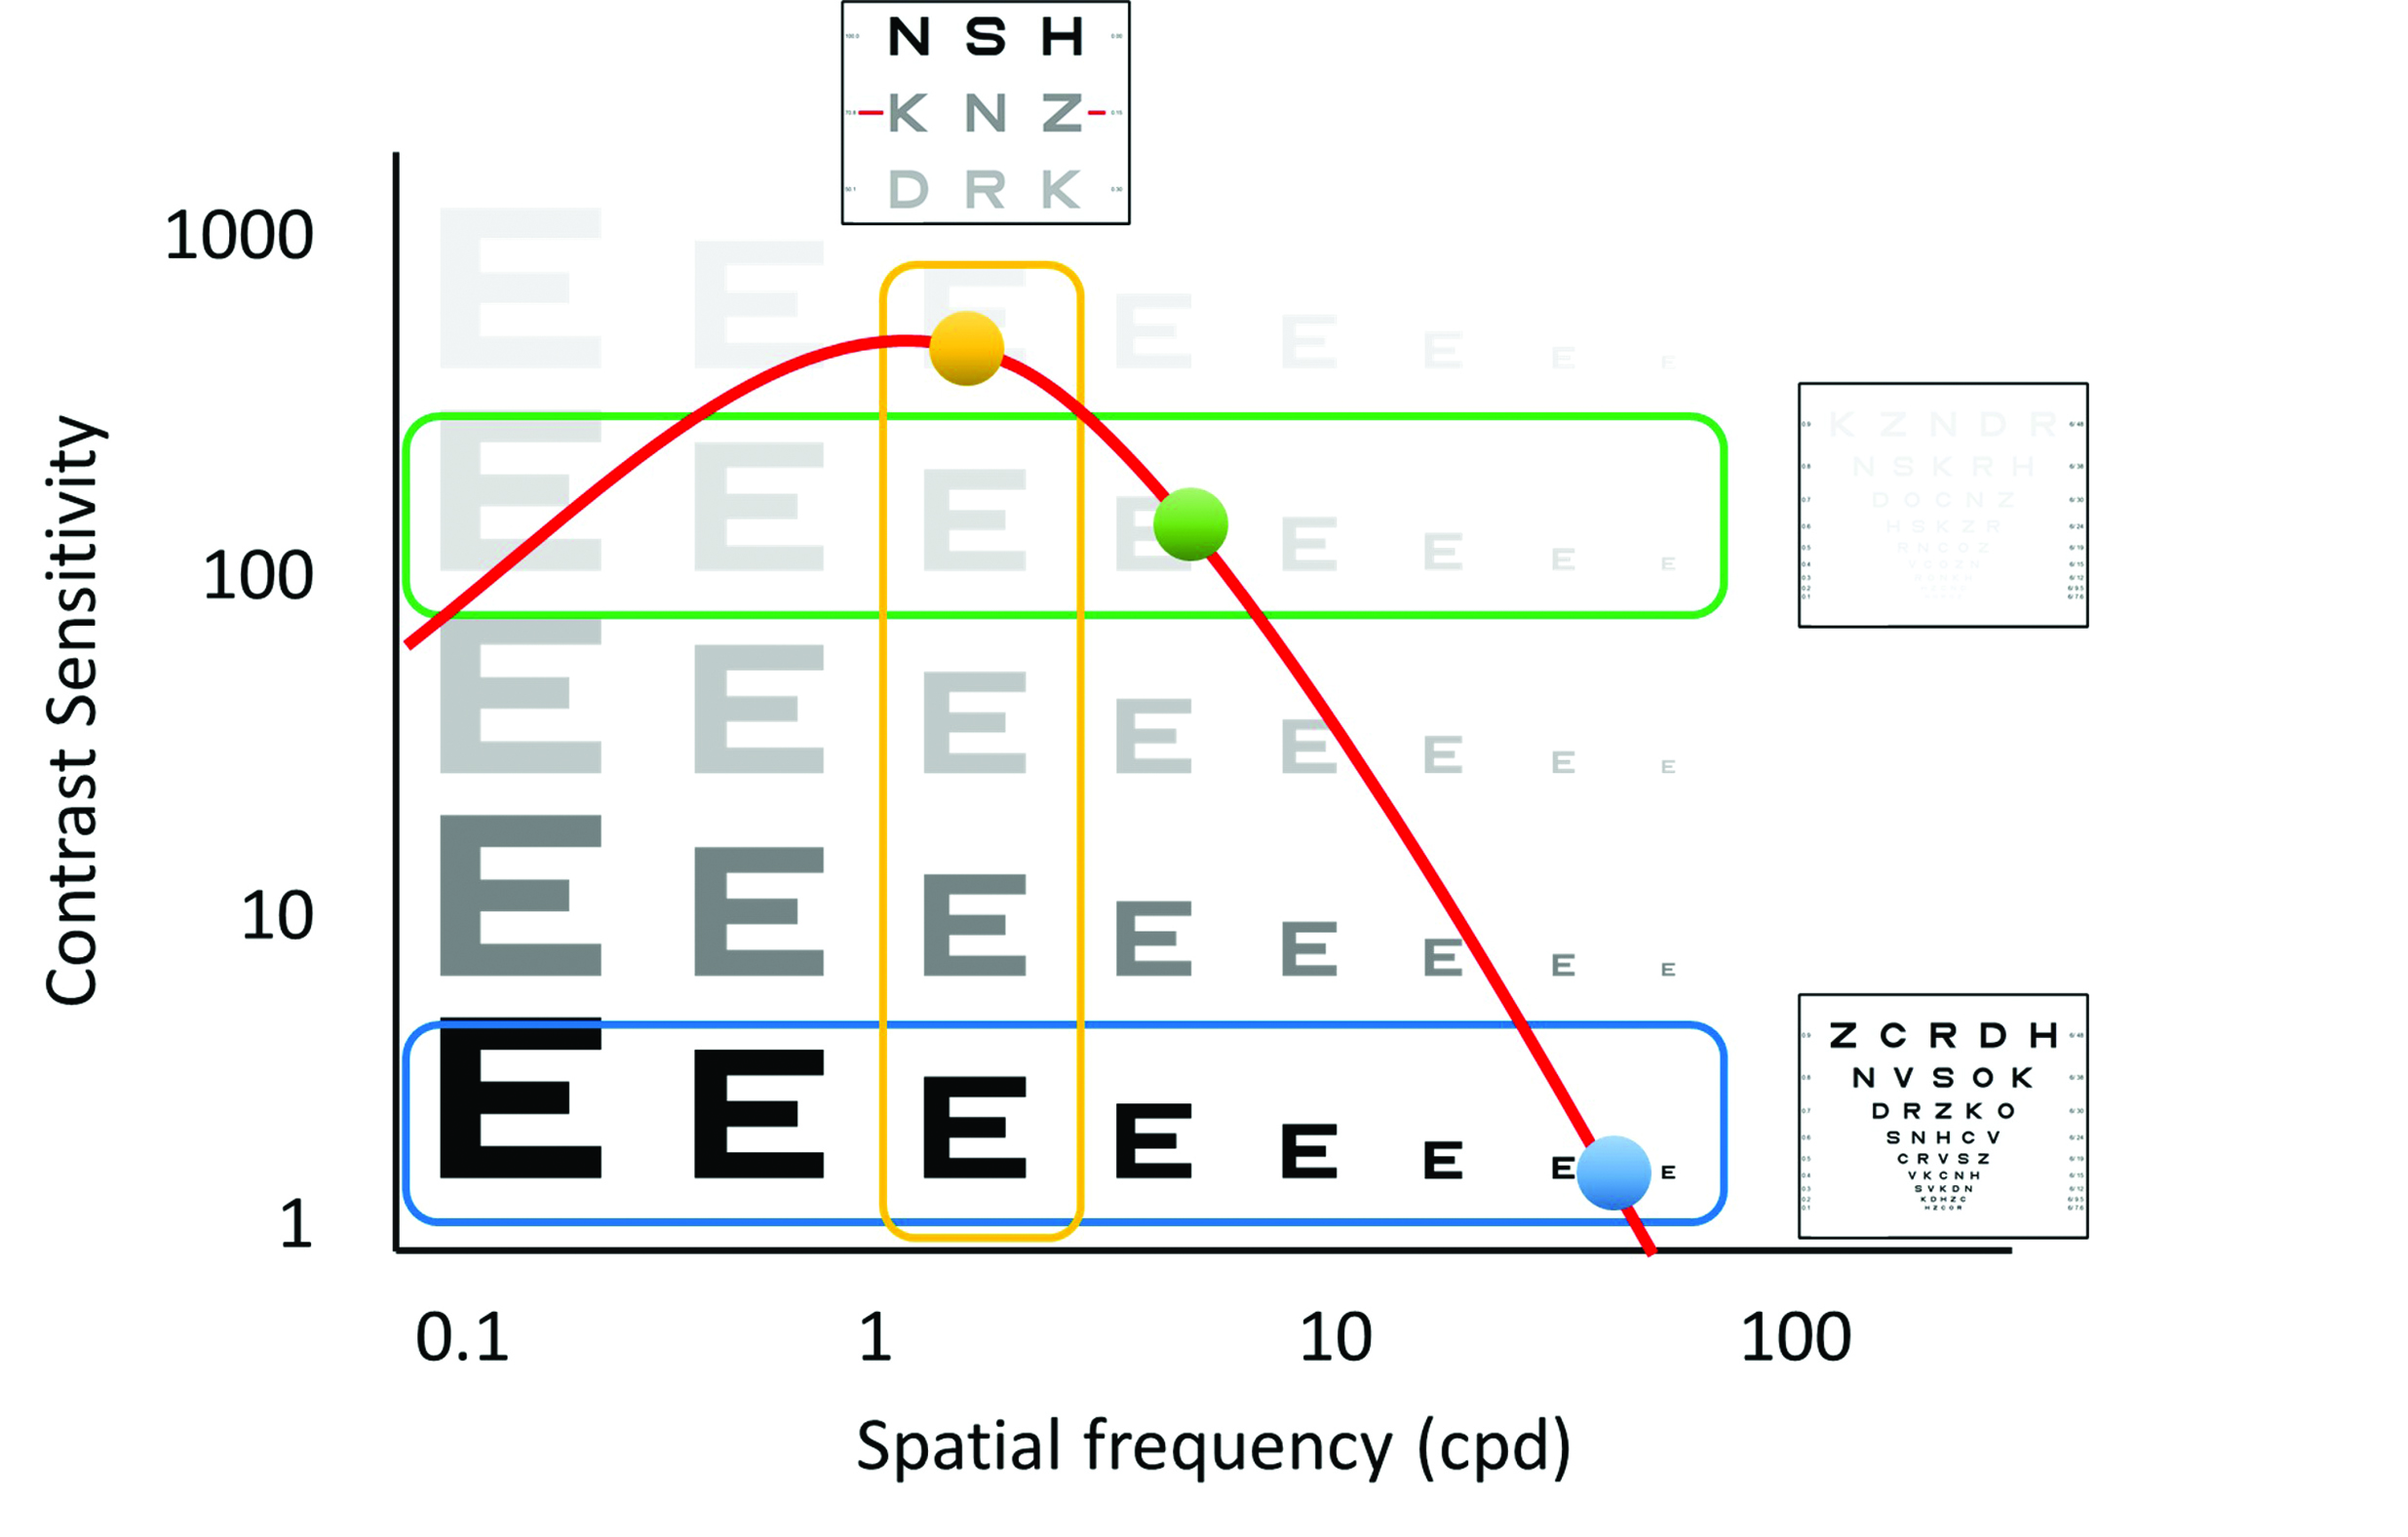 Figure 9: Pelli-Robson chart (taken from www.precision-vision.com/products/contrast-sensitivity-tests/peak-contrast-sensitivity/pelli-robson/pelli-robson-contrast-sensitivity-chart)
Another approach is to measure VA at a low contrast, such as 10% (figure 10). This method provides a second point on the CSF (figure 8). This test is quick, easy to perform and results are easy to interpret.39,40 A patient with normal contrast sensitivity will generally show a two-line (0.2) difference in LogMAR acuity between 100% and 10% contrast charts. This difference will be greater for patients with a loss of sensitivity at lower spatial frequencies.
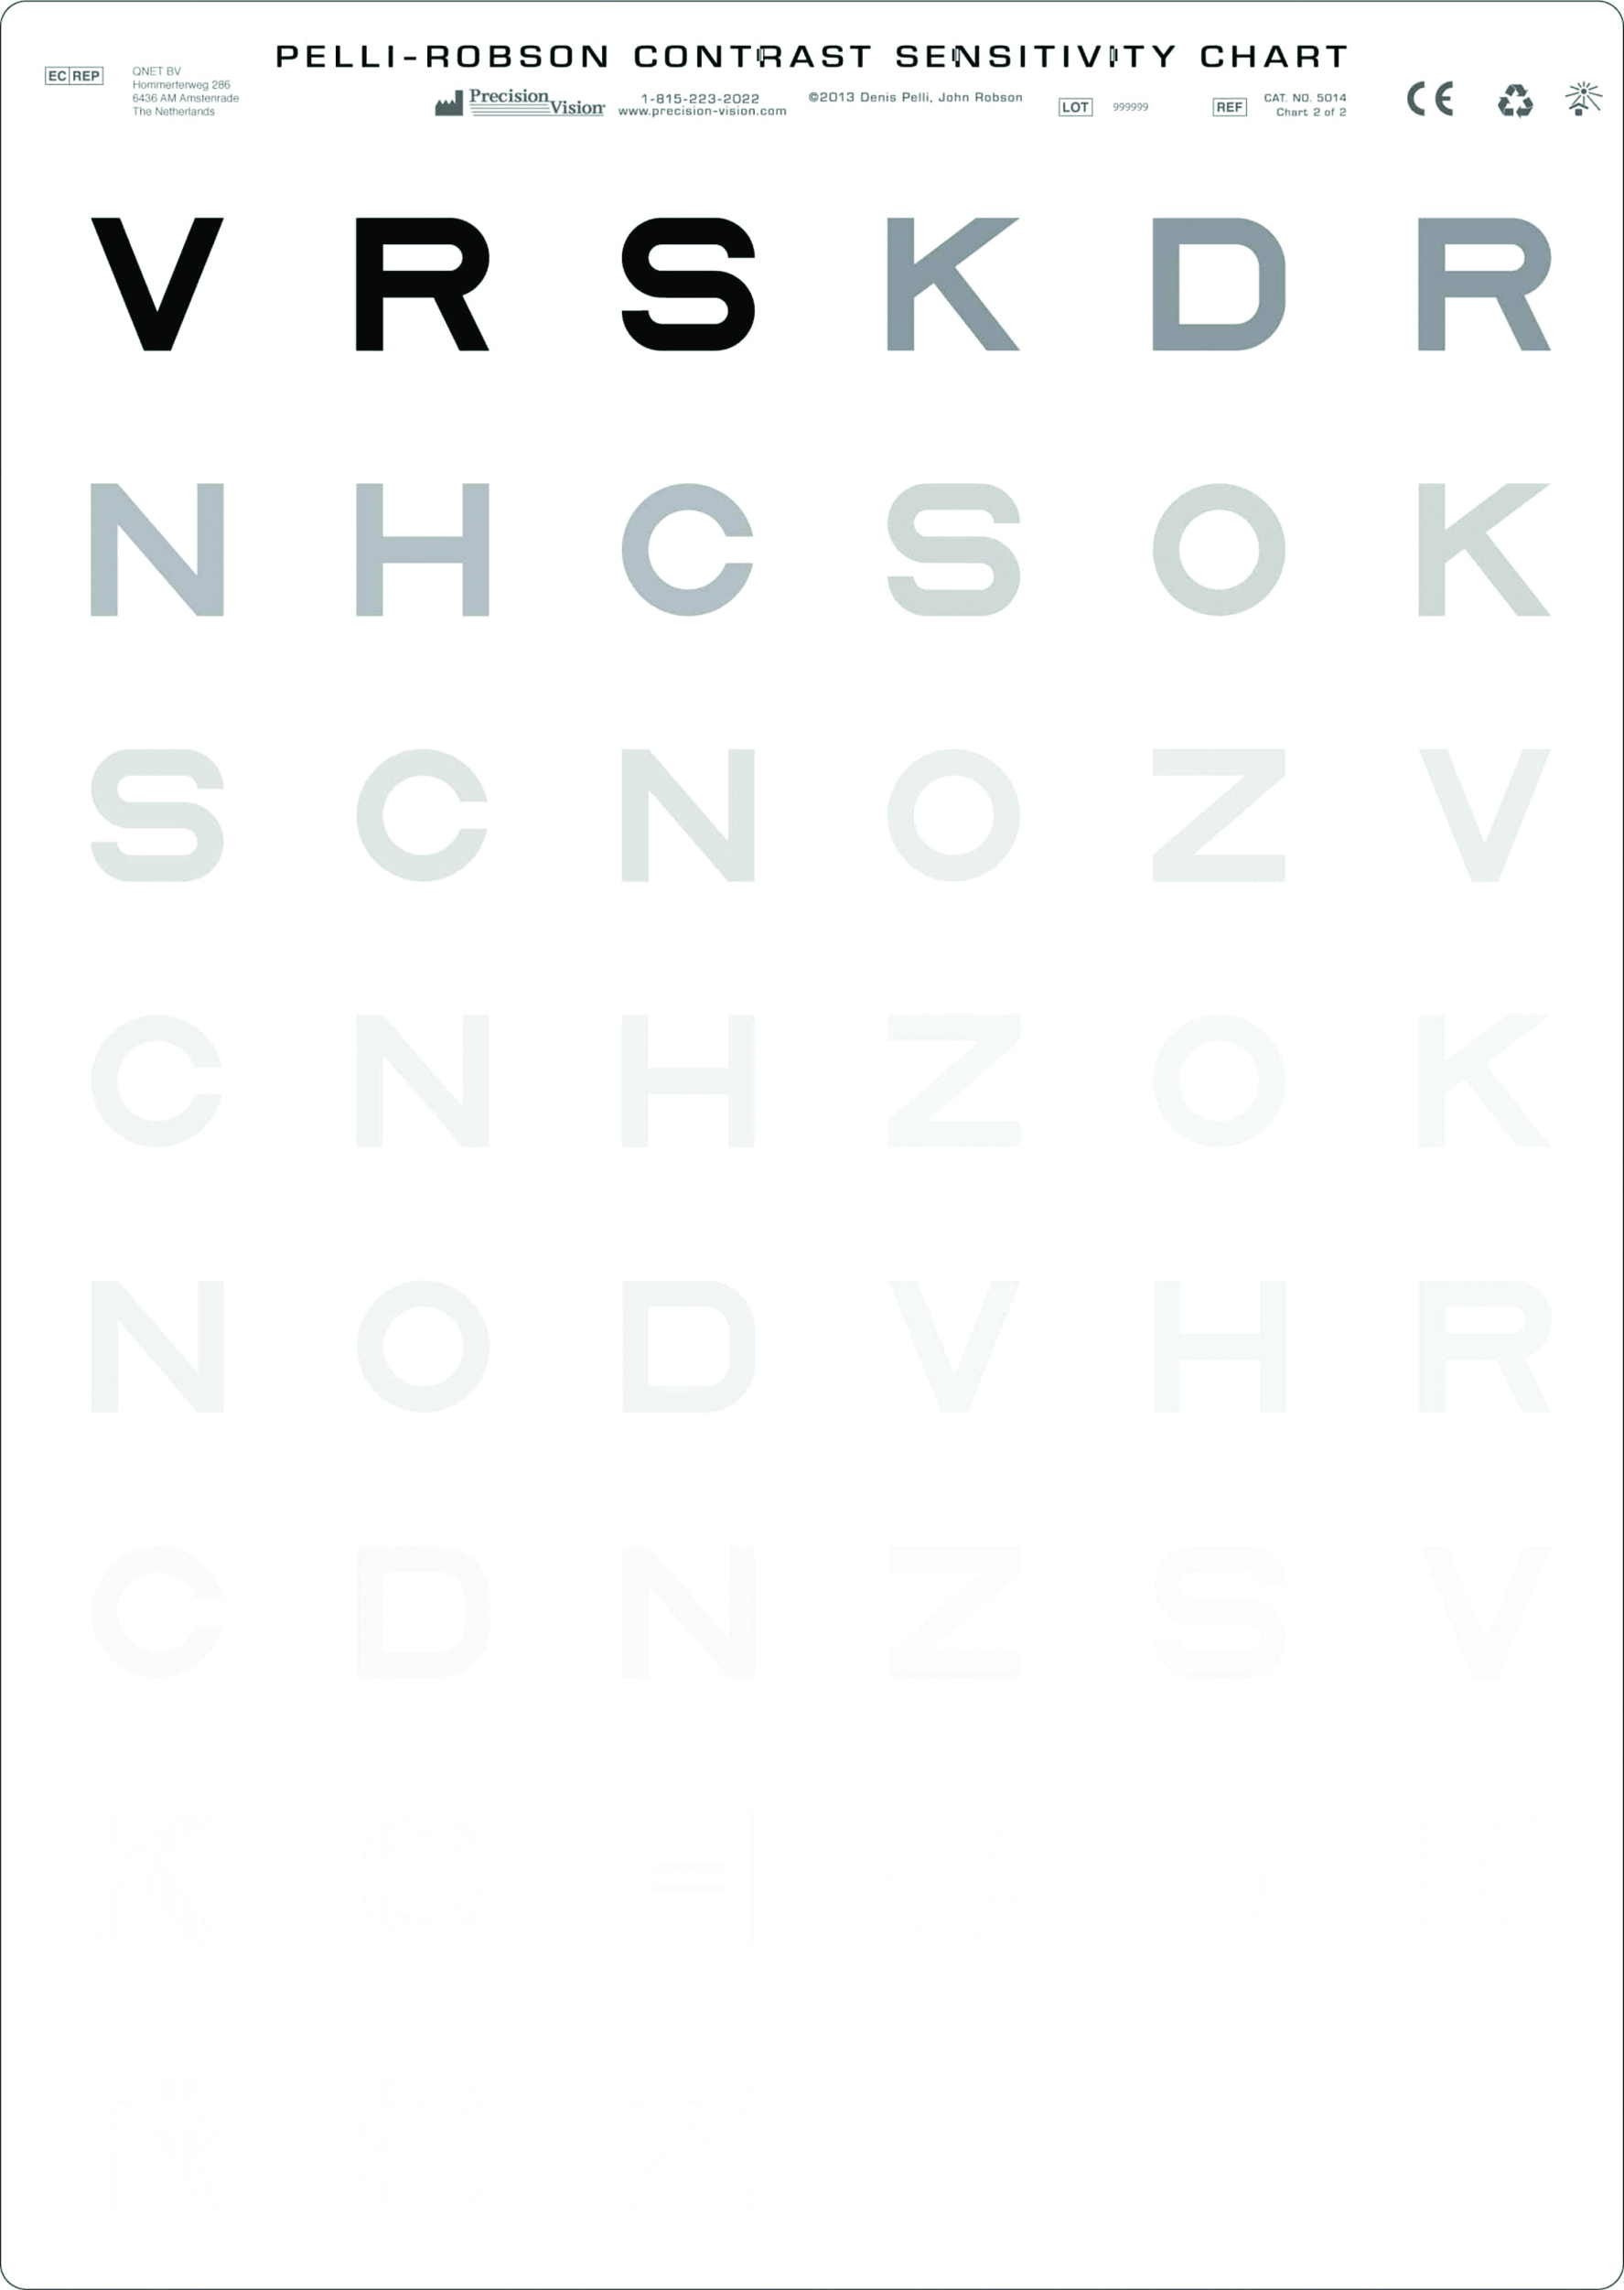 Figure 10: Low contrast LogMAR chart (image courtesy of Thomson Software Solutions)
Combining a Pelli-Robson or low contrast acuity test with a measure of high contrast acuity thus provides an estimate of two points on the CSF. This is usually adequate to predict the general shape of the CSF and, therefore, provides a powerful description of a patient’s visual capability (figure 8).39
While ‘paper-based’ tests provide clinicians with a tool for sampling CS, the charts require careful illumination and plenty of space within the consulting room. However, these tests are now available within most computerised test charts and provide valuable supplementary information when a patient’s perception of their vision does not appear to tally with their high contrast visual acuity.
Professor David Thomson was Professor of Optometry and Visual Science at City University and is MD of Thomson Software Solutions.
- Part 2 will take a look at near acuity charts and the latest developments in vision testing software and remote testing systems
References
- Aliev A-G, Nurudinov M, Alieva M. The evolution of visual acuity test methods. The Eye. 2019;21(128). doi:10.33791/2222-4408-2019-4-7-14
- Colenbrander A. The historical evolution of visual acuity measurement. Visual Impairment Research. 2008;10(2-3). doi:10.1080/13882350802632401
- Ricci F, Cedrone C, Cerulli L. Standardized measurement of visual acuity. Ophthalmic Epidemiology. 1998;5(1). doi:10.1076/opep.5.1.41.1499
- Rabbetts RB. Bennett and Rabbetts’ Clinical Visual Optics. Bennett and Rabbetts’ Clinical Visual Optics. Published online 2007.
- Lovie-Kitchin JE. Is it time to confine Snellen charts to the annals of history? Ophthalmic and Physiological Optics. 2015;35(6). doi:10.1111/opo.12252
- Elliott DB. The good (logMAR), the bad (Snellen) and the ugly (BCVA, number of letters read) of visual acuity measurement. Ophthalmic and Physiological Optics. 2016;36(4). doi:10.1111/opo.12310
- McGraw P, Winn B, Whitaker D. Reliability of the Snellen chart. BMJ. 1995;310(6993). doi:10.1136/bmj.310.6993.1481
- Bailey IL, Lovie JE. New design principles for visual acuity letter charts. Optometry and Vision Science. 1976;53(11). doi:10.1097/00006324-197611000-00006
- Bailey IL, Lovie-Kitchin JE. Visual acuity testing. From the laboratory to the clinic. Vision Research. 2013;90. doi:10.1016/j.visres.2013.05.004
- Hazel C a, Elliott DB. The Dependency of LogMAR Visual Acuity. Optometry & Vision Science. 2002;79(12).
- Hazel CA, Elliott DB. The dependency of logMAR visual acuity measurements on chart design and scoring rule. Optometry and Vision Science. 2002;79(12). doi:10.1097/00006324-200212000-00011
- Lovie-Kitchin JE. Validity and reliability of viscual acuity measurements. Ophthalmic and Physiological Optics. 1988;8(4). doi:10.1111/j.1475-1313.1988.tb01170.x
- Bailey IL, Gee C, Toy A, Tran T. Visual Acuity: Variations With Optotypes. Investigative Ophthalmology & Visual Science. 2007;48(13).
- Hamm LM, Yeoman JP, Anstice N, Dakin SC. The Auckland Optotypes: An open-access pictogram set for measuring recognition acuity. Journal of Vision. 2018;18(3). doi:10.1167/18.3.13
- Campo Dall’Orto G, Facchin A, Bellatorre A, Maffioletti S, Serio M. Measurement of visual acuity with a digital eye chart: optotypes, presentation modalities and repeatability. Journal of Optometry. 2021;14(2). doi:10.1016/j.optom.2020.08.007
- Ferris FL, Kassoff A, Bresnick GH, Bailey I. New visual acuity charts for clinical research. American Journal of Ophthalmology. 1982;94(1). doi:10.1016/0002-9394(82)90197-0
- Richardson GA, Davis H. A method comparison of Kay Pictures, LEA Symbols and Patti Pics in the measurement of visual acuity when compared with ETDRS. Journal of American Association for Pediatric Ophthalmology and Strabismus. 2014;18(4). doi:10.1016/j.jaapos.2014.07.116
- Singman EL, Matta NS, Tian J, Silbert DI. Comparing visual acuity measured by lea symbols and patti pics. American Orthoptic Journal. 2015;65(1). doi:10.3368/aoj.65.1.94
- Shah N, Laidlaw DAH, Rashid S, Hysi P. Validation of printed and computerised crowded Kay picture logMAR tests against gold standard ETDRS acuity test chart measurements in adult and amblyopic paediatric subjects. Eye. 2012;26(4). doi:10.1038/eye.2011.333
- Frisén L. Vanishing Optotypes: New Type of Acuity Test Letters. Archives of Ophthalmology. 1986;104(8). doi:10.1001/archopht.1986.01050200100060
- Howland B, Ginsburg A, Campbell F. High-pass spatial frequency letters as clinical optotypes. Vision Research. 1978;18(8). doi:10.1016/0042-6989(78)90036-6
- Shah N, Dakin S, Anderson R. Visual acuity - more than meets the eye? Optometry Today. 2016;56(5).
- Adoh TO, Woodhouse JM, Oduwaiye KA. The cardiff test: A new visual acuity test for toddlers and children with intellectual impairment. A preliminary report. Optometry and Vision Science. 1992;69(6). doi:10.1097/00006324-199206000-00003
- Woodhouse JM, Adoh TO, Oduwaiye KA, et al. New acuity test for toddlers. Ophthalmic and Physiological Optics. 1992;12(2). doi:10.1111/j.1475-1313.1992.tb00300.x
- Shah N, Dakin SC, Redmond T, Anderson RS. Vanishing Optotype acuity: Repeatability and effect of the number of alternatives. Ophthalmic and Physiological Optics. 2011;31(1). doi:10.1111/j.1475-1313.2010.00806.x
- Shah N, Dakin SC, Anderson RS. Effect of optical defocus on detection and recognition of vanishing optotype letters in the fovea and periphery. Investigative Ophthalmology and Visual Science. 2012;53(11). doi:10.1167/iovs.12-9864
- Shah N, Dakin SC, Dobinson S, Tufail A, Egan CA, Anderson RS. Visual acuity loss in patients with age-related macular degeneration measured using a novel high-pass letter chart. British Journal of Ophthalmology. 2016;100(10). doi:10.1136/bjophthalmol-2015-307375
- Goss DA. Historical note on distance test charts and projectors. Hindsight (Saint Louis, Mo). 2014;45(2).
- Cox MJ, Wood ICJ. Computerized arden grating technique for the measurement of the contrast sensitivity function. Optometry and Vision Science. 1992;69(2). doi:10.1097/00006324-199202000-00007
- Thomson D. Use and development of computer-based test charts in the assessment of vision. In: Investigative Techniques and Ocular Examination. ; 2003. doi:10.1016/B978-0-7506-5404-3.50007-6
- Thomson David. Acuity Master. https://www.thomson-software-solutions.com/acuity-master/.
- Kan MW, Bjerre A. The Test-Retest Variability of the COMPlog System in Participants with Induced Non-Normal Visual Acuity. British and Irish Orthoptic Journal. 2019;15(1). doi:10.22599/bioj.127
- Rosser DA, Murdoch IE, Fitzke FW, Laidlaw DAH. Improving on ETDRS acuities: Design and results for a computerised thresholding device. Eye. 2003;17(6). doi:10.1038/sj.eye.6700496
- Bokinni Y, Shah N, Maguire O, Laidlaw DAH. Performance of a computerised visual acuity measurement device in subjects with age-related macular degeneration: Comparison with gold standard ETDRS chart measurements. Eye (Basingstoke). 2015;29(8). doi:10.1038/eye.2015.94
- Laidlaw DAH, Tailor V, Shah N, Atamian S, Harcourt C. Validation of a computerised logMAR visual acuity measurement system (COMPlog): Comparison with ETDRS and the electronic ETDRS testing algorithm in adults and amblyopic children. British Journal of Ophthalmology. 2008;92(2). doi:10.1136/bjo.2007.121715
- Rosser DA, Cousens SN, Murdoch IE, Fitzke FW, Laidlaw DAH. How sensitive to clinical change are ETDRS logMAR visual acuity measurements? Investigative Ophthalmology and Visual Science. 2003;44(8). doi:10.1167/iovs.02-1100
- Pateras E, Karioti M. Contrast Sensitivity Studies and Test- A Review. International Journal of Ophthalmology and Clinical Research. 2020;7(2). doi:10.23937/2378-346x/1410116
- Richman J, Spaeth GL, Wirostko B. Contrast sensitivity basics and a critique of currently available tests. Journal of Cataract and Refractive Surgery. 2013;39(7). doi:10.1016/j.jcrs.2013.05.001
- Thurman SM, Davey PG, McCray KL, Paronian V, Seitz AR. Predicting individual contrast sensitivity functions from acuity and letter contrast sensitivity measurements. Journal of Vision. 2016;16(15). doi:10.1167/16.15.15
- Elliott DB, Situ P. Visual acuity versus letter contrast sensitivity in early cataract. Vision Research. 1998;38(13). doi:10.1016/S0042-6989(97)00382-9
- Elliott DB, Gilchrist J, Whitaker D. Contrast sensitivity and glare sensitivity changes with three types of cataract morphology: are these techniques necessary in a clinical evaluation of cataract? Ophthalmic and Physiological Optics. 1989;9(1). doi:10.1111/j.1475-1313.1989.tb00800.x
- Pelli DG, Robson JG, Wilkins AJ. The design of a new letter chart for measuring contrast sensitivity. Clinical Vision Sciences. 1988;2(3).