In part one of this series (Optician 27.08.21), I focused on the design and use of a range of high contrast distance acuity charts and charts that assess visual performance at different levels of contrast. In this article, I will initially discuss the assessment of vision at closer working distances and then take a look at some of the latest hardware and software for vision screening both in the clinical setting and, of increasing importance in the post-pandemic world, from a remote location.
Near vision or 'acuity'
As visual acuity is a measurement of the minimum angle of resolution, provided that a patient has no refractive error at the test distance, the VA measured at 40cm should be the same as the VA measured at 6m (give or take a few differences introduced by pupil size and accommodation). For this reason, near acuity is seldom measured. Instead, what is often referred to as ‘near acuity’ is in fact the smallest font size that can be comfortably read at the patient’s preferred reading distance.
This is assessed by asking the patient to read short passages of text printed in decreasing font sizes.1 The earliest reading types were introduced by Jaeger in 1854 and a variant of the original chart is still available.
However, in the UK the test types in general use tend to conform with the recommendations of the Faculty of Ophthalmologists and show a series of paragraphs of text of decreasing size printed in the Times New Roman font.1 Each paragraph is labelled with the font size prefixed with the letter N. Font size is measured in units called ‘points’ where one point is equal to 1/72 of an inch (0.35mm). The font size refers to the height of the body of the letter (not including ascenders and descenders). Thus, the body of an N8 letter measures 8/72 of an inch.2
It is important to note that the point size refers to the physical size of the character rather than the angle that it subtends (unlike LogMAR and Snellen). Therefore, a measurement using a near test type should always be accompanied by a note of the chart viewing distance. This information can be used to calculate an approximate Snellen or LogMAR equivalent for a paragraph of text. However, reading a paragraph of text cannot be compared to recognising regularly spaced optotypes and the correlation is poor.
Various attempts have been made to apply some of the rigour of the LogMAR chart design to near vision testing.3-5 However, given that the primary purpose of near vision testing is to ensure that the patient can read text of a given size at a certain viewing distance, the conventional test type format is usually adequate.
The advent of smartphones and tablets has led to the proliferation of apps for near vision testing. The high-resolution displays available on modern devices provide an ideal medium for displaying near test types and other vision tests. This is fully exploited by apps such as the Vision Toolbox for iPads (figure 1).6
 Figure 1: The Vision Toolbox App exploits the graphics capability of the
iPad to provide a huge range of near vision test and charts
(image courtesy of Thomson Software Solutions)
Remote vision assessment
In recent years, there has been a rapid increase in the personal use of computers, tablets and smartphones and this has led to increasing interest in the possibility of using these devices for remote vision assessment.1,5,7-9
With many hospital eye departments struggling to keep up with demand, the possibility of reducing the number of patients required to physically attend is attractive for both hospitals and patients. While the problem is less acute in community eye care practice, the ability to provide a remote assessment in acute cases or for patients who find it difficult to attend a practice is appealing.
As we have seen, modern display screens are ideal for the presentation of test stimuli and, with most devices now connected to the internet, the remaining challenge is to develop and test the technology.
Three approaches seem to have emerged, namely:
- Apps
- Zoom and Teams testing
- Web-based software
Apps
A wide range of apps for vision assessment are now available, both for smartphones and tablets. Examples include Peekaboo (figure 2), Peek Acuity (figure 3), DigiVis (figure 4) and the Kay Amblyopia Tracker.10-12
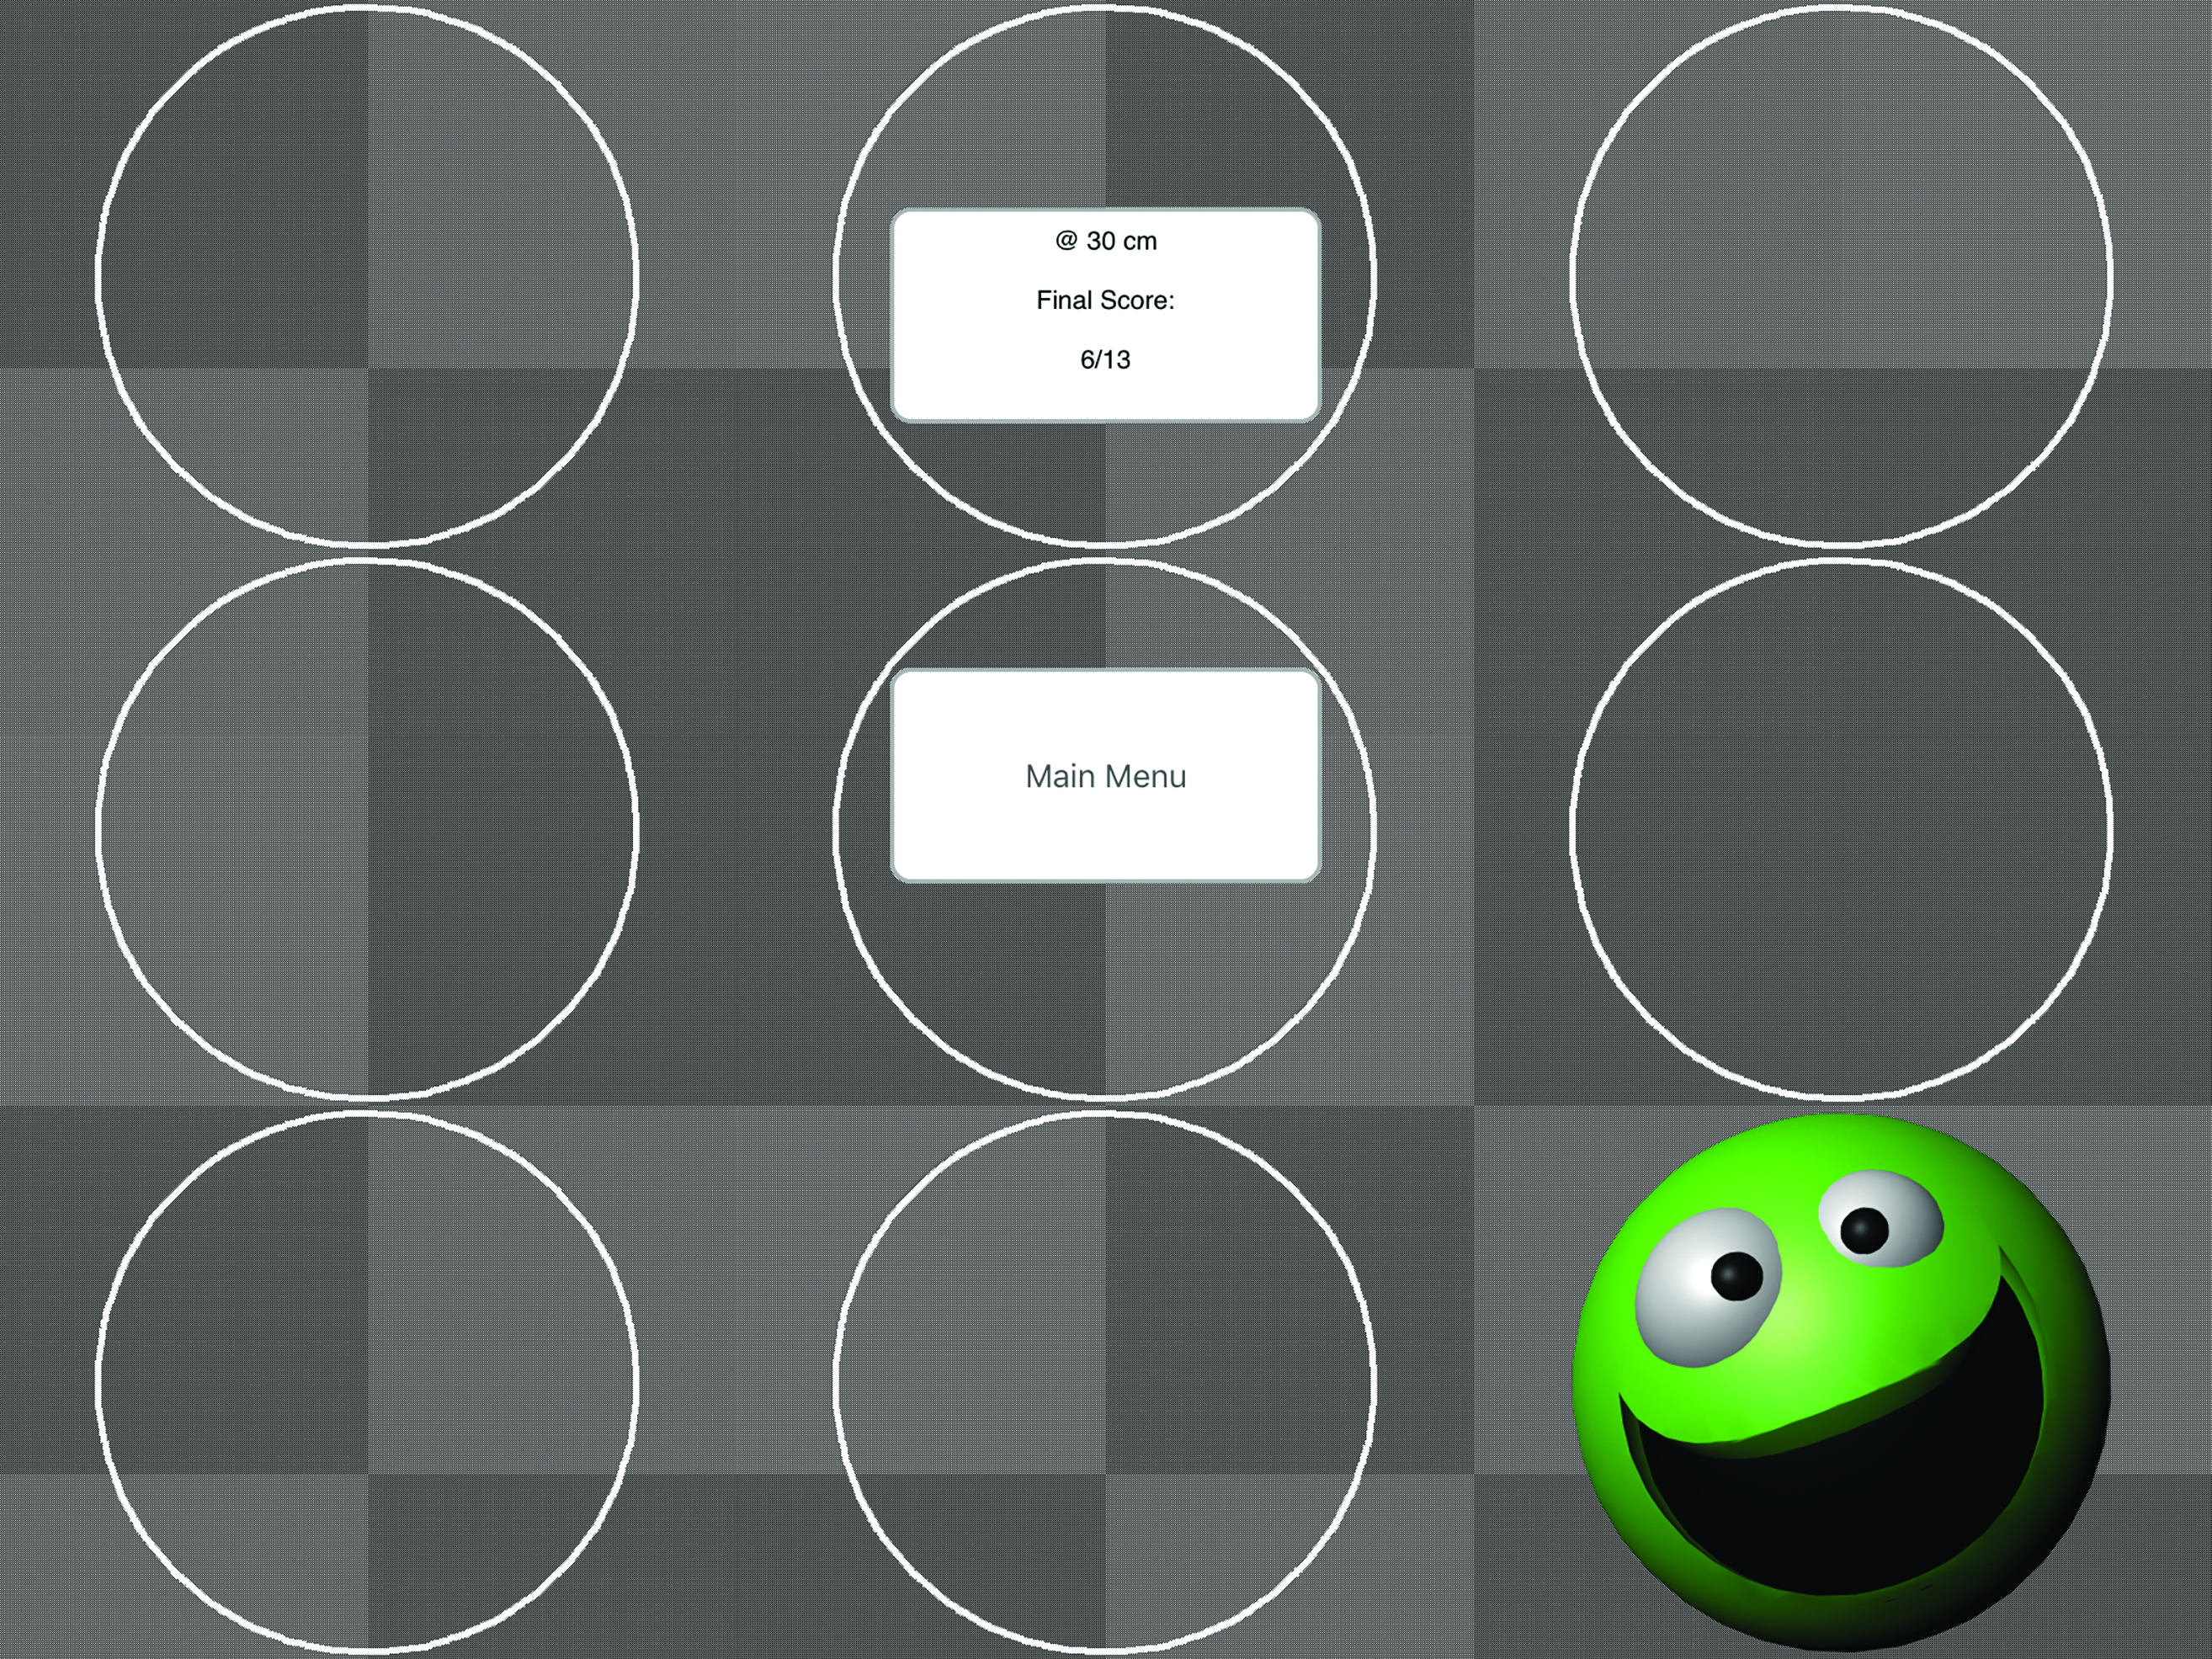 Figure 2: The Peekaboo app, useful for assessing vision in the very young or those with learning disability
These require an app to be downloaded and installed and a simple calibration to be performed. A variety of optotypes or pictograms are then used to measure visual acuity. Some of these apps are standalone, while others are capable of uploading results to a server to allow VA to be monitored by a clinician.
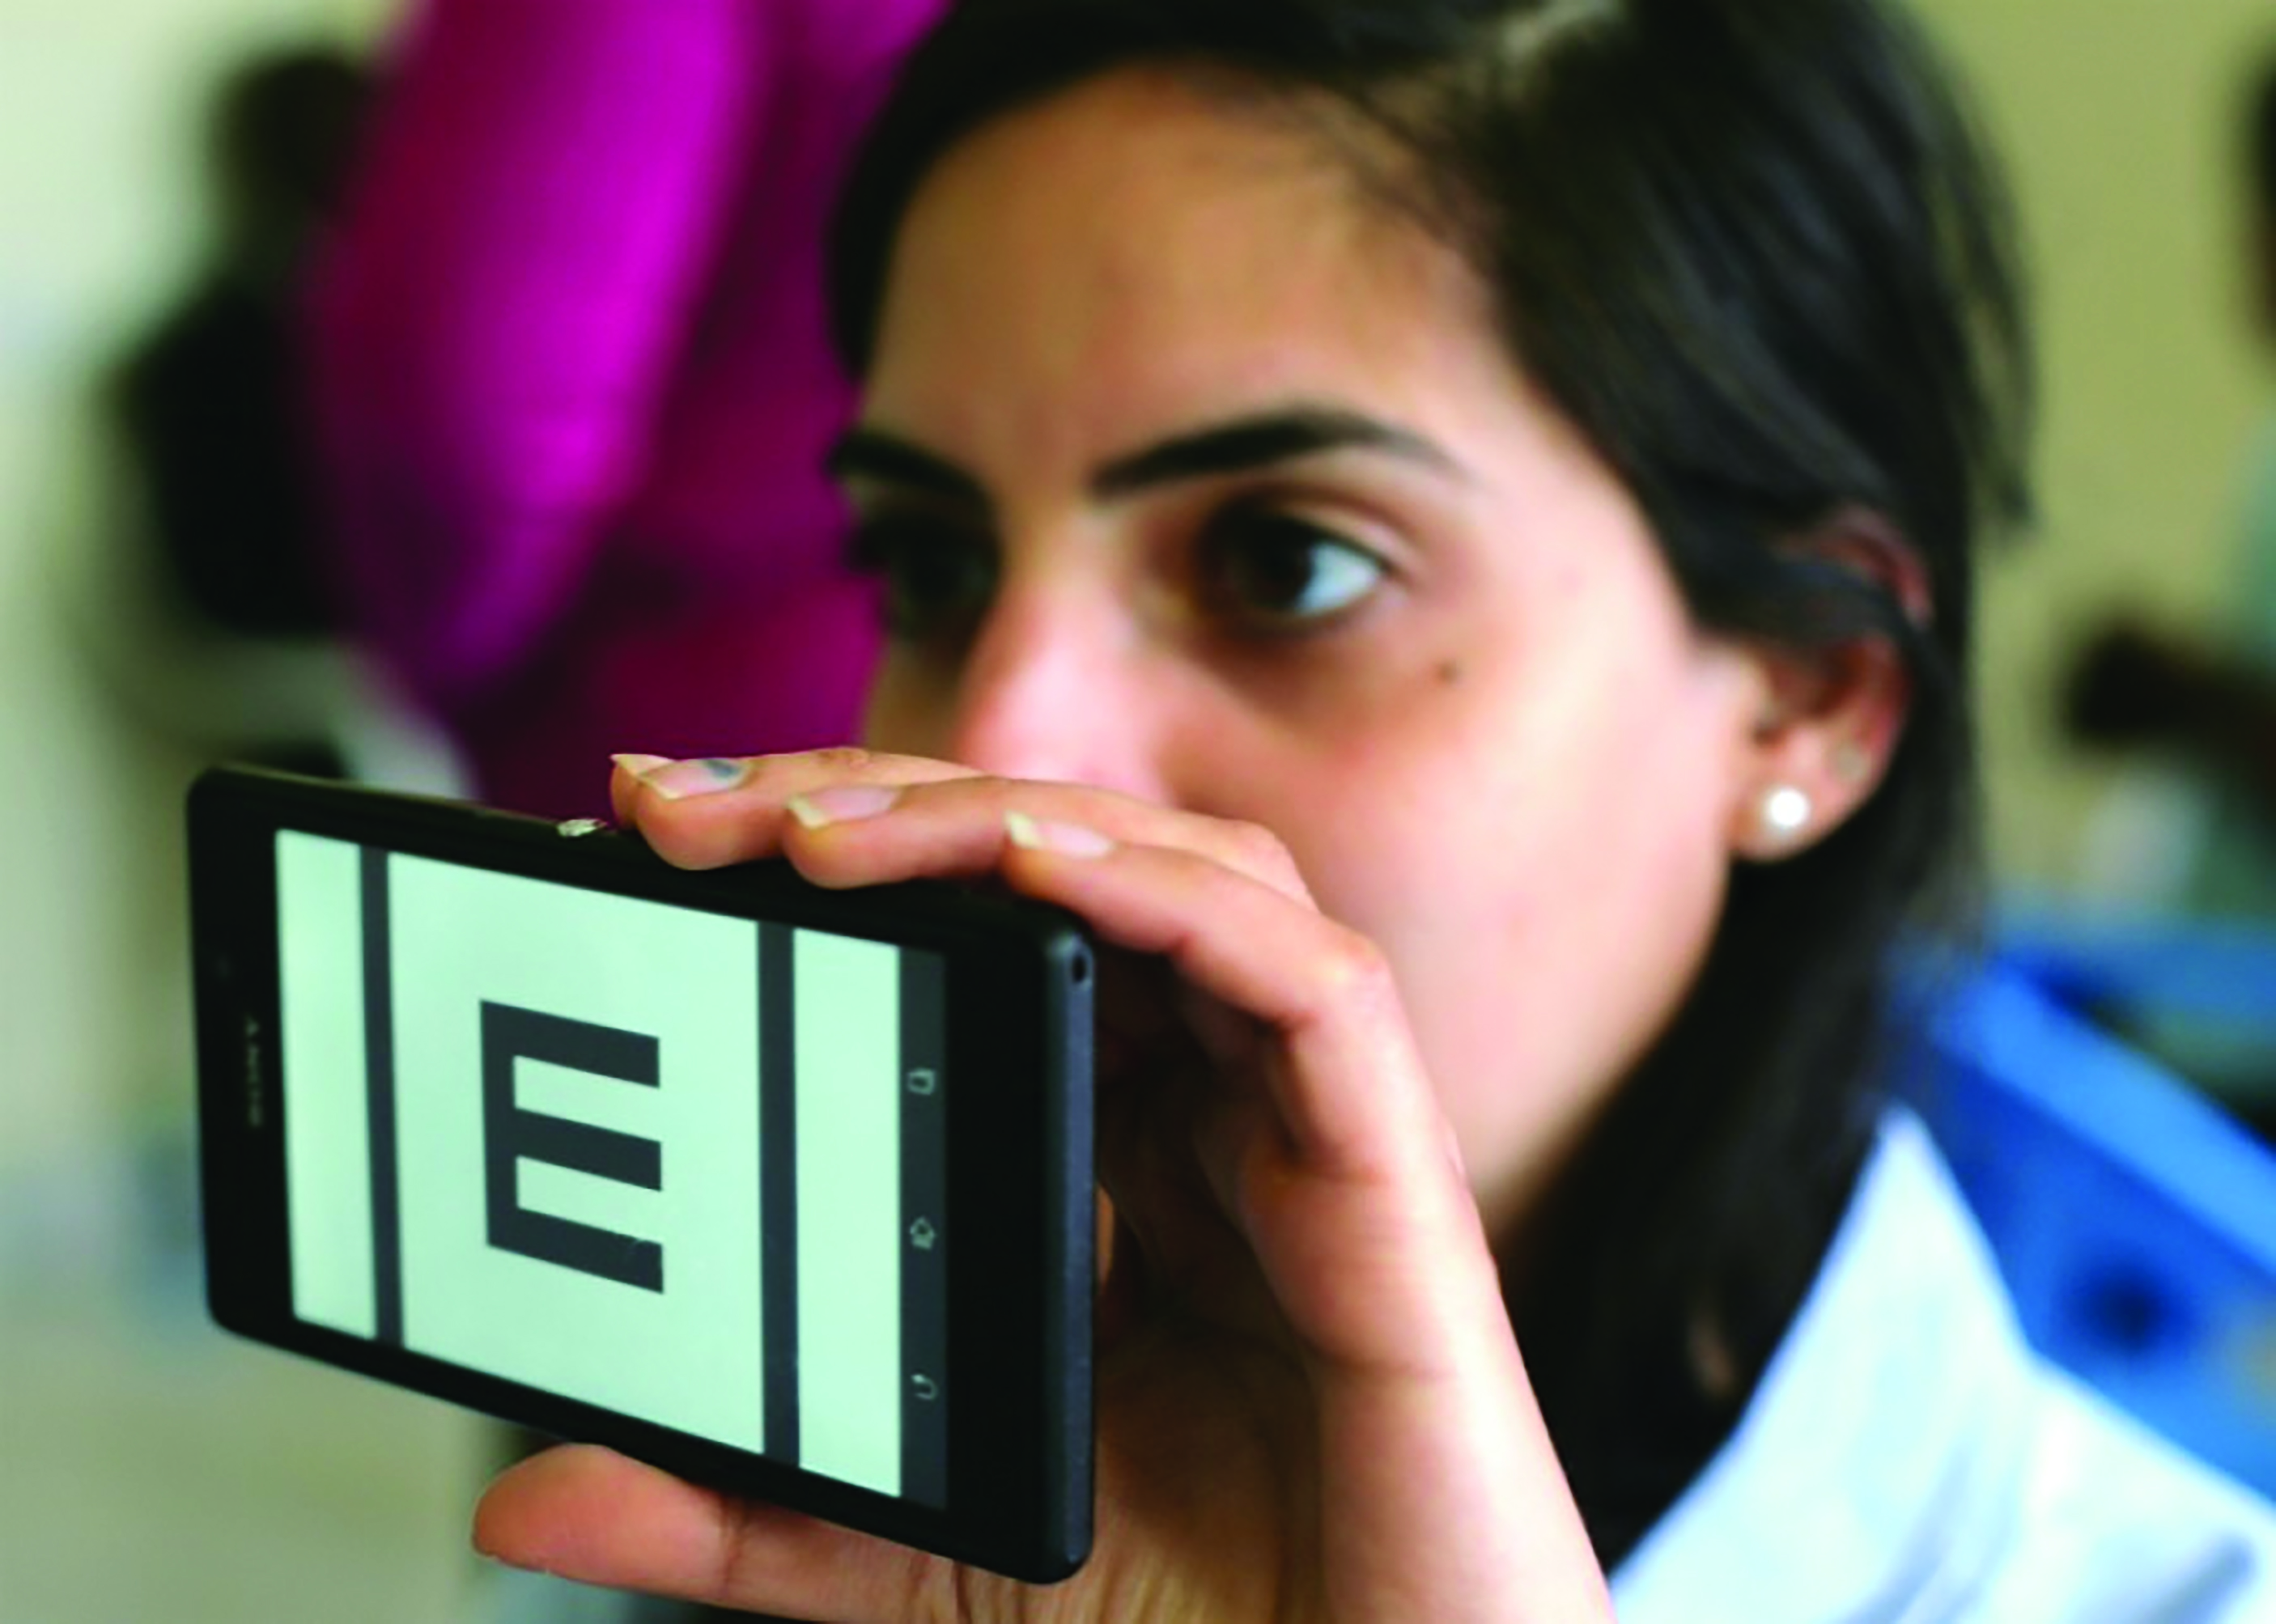 Figure 3: The Peek Acuity app can be used on a smartphone to provide measurements of visual acuity
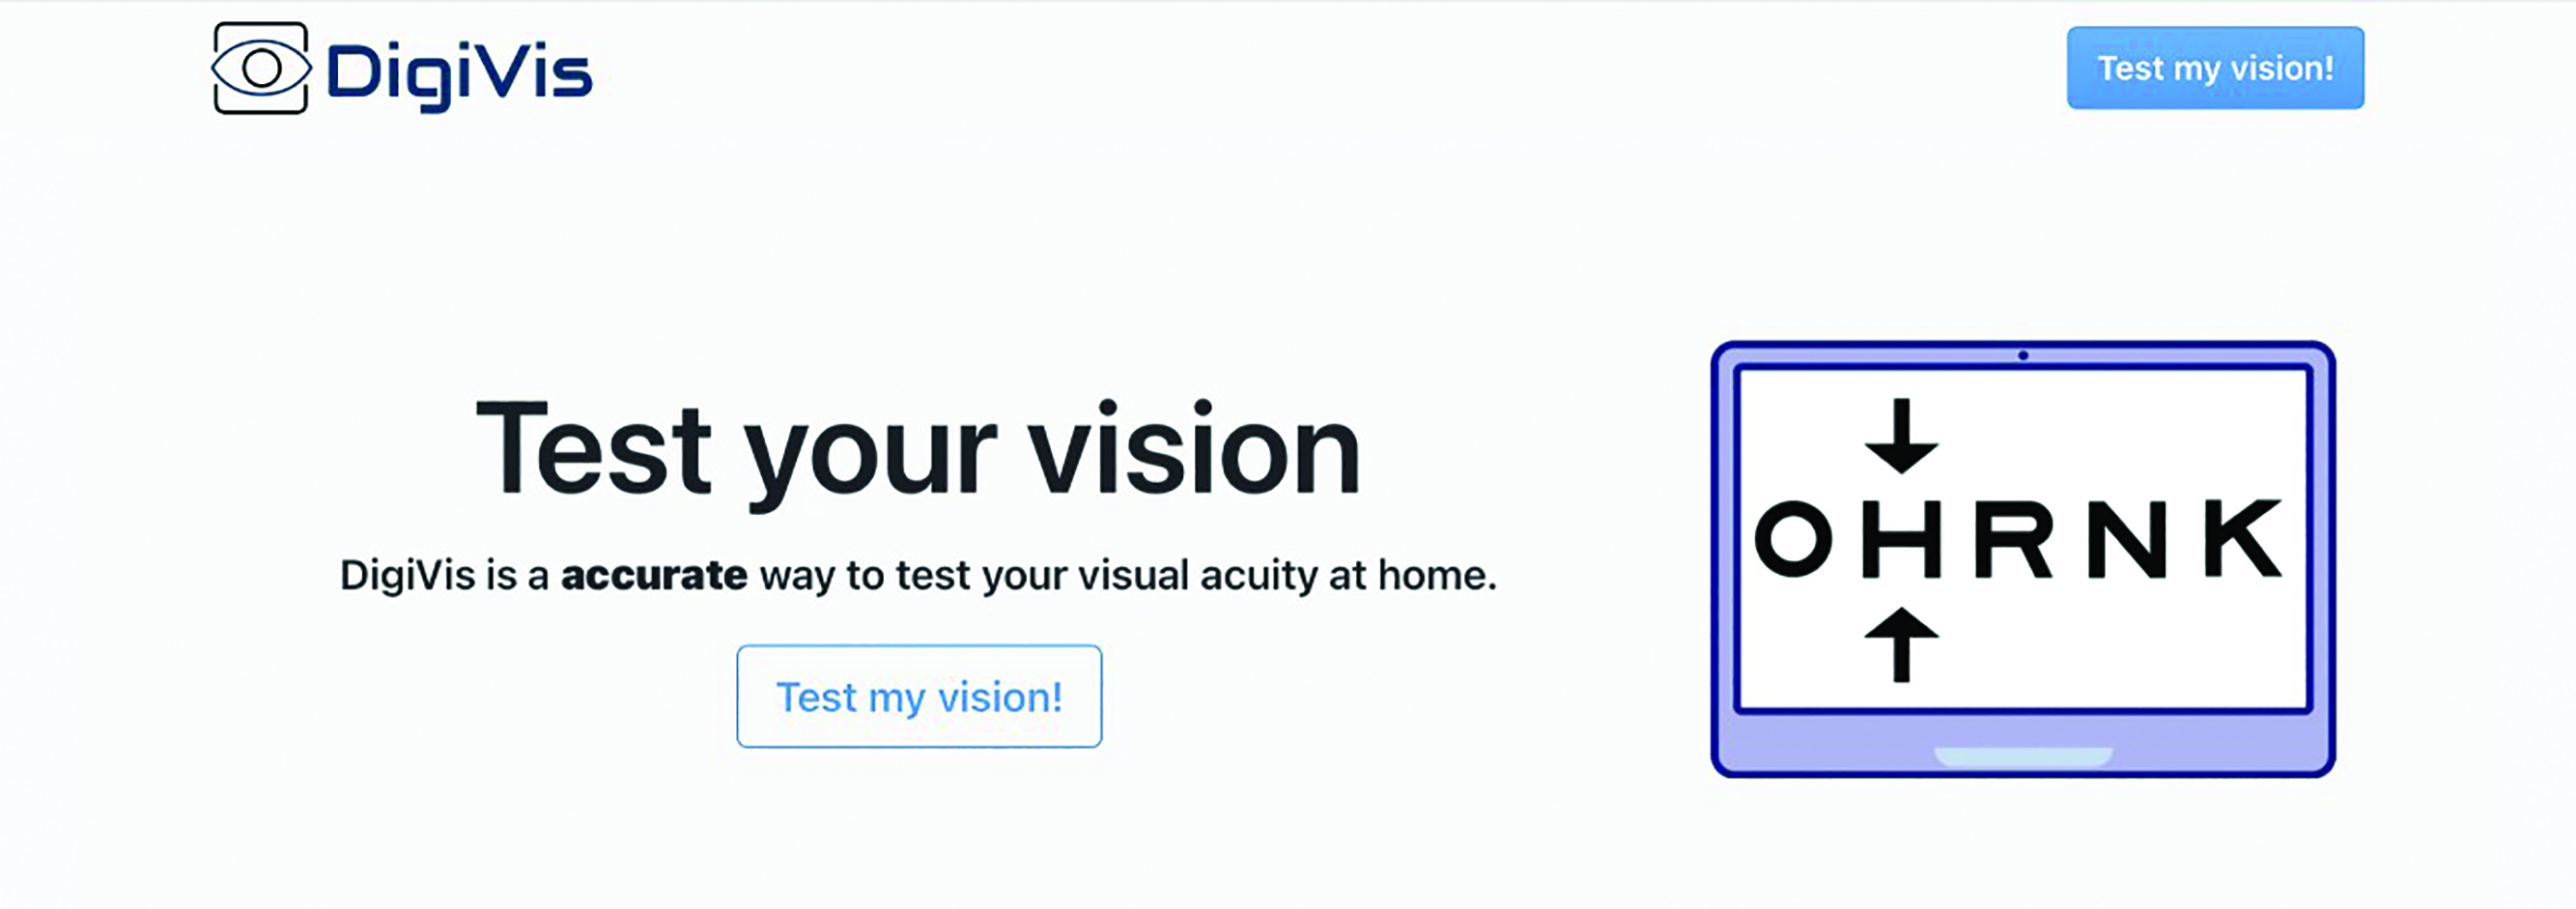 Figure 4: DigiVis is a paediatric vision screening tool
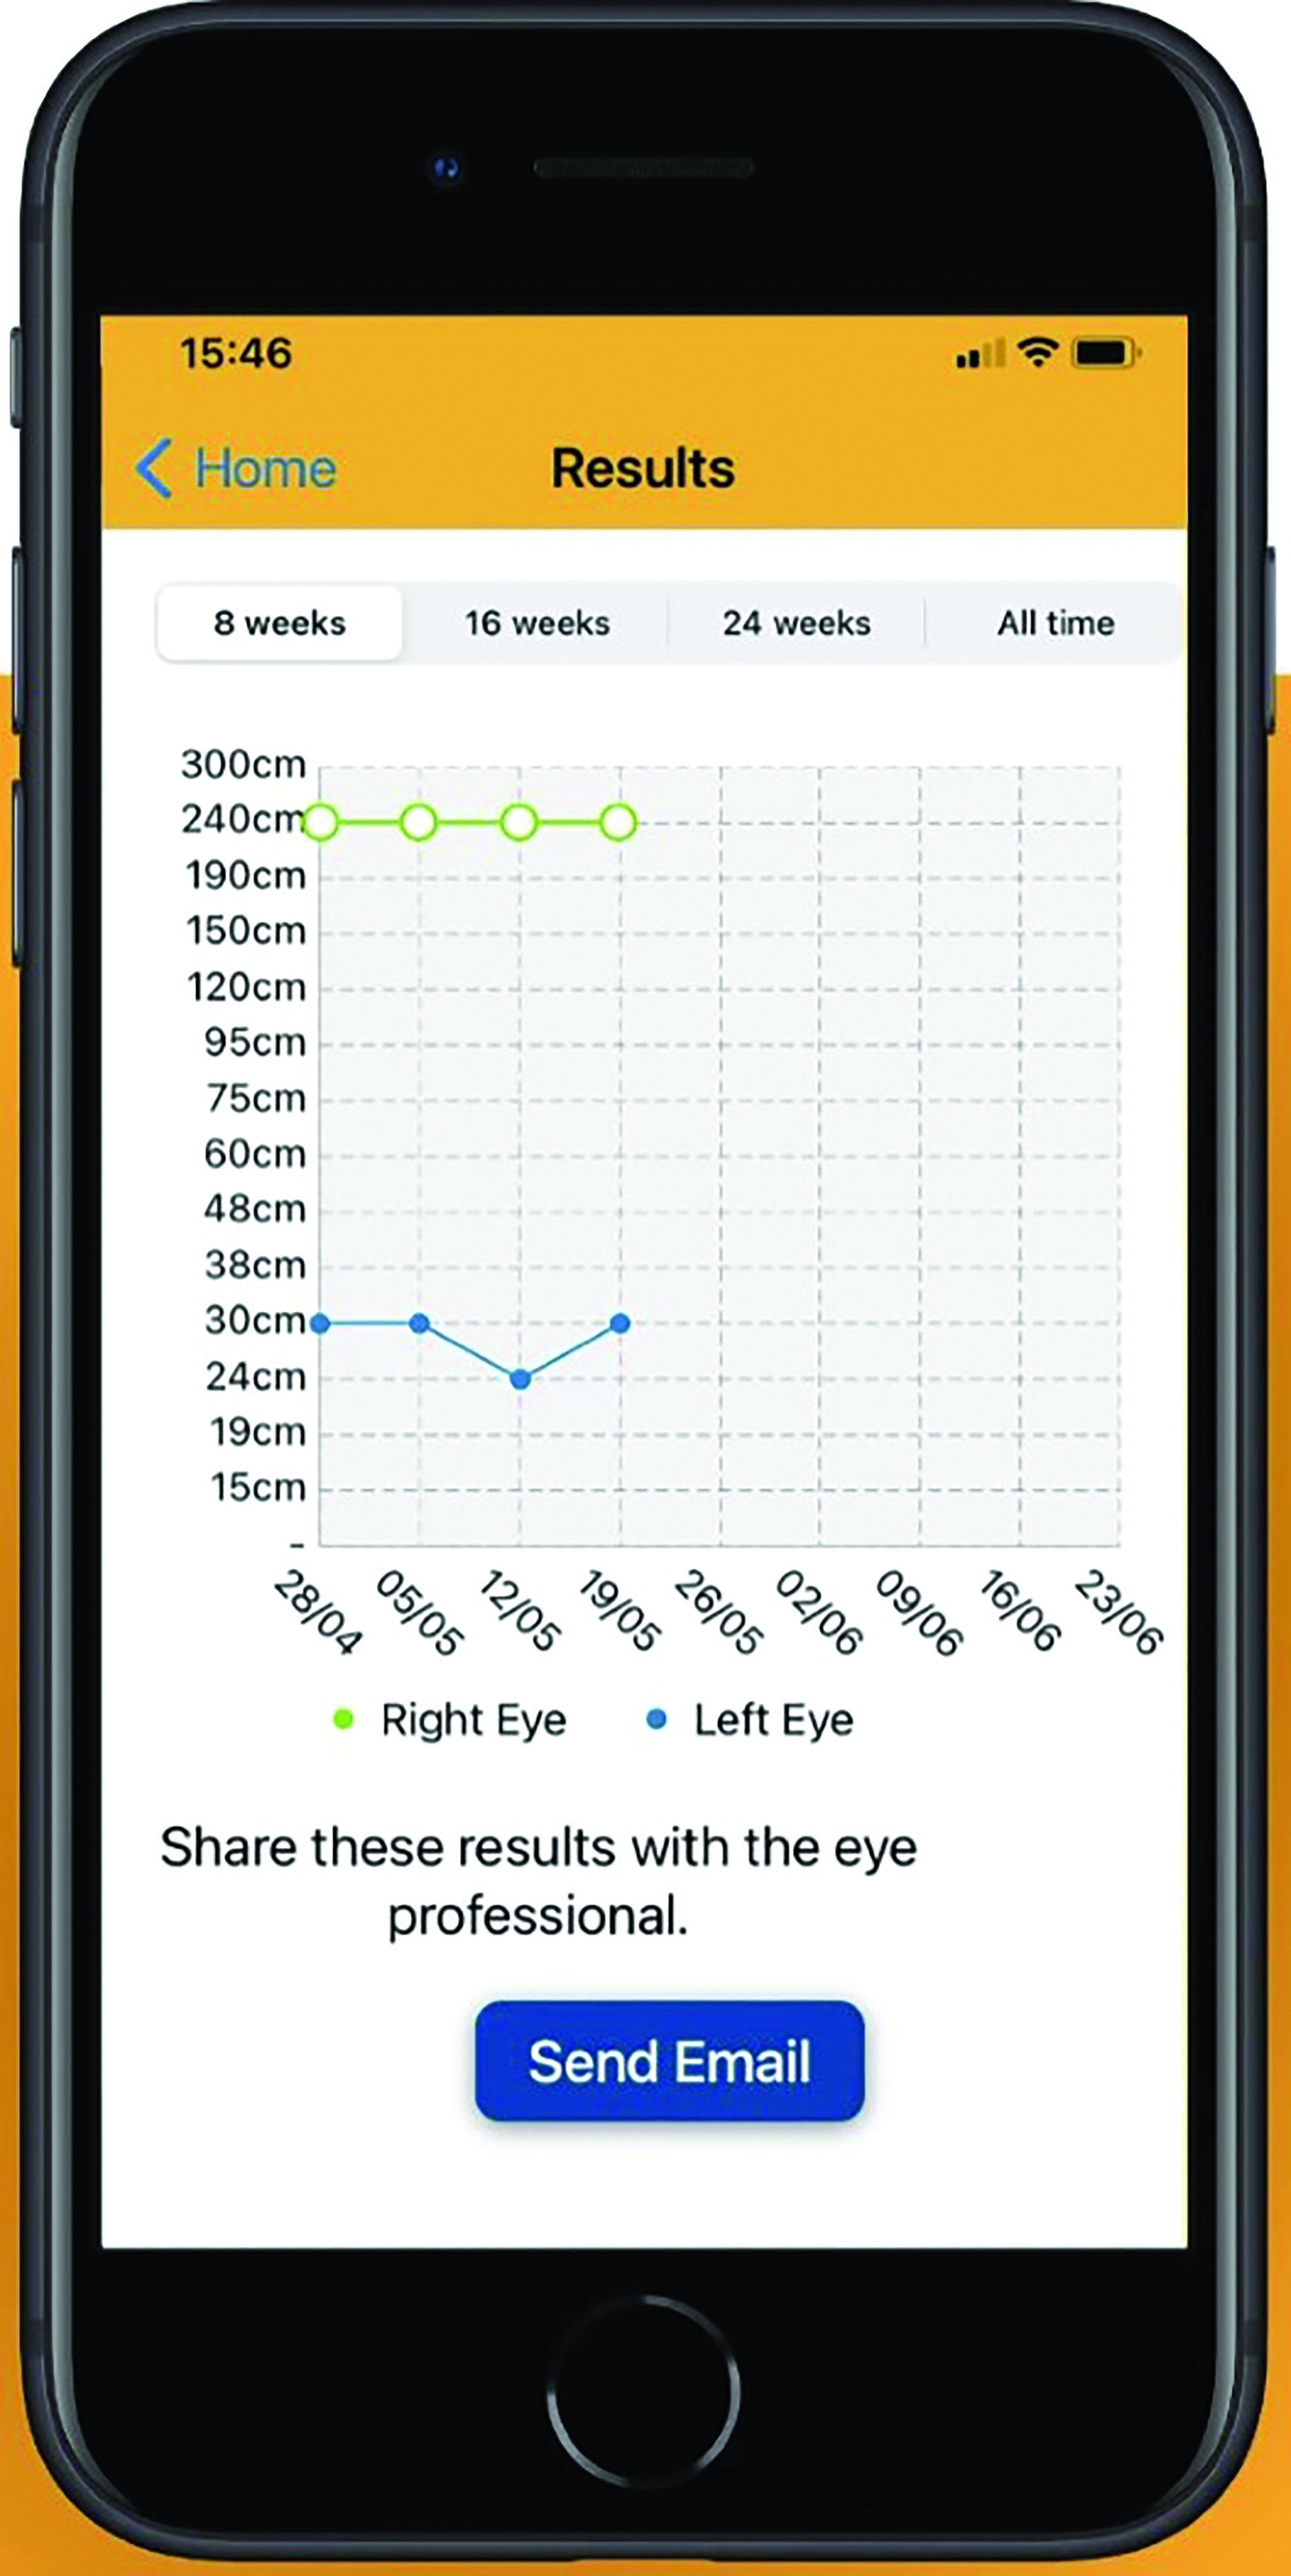 Figure 5: The Kay Amblyopia Tracker allows parents to monitor their child’s
vision at home during treatment for amblyopia
These Apps have been shown to be capable of producing accurate and repeatable measurements when used according to the instructions.13-15 However, studies have shown that some patients are reluctant to download an app on their own device while others lack confidence to measure their vision without supervision.16-18
The School Screener, developed by Thomson Screening, is designed specifically to be used by school nurses, orthoptists and trained screeners for school-entry screening.19-21 The software uses an interactive approach to measure crowded linear LogMAR acuity. Results are then synced with a cloud server which analyses results and automatically produces letters for parents. The system can also track children through the referral pathway by allowing clinicians in a secondary clinic to access results and enter the outcome of the secondary examination. This system is in widespread use for school-entry screening across the UK (figure 6).
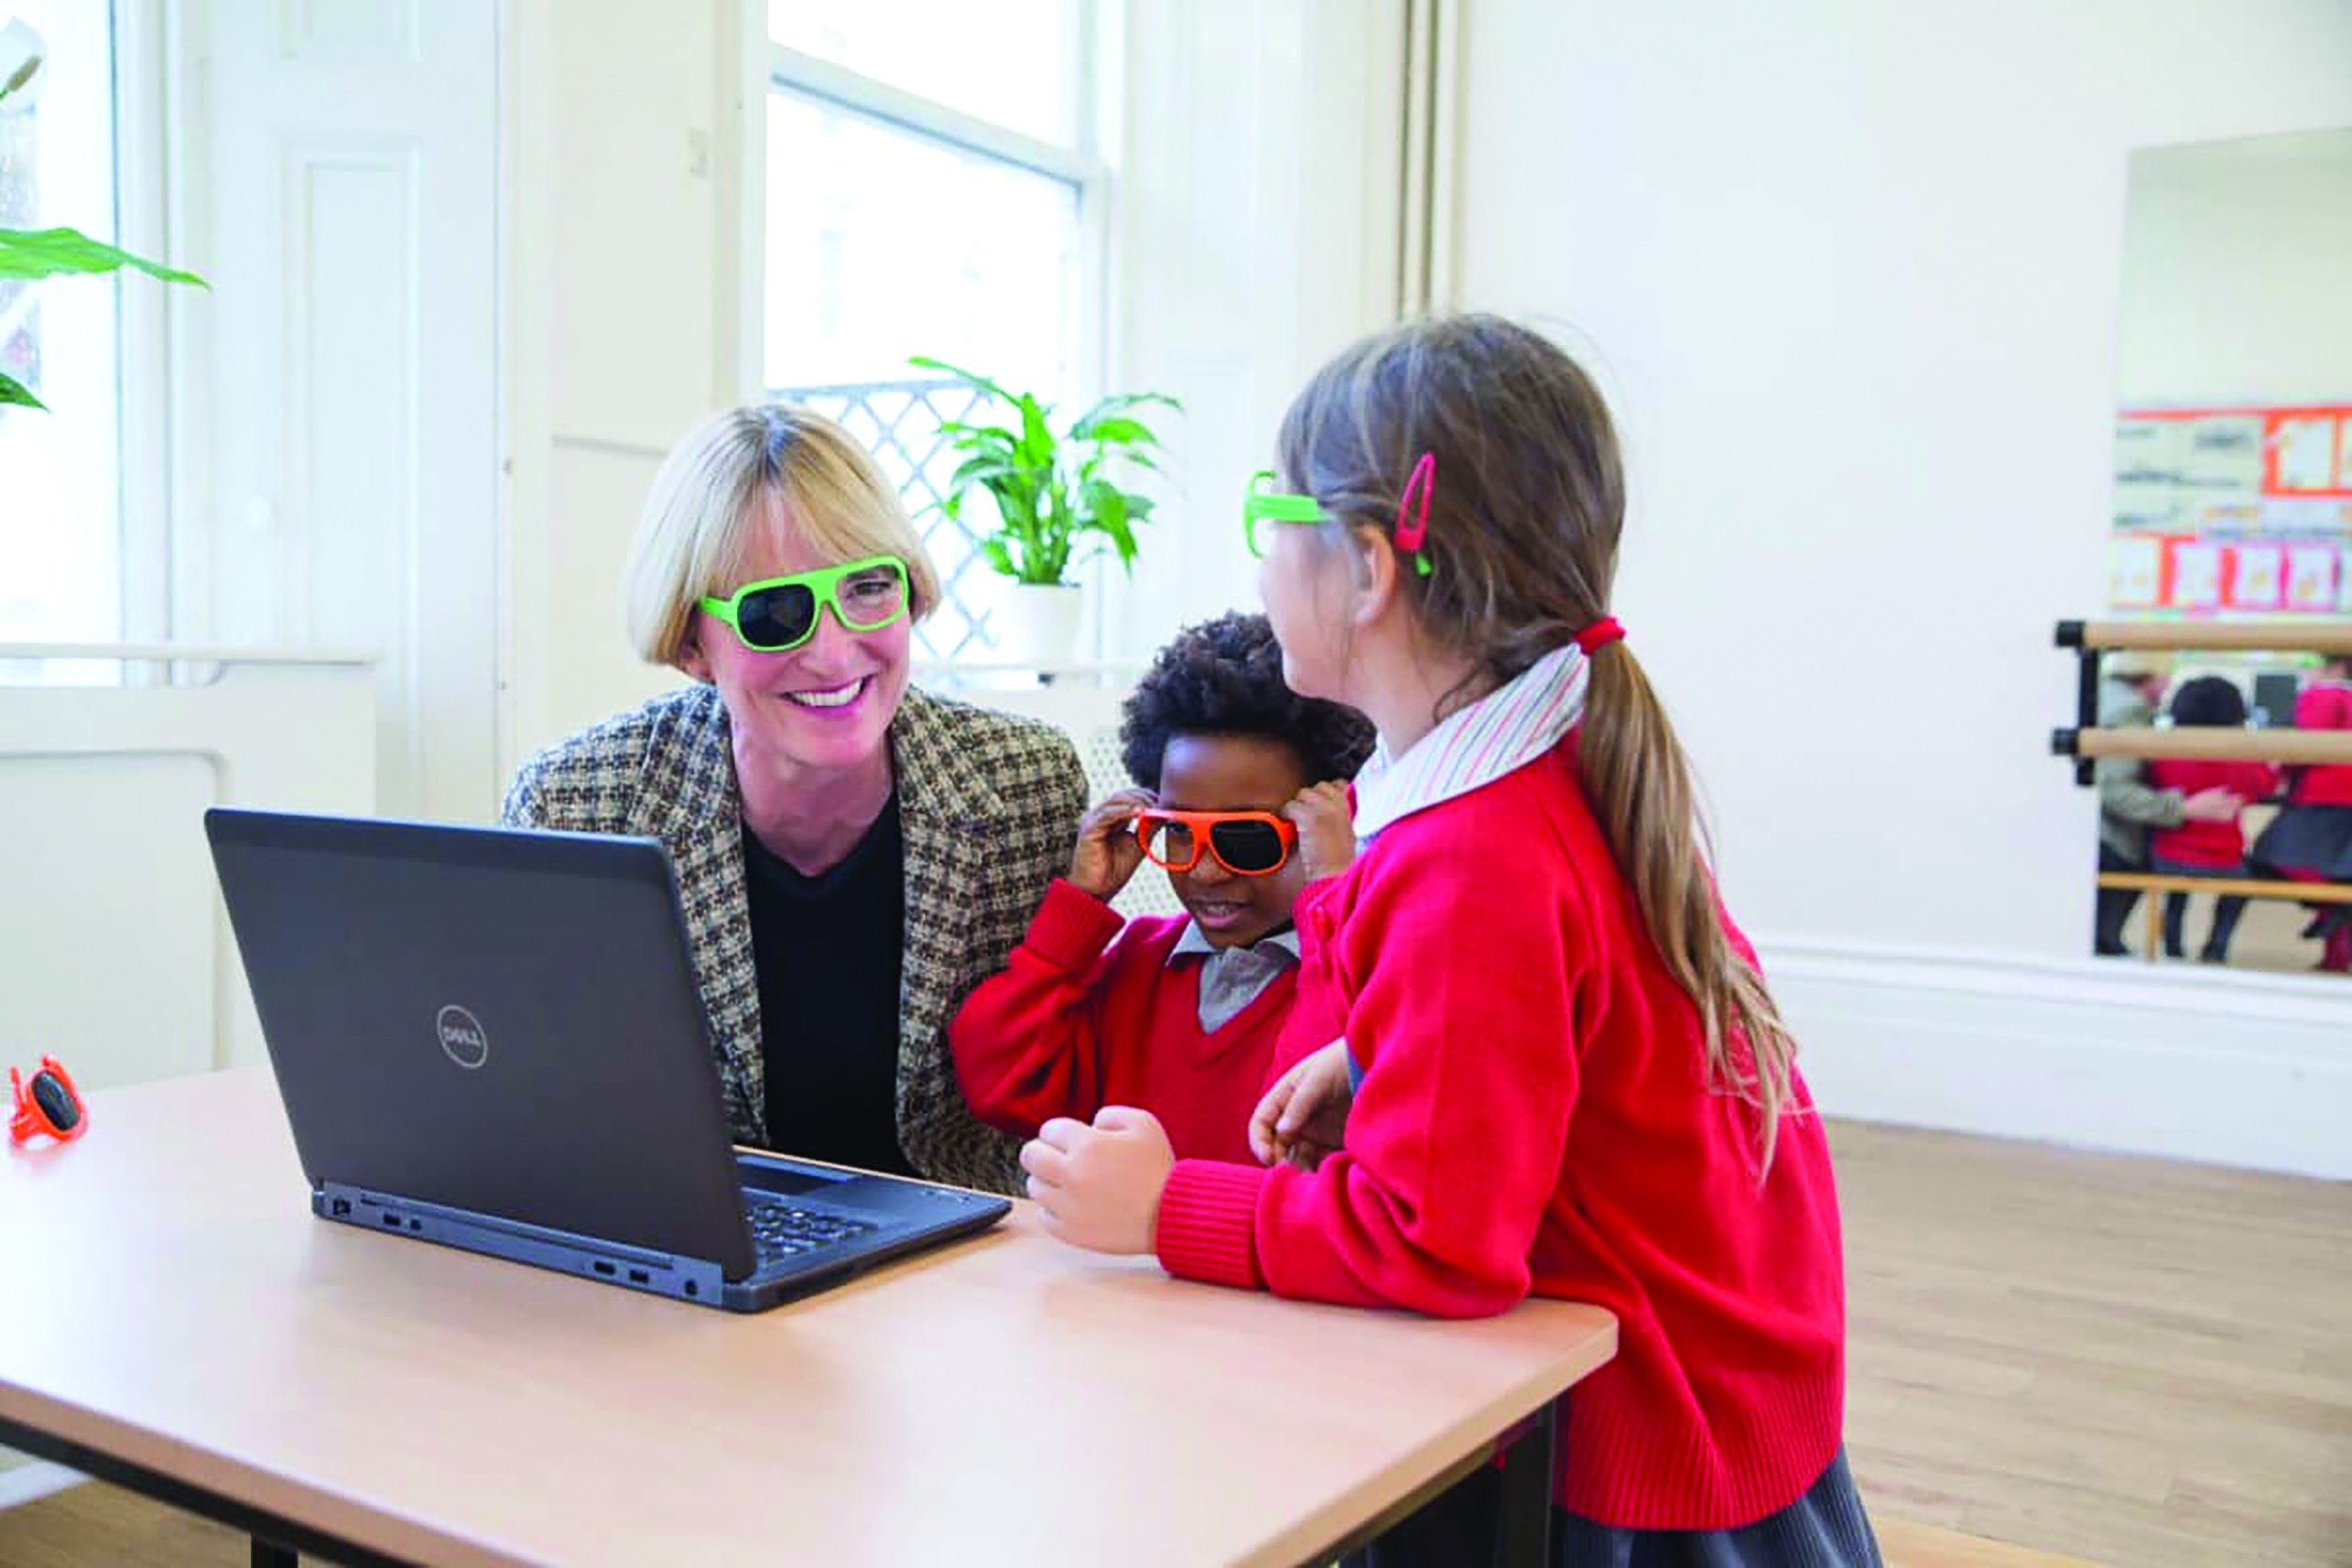 Figure 6: The School Screener provides complete management of school-entry vision screening (taken from www.specsavers-spectrum.com/news/school-vision-screening-programme-aims-encourage-childrens-eye-tests)
Zoom and Teams Testing
The development of video conferencing software, such as Zoom and Teams, has provided a simple but very effective remote testing solution.21 The clinician runs Test Chart software on their PC then initiates a conference call with the patient. Having explained the process to the patient, the clinician then shares their screen with the patient so the patient sees the test chart on their own device (see Optician 26.02.21, page 28).
The patient is then asked to measure the size of a calibration letter displayed on their screen (figure 7) and to measure 3m (or the maximum distance possible within their environment). The clinician enters this information into the software and the chart will be automatically re-scaled to the correct size for the patient’s device and viewing distance. The clinician can then provide the normal instructions and encouragement and view the patient throughout the test.
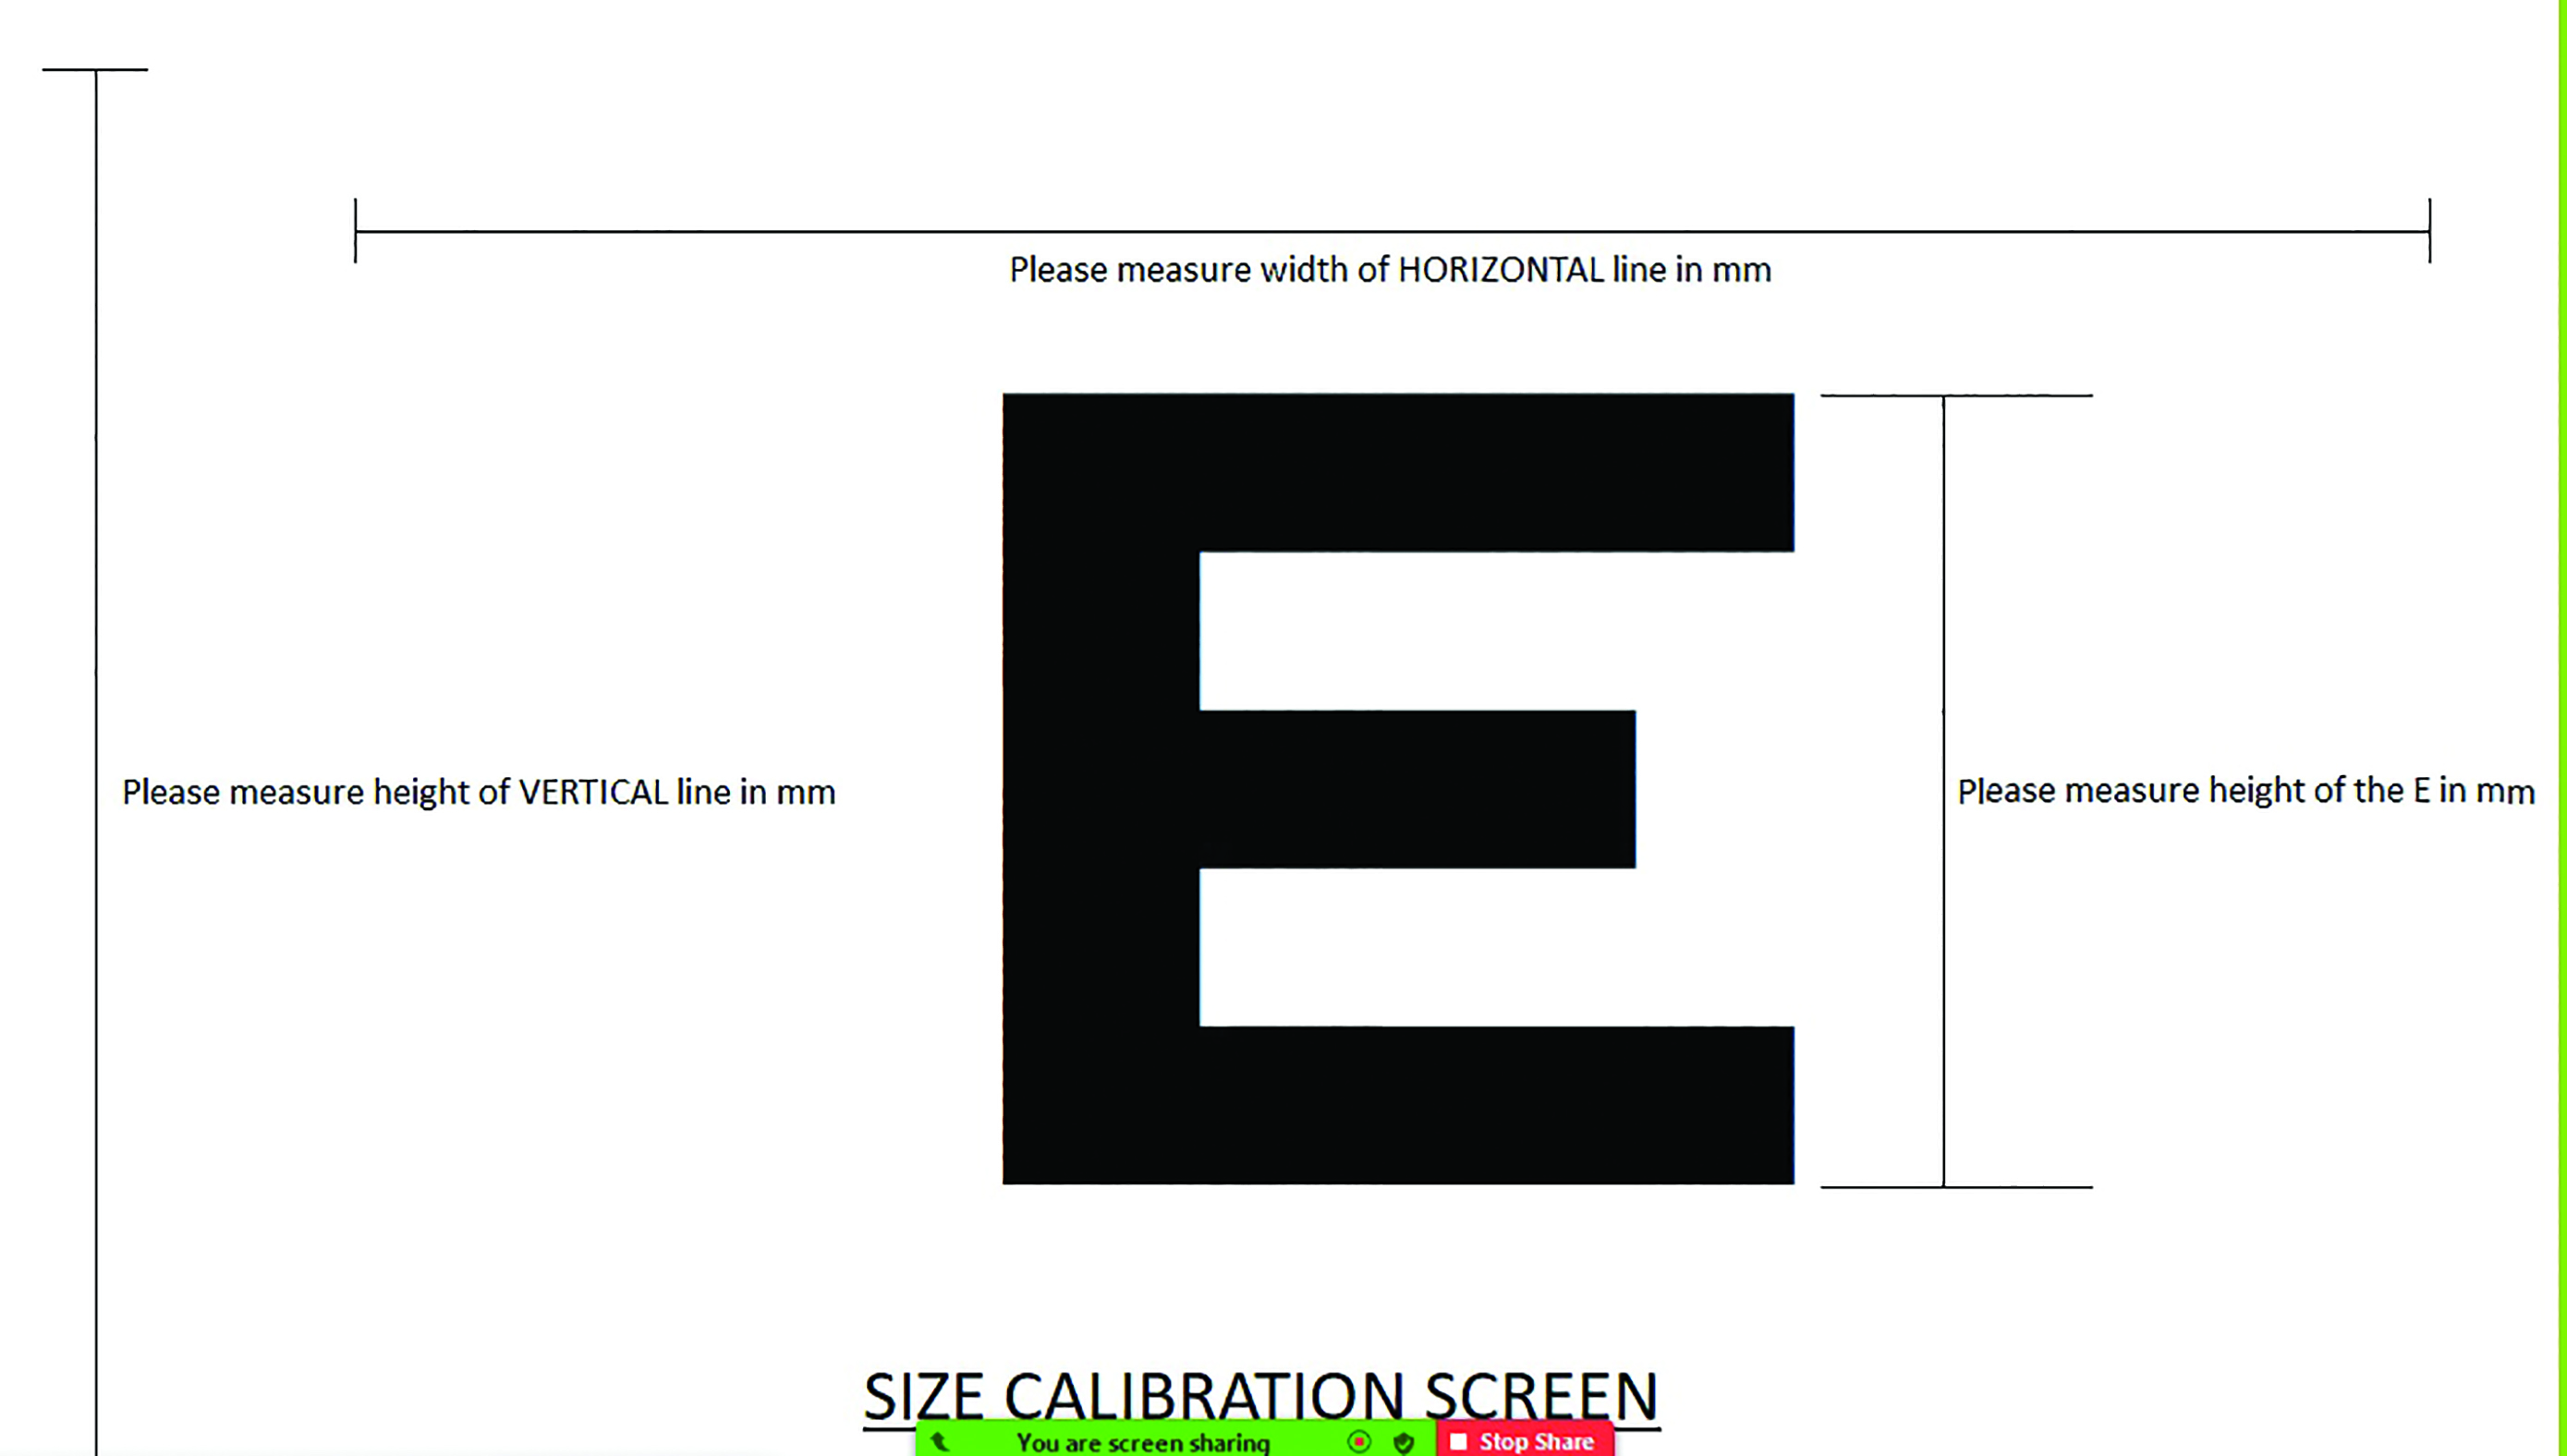 Figure 7: Measuring a calibration letter allows accurate use of acuity software over video conferencing systems
While this method introduces a few additional variables to the testing process, results suggest that if care is taken with the calibration, measurements of visual acuity obtained in this way correlate well with those obtained in the clinic.
Web-based software
Another approach currently under development by the author and colleagues uses a standard web interface to display test stimuli. The process is as follows:
- The clinician logs into a cloud-based account and initiates a connection to a new device.
- The patient is then sent a link by email or text to connect their device. The clinician views a control screen that provides a menu of tests and options.
- The clinician initially displays a calibration screen on the patient’s device and asks them to measure the size of the calibration object and enter the maximum viewing distance possible within their environment. This information is stored for this device, avoiding the need to repeat this for future tests.
- The clinician then selects the required test (such as measurement of visual acuity) and a chart in the required format is shown on the patient’s device, suitably calibrated for the size of the device and the viewing distance.
- Zoom, Teams or other video-conferencing software may be used simultaneously to communicate with the patient throughout the test.
This approach has several advantages over the app-based approach:
- The patient is not required to download any software onto their device.
- The software is device agnostic and will work on most devices with a web browser.
- A wide range of tests of visual function could be made available within this framework.
This method may also be used to display visual stimuli (such as near test types) on a tablet or other device within the consulting room. This allows the clinician to remotely change the test screen viewed by the patient from their PC, thus avoiding the need to reach over the patient to select the test from a screen menu. In the post-Covid world, this minimises the possibility of contamination.
Self-assessment
It is estimated that approximately 30% of the UK population do not engage in eye care. For some, cost may be a factor while for others it is a lack of awareness of the importance of eye care. By definition, all current methods of promoting regular eye care have failed with this group.
However, evidence from data obtained using a self-service vision screening kiosk suggest that many within this group will engage with a self-administered test. If such a test demonstrates that their vision is below average or that they do not meet the legal requirement for driving, it provides powerful motivation to engage.
CheckMyVision is an online Cloud-based system developed by Thomson Software Solutions that allows patients to check their vision in the comfort of their own homes, using a PC, laptop or tablet (see Optician 20.03.21).22 The system uses voice instructions and simple graphics to guide the patient through a test of their distance and near vision and the number plate test for driving. It then uses an intelligent questionnaire to build up a profile of the patient and their symptoms and history.
CheckMyVision incorporates several innovative features to meet the challenge of providing accurate measurements of vision on different devices and without any supervision by a clinician.
For example, to calibrate the screen size, the user is required to place a bank card/driving licence/identity card (which are all a standard size) against the screen and stretch an image on the screen so it matches the size of the card.
For the distance visual acuity test, the user is required to stand 3m from the screen. This can be measured using a tape measure if one is available. Alternatively, they can enter their shoe size and the software will work out how many pigeon footsteps are required to pace out 3m.
Another challenge is how to record responses while standing at 3m from the screen. If no helper is available, a QR code is presented, which is scanned using any smartphone. The smartphone then becomes an intelligent remote control allowing the user to enter their responses from 3m (figure 8).
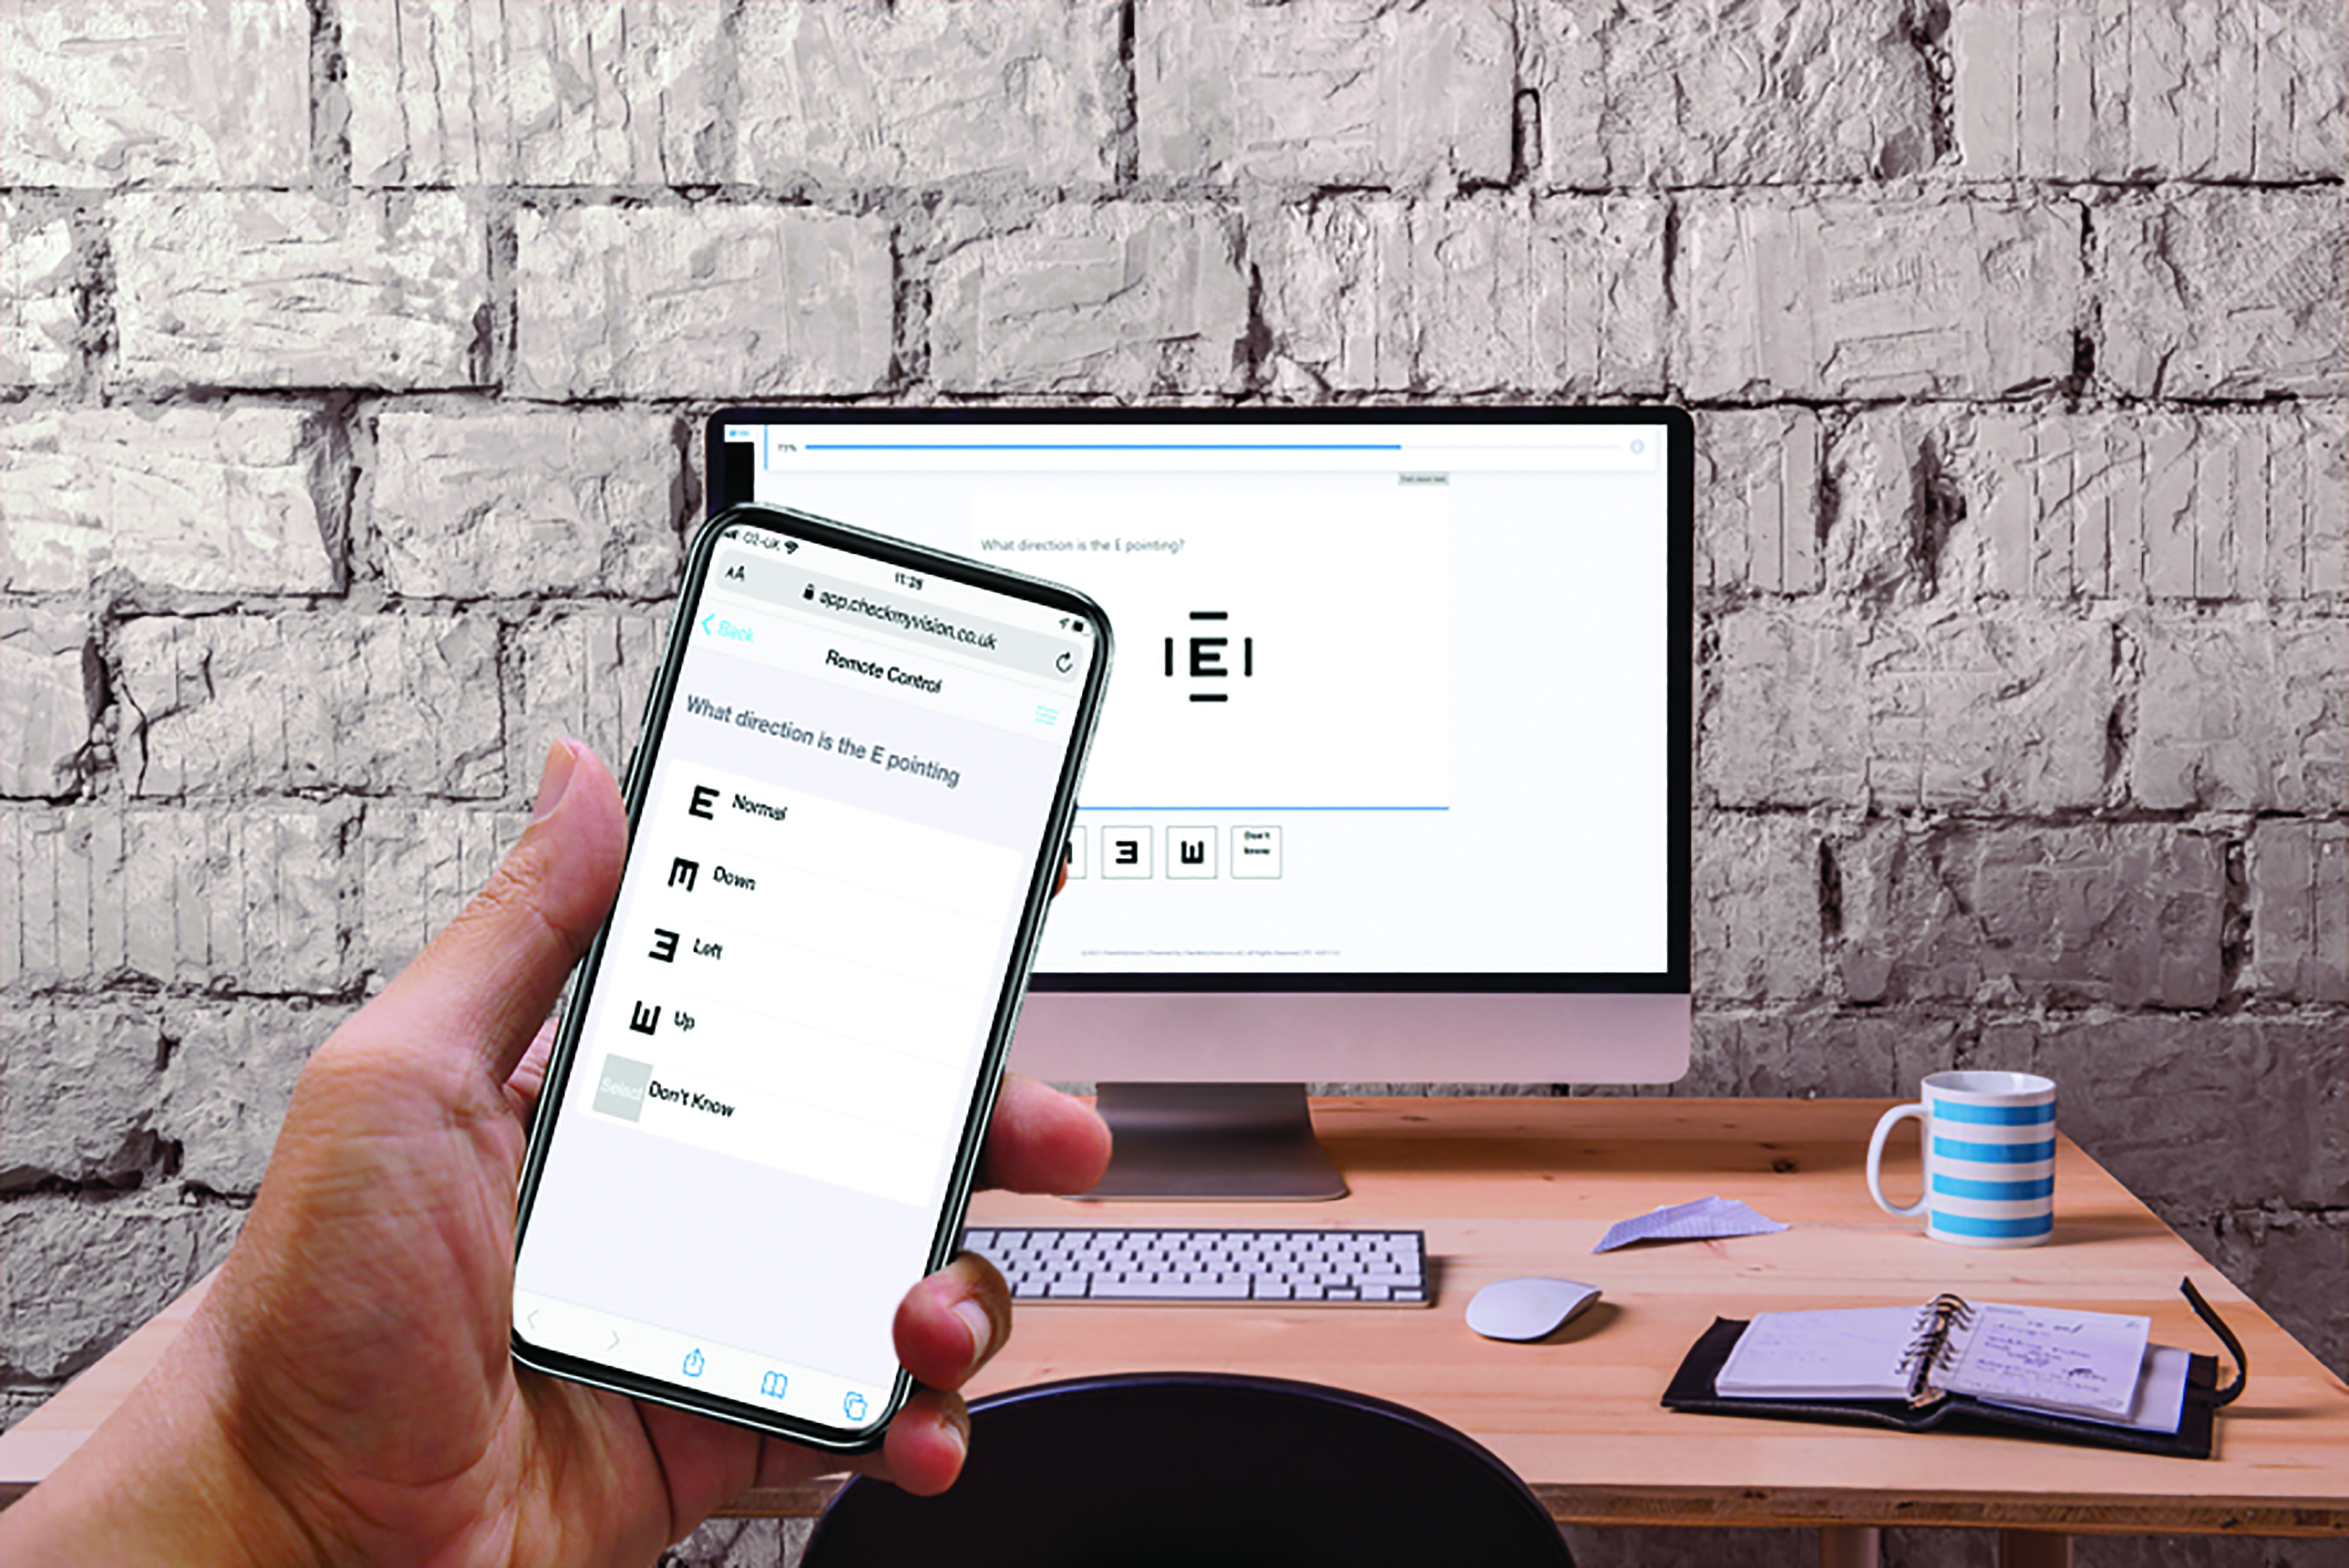 Figure 8: CheckMyVision provides a link to smartphones that allows the phone to be used as a remote control during the test
Upon completion of the test, the program creates a personalised report taking account of their vision test results and the information gathered in the questionnaire. It is important that the user is then encouraged to act on the recommendations and engage with a local practice (figure 9).
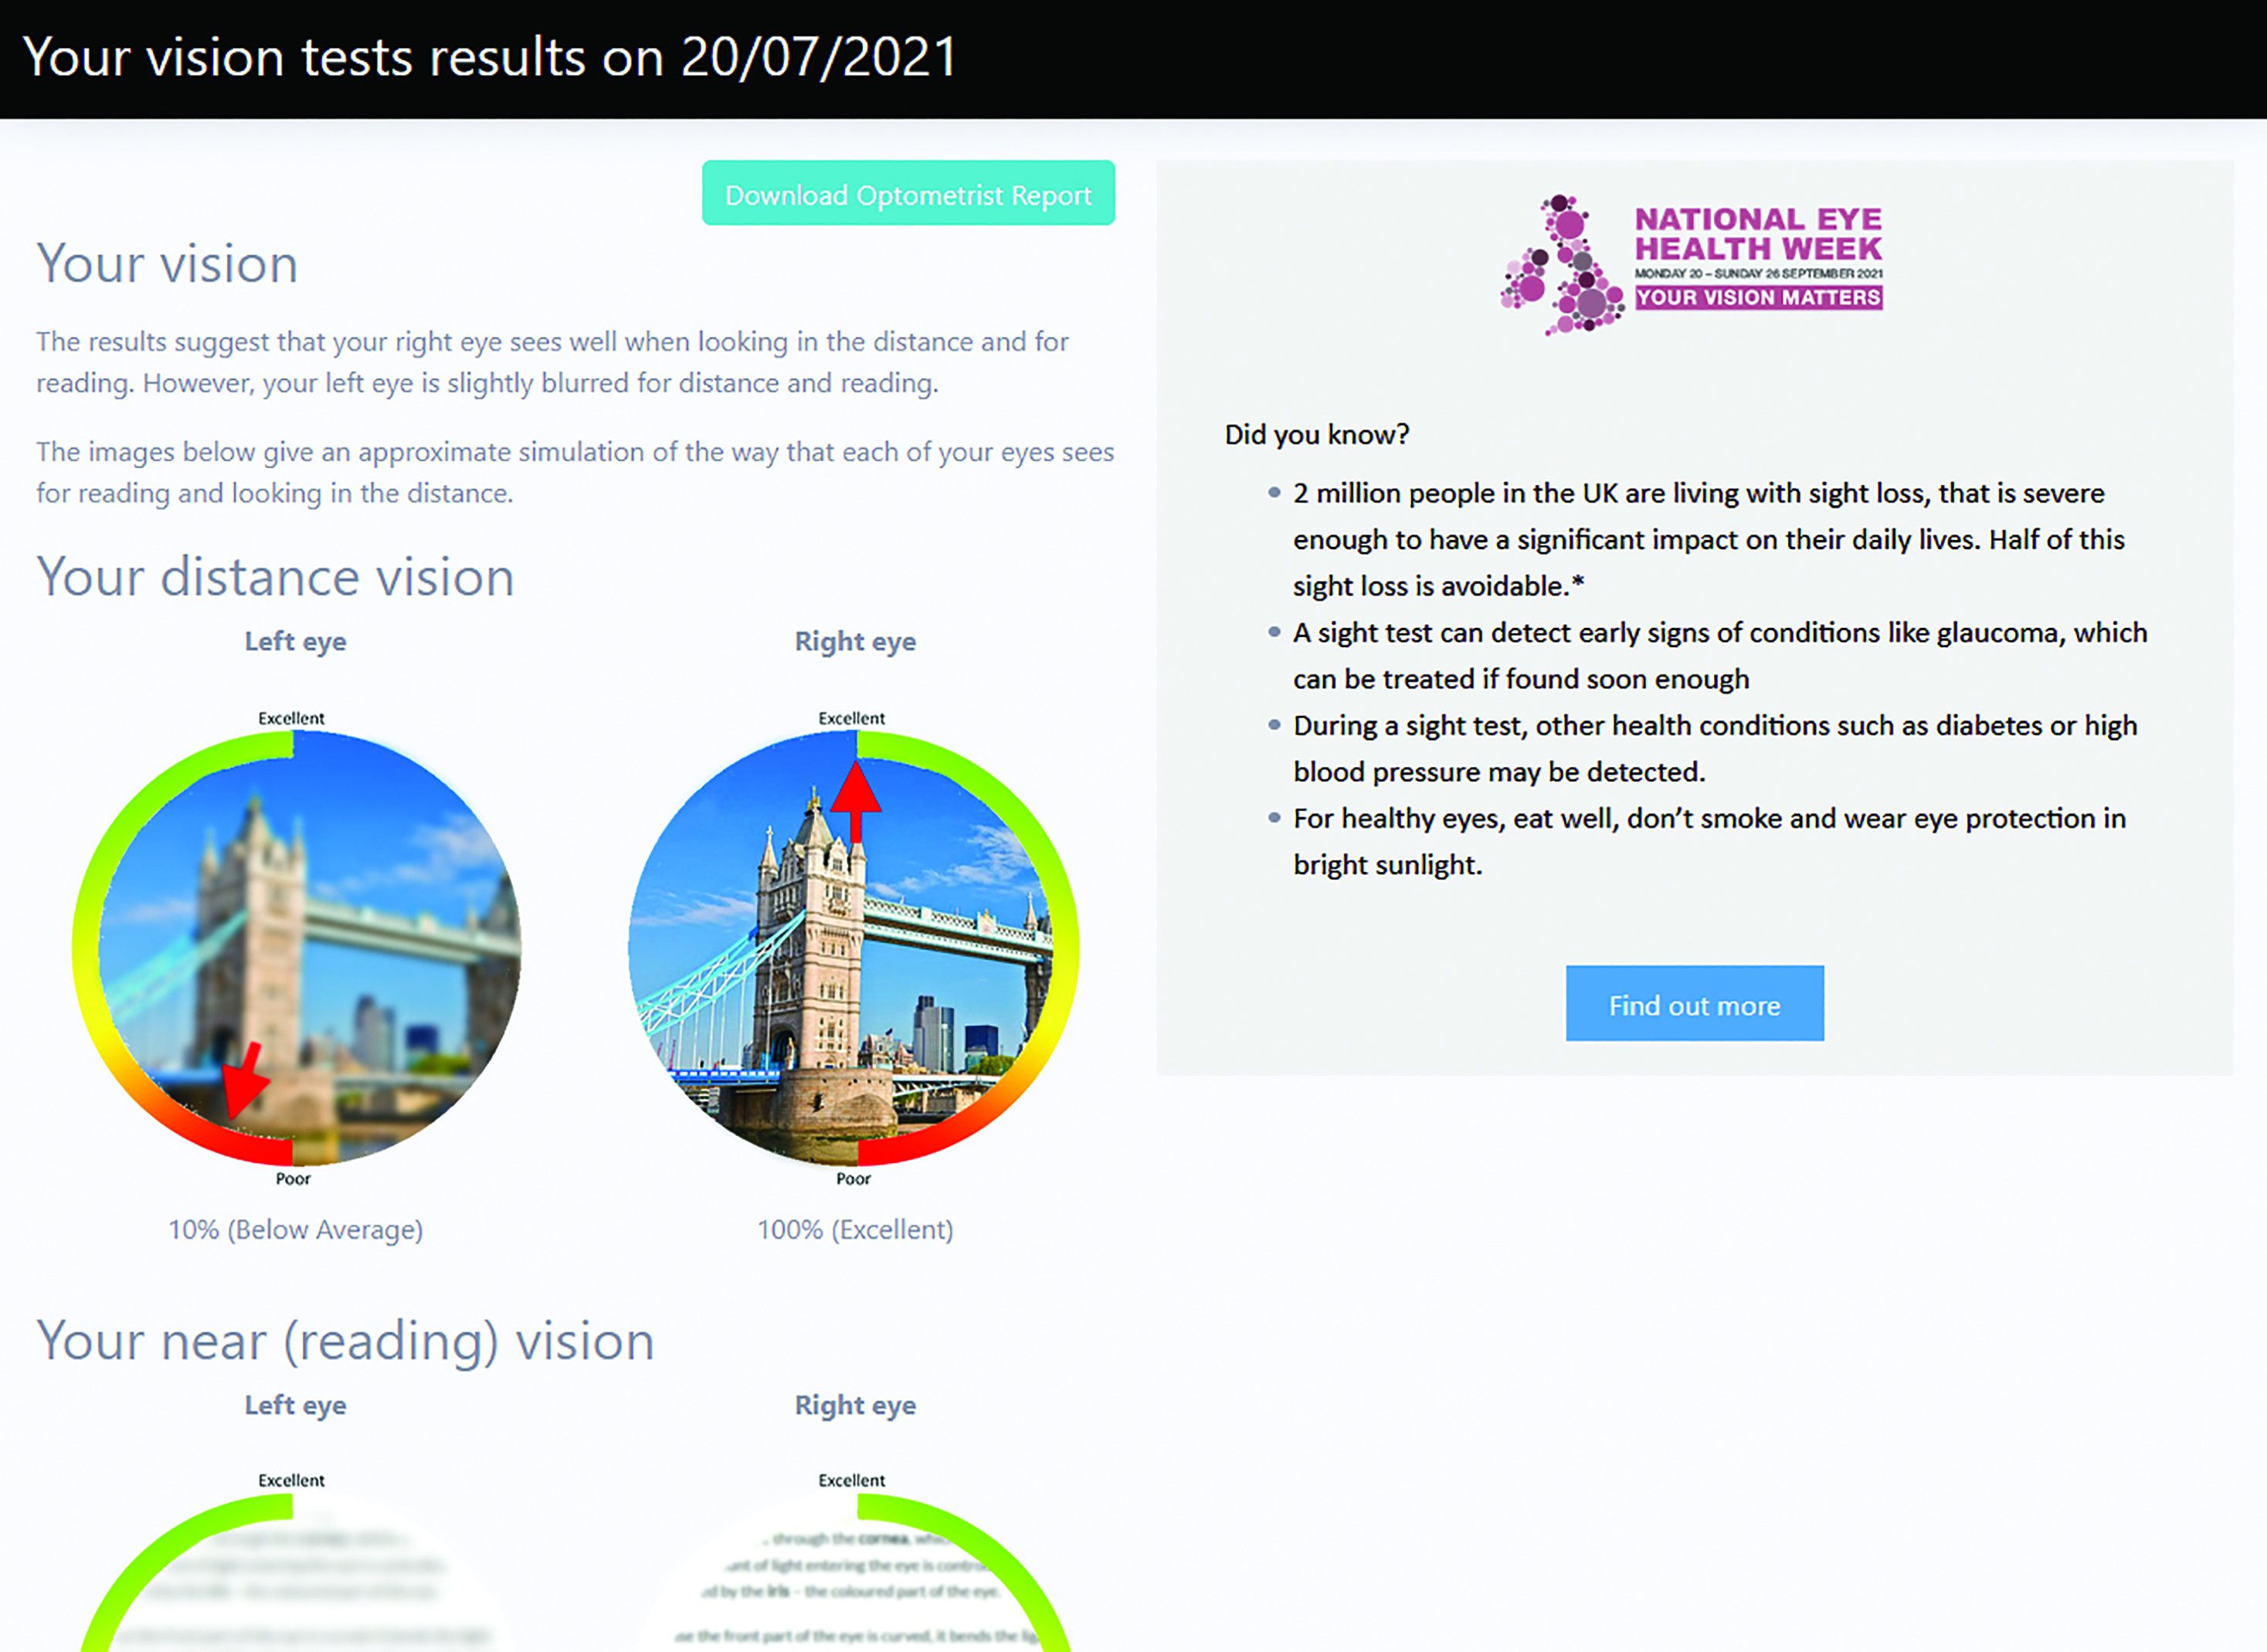 Figure 9: CheckMyVision creates a personalised report based on the vision test results and the responses to the questionnaire
To this end, CheckMyVision is accessed via a link that any subscribing practice or clinic may include on their own website. A click-through takes the patient to a portal that may be customised with the logo and colour scheme of the subscribing practice. Alternatively, users scouring the internet for an online vision assessment might be directed to the CheckMyVision public-facing website. This site contains information about the test and then invites the patient to enter their postcode. They will then be shown the practices in their area subscribed to the CheckMyVision test.
Conclusions
Developments in computer and display technology have provided an ideal medium for generating visual stimuli in the consulting room. Coupled with powerful test chart software, clinicians now have access to an impressive array of tools for assessing vision.
The uniformity and stability of modern displays coupled with the ability to calibrate computerised charts to the exact viewing distance and use improved chart designs, has undoubtedly improved the accuracy and repeatability of visual acuity measurements.
While high contrast visual acuity probably remains the single most valuable test of vision, practitioners now have access to a variety of other tests such as low contrast acuity and contrast sensitivity which, in some cases, can provide a better understanding of a patient’s visual status.
Meanwhile, the widespread use of computers, tablets and smartphones in the home has provided new opportunities for assessing vision remotely and providing self-administered vision screening. While a degree of caution is required in the way this new technology is implemented, as technology continues to evolve, eye care is likely to look very different in 40 years’ time.
- Professor David Thomson was Professor of Optometry and Visual Science at City University and is MD of Thomson Software Solutions.
References
- Radner W. Reading charts in ophthalmology. Graefe’s Archive for Clinical and Experimental Ophthalmology. 2017;255(8). doi:10.1007/s00417-017-3659-0
- Rabbetts RB. Bennett and Rabbetts’ Clinical Visual Optics. Bennett and Rabbetts’ Clinical Visual Optics. Published online 2007
- Bailey IL, Lovie JE. The design and use of a new near vision chart. Optometry and Vision Science. 1980;57(6). doi:10.1097/00006324-198006000-00011
- Dawkins A, Bjerre A. Do the near computerised and non-computerised crowded Kay picture tests produce the same measure of visual acuity? British and Irish Orthoptic Journal. 2016;13(0). doi:10.22599/bioj.98
- Aslam TM, Parry NRA, Murray IJ, et al. Development and testing of an automated computer tablet-based method for self-testing of high and low contrast near visual acuity in ophthalmic patients. Graefe’s Archive for Clinical and Experimental Ophthalmology. 2016;254(5). doi:10.1007/s00417-016-3293-2
- Thomson David. The Vision Toolbox App. https://www.thomson-software-solutions.com/vision-toolbox/.
- Varadaraj V, Assi L, Gajwani P, et al. Evaluation of Tablet-Based Tests of Visual Acuity and Contrast Sensitivity in Older Adults. Ophthalmic Epidemiology. Published online 2020. doi:10.1080/09286586.2020.1846758
- Bodduluri L, Boon MY, Dain SJ. Evaluation of tablet computers for visual function assessment. Behavior Research Methods. 2017;49(2). doi:10.3758/s13428-016-0725-1
- Tahir HJ, Murray IJ, Parry NRA, Aslam TM. Optimisation and assessment of three modern touch screen tablet computers for clinical vision testing. PLoS ONE. 2014;9(4). doi:10.1371/journal.pone.0095074
- Livingstone I, Butler L, Misanjo E, et al. Testing pediatric acuity with an iPad: Validation of ‘Peekaboo vision’ in Malawi and the UK. Translational Vision Science and Technology. 2019;8(1). doi:10.1167/tvst.8.1.8
- O’Connor A, Waters M, England L, Milling A, Kay H. Evaluation of a new method to track changes in vision at home for children undergoing amblyopia treatment. British and Irish Orthoptic Journal. 2021;17(1). doi:10.22599/bioj.172
- Lodhia V, Karanja S, Lees S, Bastawrous A. Acceptability, usability, and views on deployment of peek, a mobile phone mhealth intervention for eye care in Kenya: Qualitative study. JMIR mHealth and uHealth. 2016;4(2). doi:10.2196/mhealth.4746
- Perera C, Chakrabarti R, Islam FMA, Crowston J. The Eye Phone Study: Reliability and accuracy of assessing Snellen visual acuity using smartphone technology. Eye (Basingstoke). 2015;29(7). doi:10.1038/eye.2015.60
- Ansell K, Maconachie G, Bjerre A. Does the eyechart app for iphones give comparable measurements to traditional visual acuity charts? British and Irish Orthoptic Journal. 2020;16(1). doi:10.22599/bioj.146
- Pathipati AS, Wood EH, Lam CK, Sáles CS, Moshfeghi DM. Visual acuity measured with a smartphone app is more accurate than Snellen testing by emergency department providers. Graefe’s Archive for Clinical and Experimental Ophthalmology. 2016;254(6). doi:10.1007/s00417-016-3291-4
- Srinivasan K, Ramesh SV, Babu N, Sanker N, Ray A, Karuna SM. Efficacy of a remote based computerised visual acuity measurement. British Journal of Ophthalmology. 2012;96(7). doi:10.1136/bjophthalmol-2012-301751
- Painter S, Ramm L, Wadlow L, O’connor M, Sond B. Parental home vision testing of children during covid-19 pandemic. British and Irish Orthoptic Journal. 2021;17. doi:10.22599/bioj.157
- Samanta A, Mauntana S, Barsi Z, Yarlagadda B, Nelson PC. Is your vision blurry? A systematic review of home-based visual acuity for telemedicine. Journal of Telemedicine and Telecare. Published online 2020. doi:10.1177/1357633X20970398
- Thomson WD, Evans B. A new approach to vision screening in schools. Ophthalmic and Physiological Optics. 1999;19(3). doi:10.1046/j.1475-1313. 1999. 00421.x
- Thomson David. School Screener. https://schoolscreener.com
- Thomson David. Using Thomson Test charts for remote testing; www.thomson-software-solutions.com/using-thomson-test-charts-for-remote-testing
- Thomson David. CheckMyVision Web; www.thomson-software-solutions.com/checkmyvision