Hospital low vision (LV) clinics generally offer appointments to patients with vision impairment (VI) whose vision cannot be improved through spectacle correction or medical intervention. Access is dependent upon functional vision, rather than specific measure of visual acuity or sight impairment/severe sight impairment registration status. The purpose of a LV assessment is to offer suitable interventions to improve the patient’s ability to function and thereby improving their quality of life (QoL). What does this look like in reality? What are the characteristics of patients attending the service? What do visual function tests tell us? Are steps undertaken to improve functional vision?
These and other questions were addressed in a recent audit in a hospital LV service in Scotland. This article seeks to draw some lessons from this audit.
Referral and triage
Community optometrists play an important role in terms of signposting patients to a LV service and accounted for 19% of referrals. Ophthalmologists provided 43% of the referrals and eye clinic liaison officers (ECLOs) a further 29% (see figure 1).
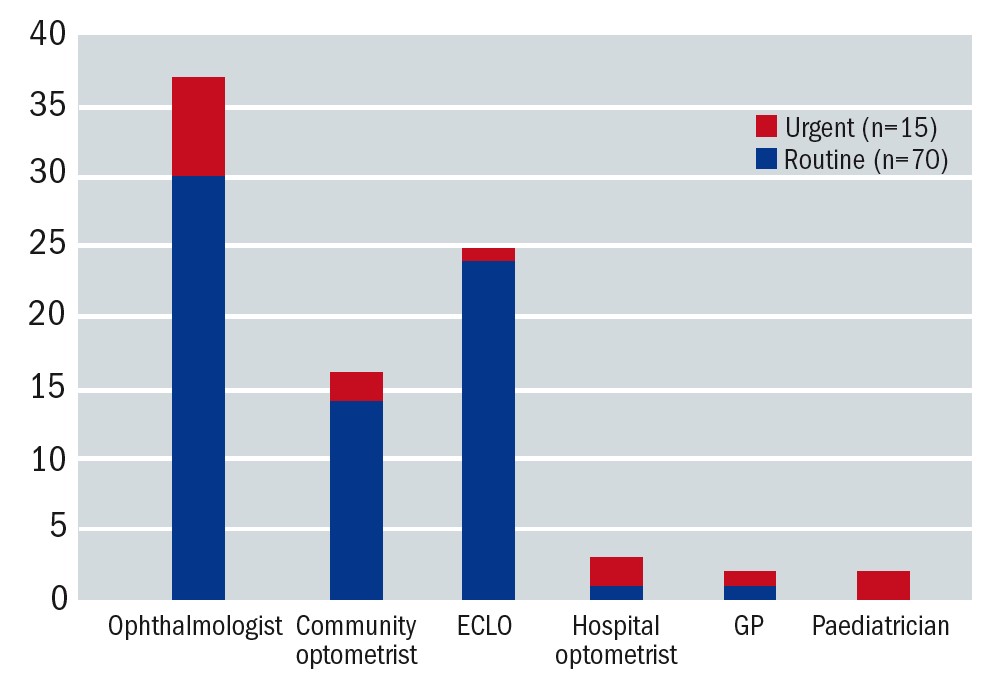 Figure 1: Referral sources of patients attending the LV service (August-November 2020). Referral sources are denoted on the x-axis. Routine referrals are represented in blue and urgent referrals (primarily children, young people and working adults) in red. The y-axis shows the number of referrals in each category
There were very few referrals from general practitioners. This could be due to the fact that, in Scotland, community optometrists are regarded as the first port of call for vision-related issues.1 However, one cannot assume that patients always seek advice from an optometrist. It has been reported that less than half of patients over 60 years of age attend regular GOS sight tests.2 Common reasons why this patient group fails to attend are a lack of understanding of the consequences of (further) sight loss, an assumption that sight loss is a natural consequence of ageing and apprehension about the commercial aspect of primary eye care.2 Patients do not always realise that functional vision can be improved even if the treatment options for their eye condition are limited. Therefore, educating patients about the importance of regular sight tests and the benefit of LV assessments continues to be a priority.
No other healthcare professionals were represented in the referral sources. It has been suggested that this may be related to a limited knowledge about VI associated with other health conditions, particularly neurological conditions such as stroke and dementia.2 In response to this, links with the stroke rehabilitation team, including occupational therapists, have been re-established and the stroke pathway is under review to include specialist LV optometrists. Furthermore, the author reached out to nursing homes to offer educational sessions about ageing and sight loss. This has already led to a substantial amount of relevant referrals into the LV service. Raising awareness about the referral route, referral criteria and the benefits of LV assessments are effective ways of reducing referral barriers.3
Who are the service users?
Demographics
Similar to other audits,4-7 the majority of patients were female (in our case 62%). It is thought this is related to the longer life span of females compared to males, rather than a difference in AMD prevalence between male and female per se.8 The ages ranged from eight to 102 years (mean ± SD 72.47 ± 21.98). The majority of patients were pensioners with 80% aged over 65 years and 51% aged over 80 years; 14% of patients were working age and a minority of 6% were under 16 years of age. This is a typical age distribution for a LV clinic.
Vision impairment registration
A third of patients were not eligible for registration, while 32% were registered for sight impairment (SI) and 29% for severe sight impairment (SSI). The children in this audit (6%) were registered with the Visual Impairment Network for Children and Young People (VINCYP). Early intervention is a key to success in a LV service9 and, therefore, it is important to remember that patients can be referred regardless of registration status or visual acuity.
Ethnicity
People from a black/minority ethnic group seemed to be under-represented in our audit (2.4%). Although only 4% of the Scottish population is from an ethnic minority background,10 it is reasonable to assume that one of the main cities may have a higher proportion of patients from this background. Furthermore, sight loss affects this group relatively more in conditions such as glaucoma and diabetic eye disease.11 Extra effort is required to reach out to this group.
Hearing impairment
Self-reported hearing impairment was only 38%, which is lower than expected. The RNID estimates that over 70% of people over 70 have hearing impairment.12 These statistics are probably based on minimum dB perceived, rather than self-reported hearing impairment and therefore direct comparisons cannot be made. Lindsay et al reported hearing impairment in 27.1% in patients attending a LV service in Northern Ireland.5 These statistics show that hearing impairment is a common co-morbidity in LV clinics and it is therefore important to assess this as part of an assessment. Dual sensory loss demands special adaptations and interventions and tends to have more impact on quality of life compared to VI alone.
Disease profile
Similar to services elsewhere,4-6 AMD was recorded as the commonest cause of sight loss, followed by glaucoma and diabetic retinopathy, neurological sight loss and retinal/vascular conditions (see figure 2 and 3). Just over a third of patients received ongoing treatment, primarily for AMD. This shows that LV assessments were treated as an integral part of management rather than a last resort. Although Charles Bonnet syndrome is known to be a common feature in patients with VI13 and affected 93% of those who were asked about it, it was not routinely assessed in our clinic. The emotional impact of Charles Bonnet Syndrome can be substantial14 and therefore it is recommended to include this in a LV assessment. Reassurance is often all that is required in terms of treatment.13
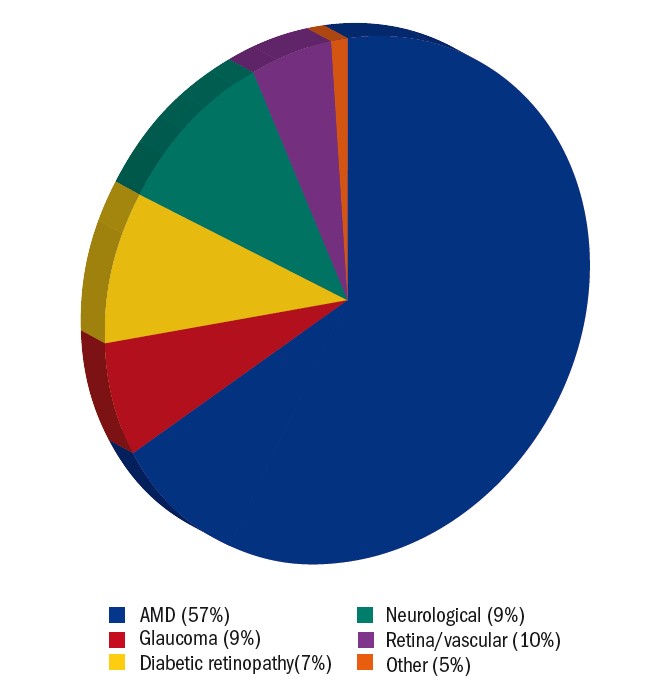 Figure 2: Pie chart showing the primary eye conditions encountered in hospital LV clinic. Neurological conditions include optic nerve (4%), acquired brain injury/stroke (3%), cerebral visual impairment (1%) and nystagmus (1%). Retinal and vascular conditions include macular dystrophy (4%), central retinal artery occlusion (2%), myopic degeneration (2%), retinitis pigmentosa (1%) and retinal detachment (1%). Other eye conditions include aphakia (2%), cornea (2%) and cataract (1%)
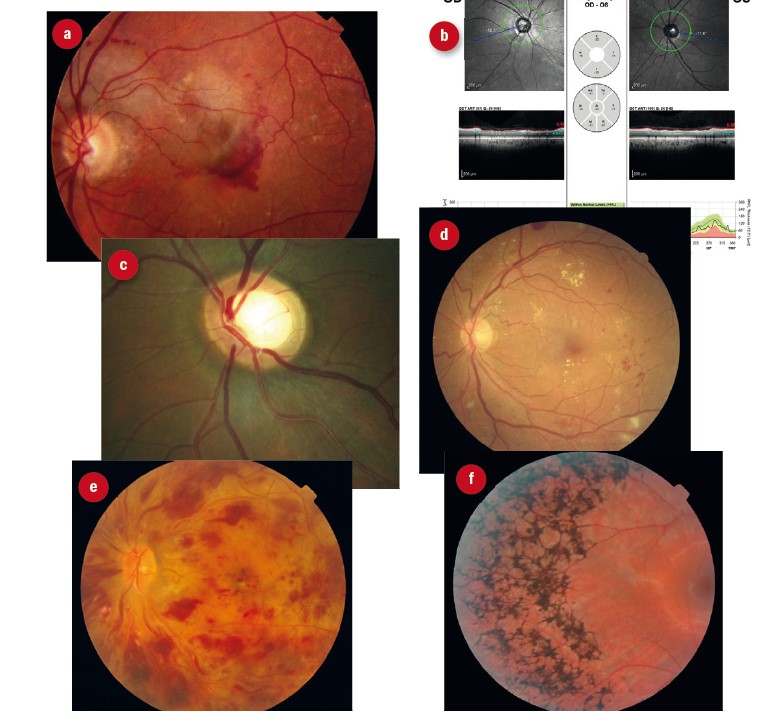 Figure 3: Primary eye conditions encountered in hospital LV clinic. (a) AMD; (b) optic nerve anomalies; (c) glaucoma; (d) diabetic retinopathy; (e) vascular disease; (f) retinitis pigmentosa
Self-reported safety and risks
The risk of falling is increased in people with VI.15 The most effective strategy for fall prevention is not entirely clear,16,17 although home safety programs and exercise programs are recommended by some.18-20 Twenty-two percent of patients in our audit reported difficulties with mobility.
A similar proportion (19%) reported safety problems in the kitchen. Difficulties with food preparation21 and reported cuts and burns15 are common issues. Kitchen gadgets and optimal lighting are possible interventions and a referral to social services is essential if safety is at risk.
The vast majority of patients attending the LV service (88%) fell below driving standards and although most of these patients were no longer driving, some needed to be advised to stop driving. Optometrists have a duty to address and document driving advice.22 A report by the GOC23 revealed that optometrists’ views and practices regarding vision and driving are not consistent. A person is considered to fall below driving standards with a vision equal or worse than 6/12 Snellen (0.30 LogMAR). With this level of vision, one would expect a discussion about whether the patient is driving and one would expect a record of advice being given.
What visual function values can be expected?
Distance and near vision
The audit showed that most patients (63%) attending the LV clinic had a LogMAR distance vision between 0.30 and 1.00 (6/12-6/60 Snellen). Fifteen percent had a vision of 0.30 or better and 22% had a vision of 1.00 or worse. Twenty-two percent of patients were able to read N8 with spectacles alone. This improved to 74% with an optical LVA (see figure 4). Audits in Wales6 and Northern Ireland5 showed similar results. There is potential for further improvement if electronic aids were offered as part of the service. Although these figures are a helpful guide, one needs to bear in mind that prescribing LVAs is not based on the ability to read N8, but rather on the specific functional requirements for each patient.
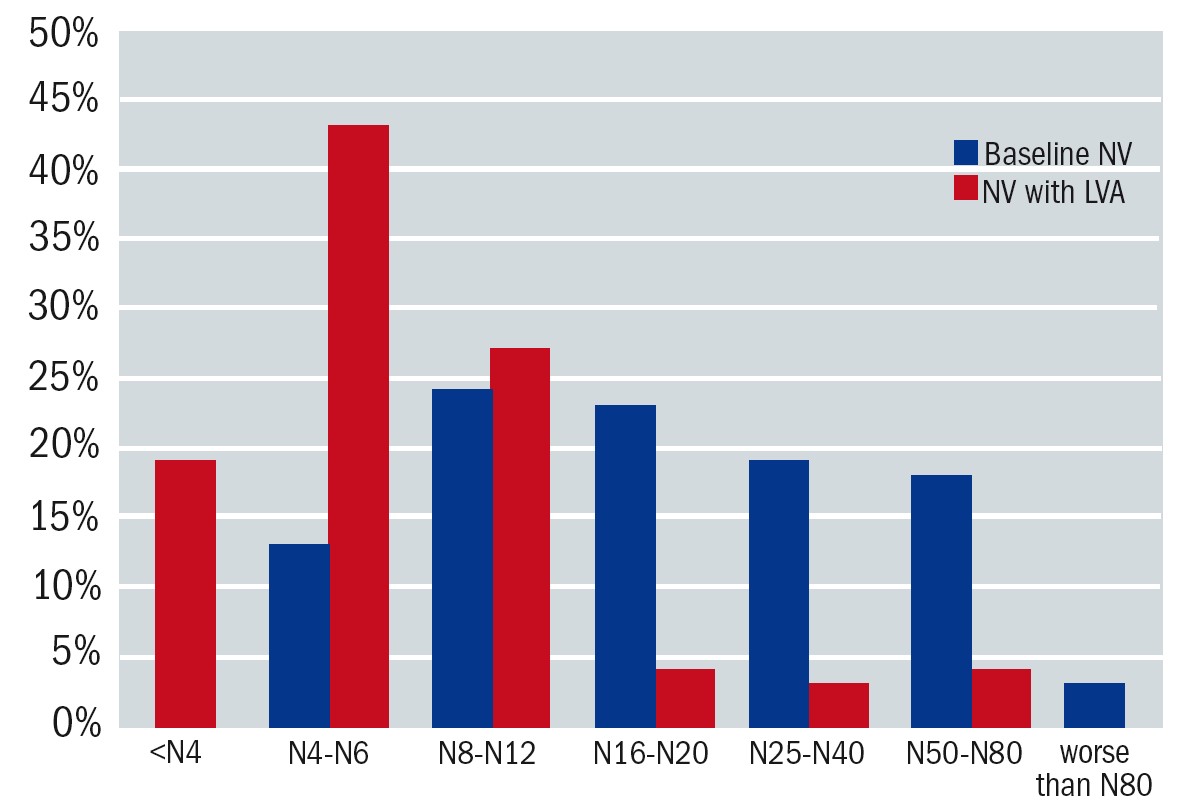 Figure 4: Near vision (NV) was documented in N-notation. The x-axis denotes the level of near vision. The y-axis shows the proportion of patients in each dataset. The blue bars indicate baseline near vision and the red bars indicate NV with the prescribed LVA. With spectacles alone the mean for near vision was 1.00±0.33 LogMAR (N20). With the low vision aid this improved to 0.54±0.29 LogMAR (N8)
Visual field
Visual fields were documented in nine case notes. Impairments included hemianopia, central scotoma and tunnel vision (figure 5). Various types of field impairment were noted, however, the sample size is too small to draw any conclusions about prevalence. Tsai et al reported a prevalence of 68.6%. Visual field defects are known to have an impact on mobility24-26 and should therefore be an integrated part of a LV assessment. Patients with visual field impairment could benefit from scanning techniques.27
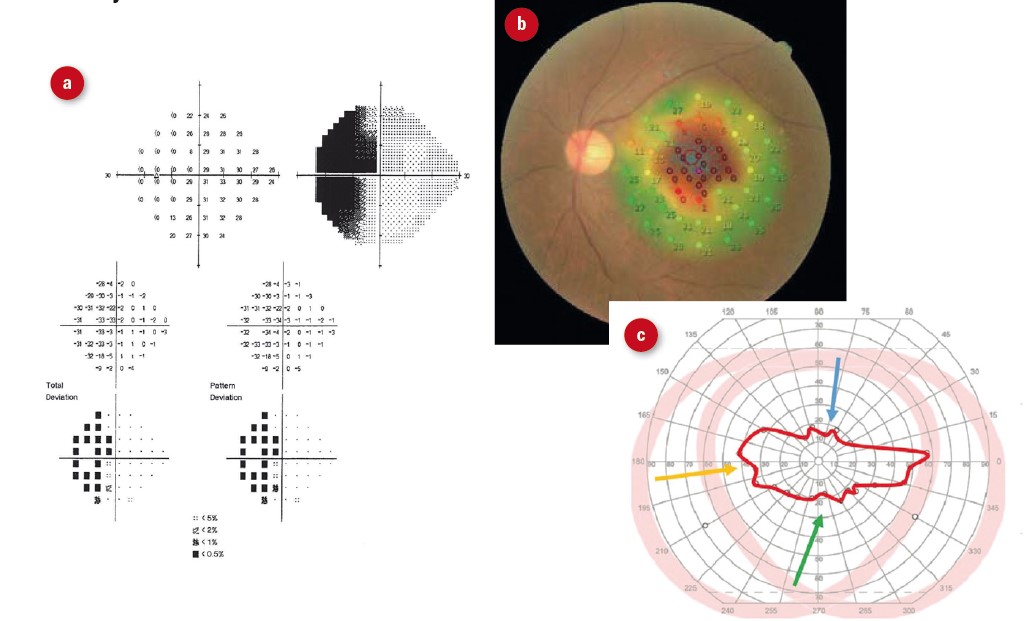 Figure 5: Visual field defects encountered in low vision clinic. (a) hemianopia; (b) central scotoma; (c) severely constricted field
Contrast sensitivity
Mars contrast sensitivity was documented in 28% (n=25) of patients (figure 6). Figure 7 provides an overview of contrast sensitivity measures. Only 8% of LV patients had normal contrast sensitivity with severe loss in 20% of patients and significant contrast sensitivity impairment in 40% of patients. Tsai et al reported 33.2% of patients had contrast sensitivity loss in their LV clinic in Taiwan (cut-off value not specified).7 Reduced contrast sensitivity can be a stronger predictor for experiencing poor vision compared to visual acuity and visual field impairment.28-31 Reduced contrast sensitivity impacts upon mobility,32,33 reading,34,35 face recognition36 and driving.37,38 When the effect of impaired contrast sensitivity is understood, the patient and practitioner can work together to develop suitable adaptations and strategies.
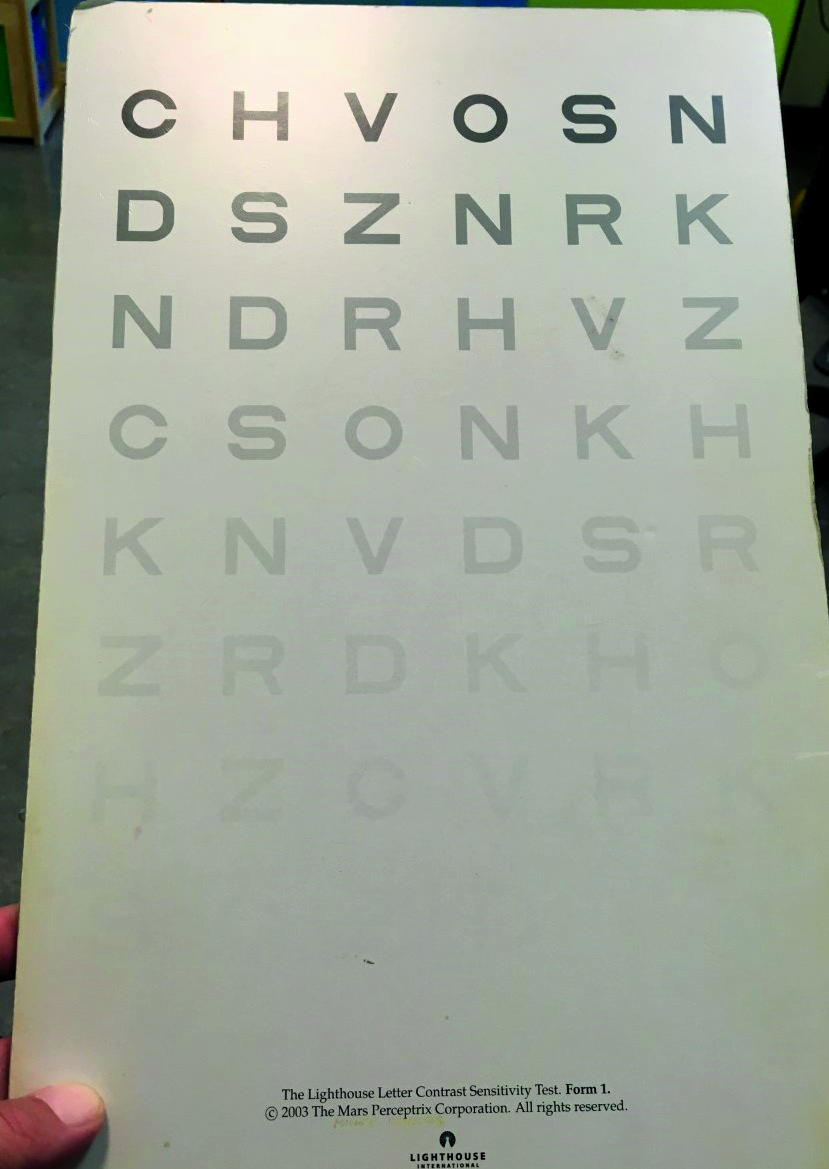 Figure 6: MARS contrast sensitivity test chart
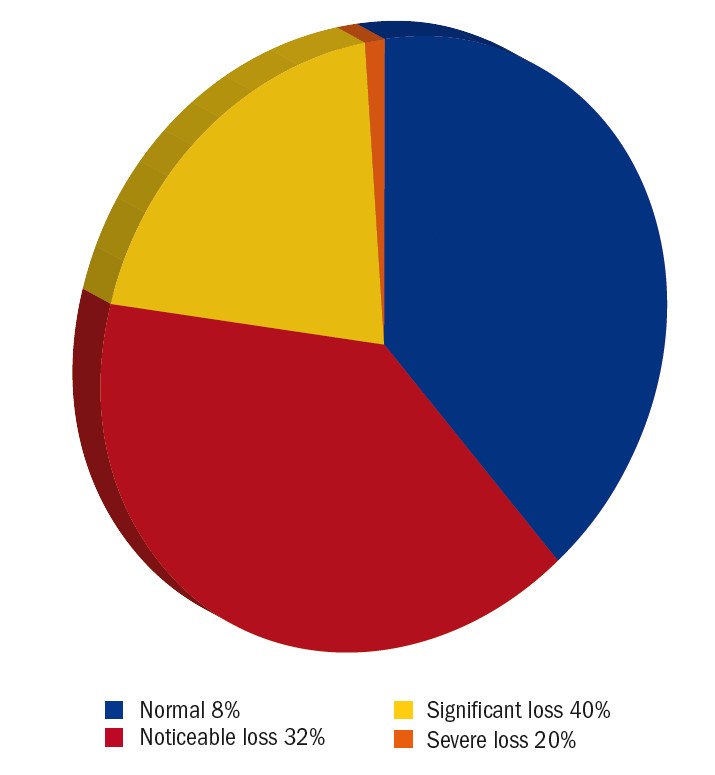 Figure 7: Pie chart showing the level of contrast sensitivity impairment for the patients for whom this was documented during the audit period. Criteria: Normal= 0.5-1.4%, noticeable loss=1.9-5.6%, significant loss=7.8-22% and severe loss=31-99%
Colour vision
Colour vision impairment was only recorded in a handful of case-notes and is thought to be relatively prevalent among patients with a VI. Tsai et al reported a prevalence of 17.3% in a low vision clinic.7 Impaired colour vision can lead to functional impairment.39 It is possible to make adaptations in order to improve functioning in many cases and, therefore, this test should be considered in a LV assessment.40
Magnifiers issued
The most popular magnifier was the illuminated hand magnifier (32%). Almost half of the patients receiving an illuminated hand-magnifier also received a stand to have a hands-free option. Spectacle magnifiers, including Max-TV and Max-Detail, were prescribed in 16%. Figures 8 and 9 provides an overview of all the LV aids that were issued during the audit period. The majority of LV aids for near were 3-4x magnification (44%), followed by 5-6x (36%) and >6x (18%).
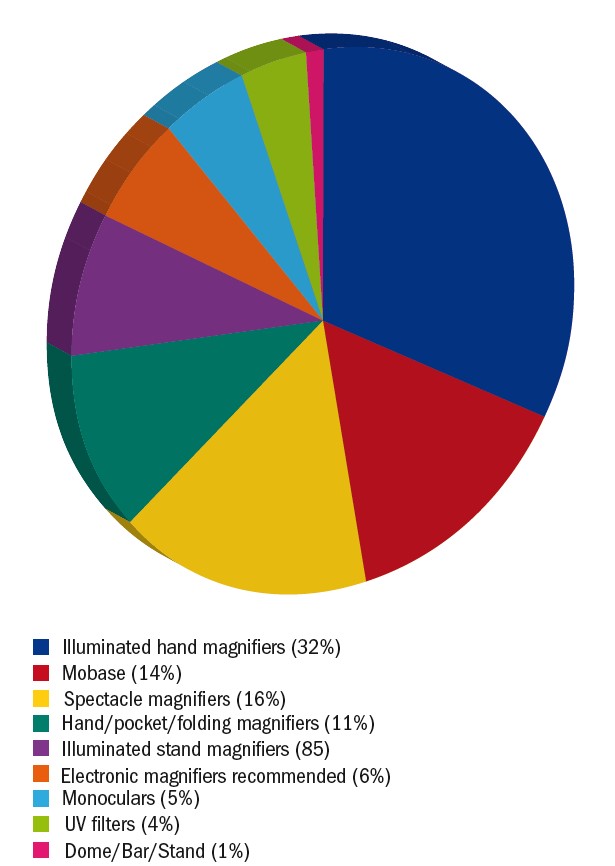 Figure 8: Pie chart illustrating the low vision aids dispensed in the LV clinic. Spectacle magnifiers include hyperoculars, spectacle-mounted telescopes, Max TV (Eschenbach) and Max Detail (Eschenbach)
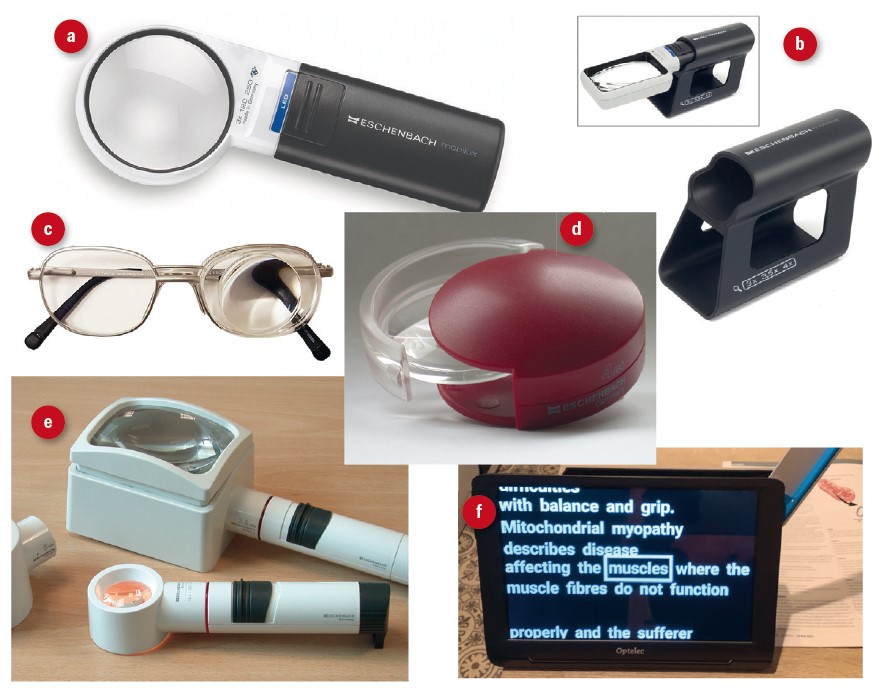 Figure 9: Magnifiers issued by low vision clinic. (a) illuminated hand magnifier; (b) Mobase stand; (c) spectacle magnifier; (d) folding pocket magnifier; (e) illuminated stand magnifiers; (f) electronic magnifier
The range of magnifiers dispensed is in keeping with practice elsewhere in Scotland.41 Similar to other studies,4,6,42 spectacle-mounted aids, monoculars, non-illuminated hand and stand-magnifiers, pocket magnifiers, domes and bar-magnifiers were issued to fewer patients. Crossland and Silver described a changing trend in prescribing habits in an urban LV clinic between 1973 and 2003.43 This showed that there was an increase in prescribing of illuminated hand and stand magnifiers as well as bright field magnifiers, while the proportion of spectacle-mounted aids was decreasing. Prescribing habits are likely to change with the introduction of more affordable electronic aids and assistive technology.
Conclusion
In summary, community optometrists play an important part in educating patients about the benefit of sight tests and LV assessments. Other healthcare professionals also benefit from raising awareness of referral pathways and patient benefits. LV assessments are available for all ages and for ocular as well as neurological VI, regardless of visual acuity or registration status.
Dual sensory impairment is common and special care needs to be taken to take hearing loss into account when assessing and managing LV patients. Charles Bonnet syndrome is another important element that should not be overlooked. Risk assessment for falls, kitchen safety and driving is essential to protect patients from harm. In terms of visual function tests, distance and near acuity are important as a guide for prescribing LVAs and measuring the benefit of interventions. However, one can create a more complete picture of the patient’s functioning when visual fields, contrast sensitivity and colour vision are also assessed as these parameters contribute significantly to the ability to perform tasks.
More than three quarters of the patients received a magnifier with a magnification of 6x or less with most of them reading N8 or better with the LVA. Higher magnification levels tend to slow down reading speed too much for fluent reading tasks. The most popular magnifier was the illuminated hand magnifier with or without the stand. In some regions electronic reading devices are offered as part of the LV service and it would be interesting to see how that influences the uptake of optical aids.
- Cirta Tooth is a specialist low vision optometrist, working for a private practice and for the hospital eye service.
Disclosure
This audit was approved by QIT at the Princess Alexandra Eye Pavilion, Edinburgh.
References
- Optometry Scotland. 2021. First port of call. [Online] Available at: https://www.optometryscotland.org.uk/patients/805-2/ [Accessed 22 March 2021].
- Rotheroe A, Bagwell S and Joy I. 2013. In sight: A review of the visual impairment sector. [Online]. Available at: https://www.clothworkersfoundation.org.uk/media/1080/in-sight-report-final-2.pdf [Accessed 1 April 2021].
- Luu W, Kalloniatis M, Bartley E et al. 2020. A holistic model of low vision care for improving vision-related quality of life. Clinical and Experimental Optometry 103(6), pp.733-741.
- Chong MFA, Cho HHI, Jackson AJ et al. 2018. Profile of the Australian College of Optometry low vision clinic. Clinical and Experimental Optometry 101, pp.793-798.
- Lindsay J Bickerstaff D, McGlade A et al. 2004. Low vision service delivery: an audit of newly developed outreach clinics in Northern Ireland. Ophthalmic and Physiological Optics 24, pp.360-368.
- Margrain TH. 2000. Helping blind and partially sighted people to read: the effectiveness of low vision aids. British Journal of Ophthalmology 84(8), pp.919-921.
- Tsai L, Hsieh H, Chen P et al. 2020. Relationship between refractive correction, visual symptoms and optical device selection for low vision patients in Taiwan. Journal of Optometry 13(4), pp.249-256.
- Mohammed MA, Alqarni AY, Hammed ARA et al. 2021. Age and gender risk factors for macular degeneration: A systematic review and meta-analysis. Annals of Medical and Health Sciences Research 11(1), pp.1188-1192.
- NHS. 2007. Recommended Standards for Low Vision Services: Outcomes from the Low Vision Working Group, commissioned by the Eye Care Services Steering Group. [Online] Available at: http://www.eyecare.nhs.uk/evaluationdoc.aspx [Accessed 3 August 2021].
- Scotland’s Census. 2021. Ethnicity. [Online] Available at: https://www.scotlandscensus.gov.uk/census-results/at-a-glance/ethnicity/[Accessed on 21 Jun 2021]
- RNIB. 2018. Eye health and sight loss stats and facts. [Online] Available at: https://www.rnib.org.uk/sites/default/files/Eye%20health%20and%20sight%20loss%20stats%20and%20facts.pdf [Accessed on 24 Jun 2021]
- RNID (Royal national Institute for Deaf People). [no date]. Facts and figures.[Online] Available at: https://rnid.org.uk/about-us/research-and-policy/facts-and-figures [Accessed on 24 Jun 2021]
- Schadlu AP, Schadlu R and Banks Shepherd J. 2009. Charles Bonnet Syndrome: A review. Current Opinion in Ophthalmology 20(3), pp.219-222.
- Menon GJ, Rahman I, Menon SJ et al. 2003. Complex visual hallucinations in the visually impaired: The Charles Bonnet Syndrome. Survey of Ophthalmology 48(1), pp.58-72.
- Wood JM, Lacherez P, Black AA et al. 2011. Risk of falls, and other injuries resulting from visual impairment among older adults with age-related macular degeneration. Investigative Ophthalmology and Visual Science 52, pp.5088-5092.
- Blaylock SE and Vogtle LK. 2017. Falls prevention interventions for older adults with low vision: A scoping review. Canadian Journal of Occupational Therapy 84(3), pp.139-147.
- Dillon L, Clemson L, Ramulu P et al. 2018. A systematic review and meta-analysis of exercise-based falls prevention strategies in adults aged 50+ years with visual impairment. Ophthalmic and Physiological Optics 38(4), pp.456-467.
- Campbell AJ, Robertson MC, La Grow SJ et al. 2005. Randomised controlled trial of prevention of falls in people aged ≥ 75 with severe visual impairment: The VIP trial. British Medical Journal 331 (7520), pp.817-820.
- La Grow SJ, Robertson MC, Campbell AJ et al. 2006. Reducing hazard related falls in people 75 years and older with significant visual impairment: How did a successful program work? Injury Prevention 12(5), pp. 296-301.
- Rodrigues IB, Ponzano M and Giangregorio LM. 2019. Practical tips for prescribing exercise for fall prevention. Osteoporosis International 30(10), pp.1953-1960.
- Kostyra E, Zakowska-Biemans S, Sniegoeka K et al. 2017. Food shopping, sensory determinants of food choice and meal preparation by visually impaired people. Obstacles and expectations in daily food experiences. Appetite 113, pp.14-22.
- The College of Optometrists. 2021. If you think a patient is unfit to drive. [Online] Available at: https://guidance.college-optometrists.org/guidance-contents/knowledge-skills-and-performance-domain/examining-patients-who-drive/if-you-think-a-patient-is-unfit-to-drive/ [Accessed June 2021].
- GOC (The General Optical Council). 2017. Vision and driving: Final report. [Online] Available at: http://www.optical.org [Accessed 22 October 2020].
- Miyasike-daSilva V, Singer JC and McIlroy WE (2019). A role for the lower visual field information in stair climbing. Gait and Posture, 70, pp.162-167.
- Peli E, Apfelbaum H, Berson EL et al. (2016). The risk of pedestrian collisions with peripheral field loss. Journal of Vision 16(5). Article Number 5.
- Subhi Y, Schmidt DC, Bach-Holm D et al. (2020). Prevalence of Charles Bonnet syndrome in patients with glaucoma: a systematic review with meta-analysis. Acta Ophthalmologica 99(2):128-133.
- De Haan GA, Melis-Donkers BJM, Brouwer WH et al. (2015). The effects of compensatory scanning training on mobility in patients with homonymous visual field defects:a randomized controlled trial. Plos One 10(8). Article Number e0134459.
- Alahmadi BO, Omari AA, Abalem MF et al. (2018). Contrast sensitivity deficits in patients with mutation-proven inherited retinal degenerations. BMC Ophthalmology 18. Article Number 313.
- Bennett CR, Bex PJ, Bauer CM et al. (2019). The assessment of visual function and functional vision. Seminars in Pediatric Neurology 31(SI), pp.30-40.
- Havstam Johansson L, Skiljic D, Falk Erhag H et al. (2020). Vision-related quality of life and visual function in a 70-year-old Swedish population. Acta Ophthalmologica 98(5), pp.521-529.
- Roh M, Selivanova A, Shin HJ et al. (2018). Visual acuity and contrast sensitivity are two important factors affecting vision-related quality of life in advanced age-related macular degeneration. Plos One 13(5). Article Number e196-481.
- Duggan E, Donoghue O, Kenny RA et al. (2017). Time to refocus assessment of vision in older adults? Contrast sensitivity but not visual acuity is associated with gait in older adults. Journals of Gerontology Series A - Biological Sciences and Medical Sciences 72(12),pp.1663-1668.
- Leat SJ and Lovie-Kitchin JE. (2008). Visual function, visual attention, and mobility performance in low vision. Optometry and Vision Science 85(11), pp.1049-1056.
- Brussee T, van den Berg TJTP, van Nispen RMA et al. (2018). Association between contrast sensitivity and reading with macular pathology. Optometry and Vision Science 95(3), pp.183-192.
- Leat SJ and Woodhouse JM. (1993). Reading preformance with low vision aids- relationship with contrast sensitivity. Ophthalmic and Physiological Optics 13(1), pp.9-16.
- McCulloch DL, Loffler G, Colquhoun K et al. (2011). The effects of visual degradation on face discrimination. Ophthalmic and Physiological Optics 31(3), pp.240-248.
- Owsley C, Stalvey BT, Wells J et al. (2001). Visual risk factors for crash involvement in older drivers with cataract. Archives of Ophthalmology 119(6), pp.881-887.
- Spreng L, Favrat B, Borrnat F et al. (2018). Cross-sectional study assessing the addition of contrast sensitivity to visual acuity when testing for fitness to drive. British Medical Journal Open 8(1). Article Number e018546.
- Stoianov M, Silva de Oliveira S, Lobato dos Santos Ribeiro Silva et al. (2018). The impacts of abnormal color vision on people’s life: an integrative review. Quality of Life Research 28(4), pp.855-862.
- Thomas PBM, Nesaratnam NMB, Chaudhuri-Vayalambrone PBA et al. (2019). Color vision deficiency among doctors: can we make useful adaptationsto the color codes used in the clinical environment? Journal of Patient Safety 00(00). [Online ahead of print]. Available at: Color Vision Deficiency Among Doctors: Can We Make Useful Adaptations to the Color Codes Used in the Clinical Environment? - PubMed (nih.gov) https://doi.org/10.1097/PTS.0000000000000611 [Accessed 15th January 2021].
- Court H and Mitchell G. 2017. A review of Low Vision service provision in Scotland. Scottish Government. [Online].Available at: https://www.gov.scot/publications/review-low-vision-service-provision-scotland/[Accessed 1 April 2021].
- McCormick E. 2017. Low vision prescribing. Optometry Today. [Online] Available at: https://www.aop.org.uk/ot/professional-support/clinical-and-regulatory/2017/10/02/low-vision-prescribing-habits [Accessed on 23 Jun 2021]
- Crossland MD and Silver JH. 2005. Thirty years in an urban low vision clinic: Changes in prescribing habits of low vision practitioners. Optometry and Vision Science 82(7), pp.617-622.