According to the latest available data from the Department for Transport, 75% of all adults over the age of 17 hold a full driving licence.1 In 2022, the average person made around 500 trips in either a van or a car2 with the majority being for leisure or shopping.3
For many, driving is an essential part of everyday life, and it is likely that many of the patients we see have a driver’s licence. This article outlines the limitations in current visual assessment methods and introduces additional tests that could prove vital in ensuring a patient’s fitness to drive.
Global Variance
Visual requirements for obtaining a driver’s licence vary worldwide, a 2023 paper4 analysing visual functions, seatbelt usage, speed and alcohol consumption standards of 71 countries and 50 states found that those with vision related standards assess one or more of the following:
- Minimum visual acuity
- Minimum visual field
- Monocular vision
- Colour vision
- Depth perception
- Night vision
- Licence plate recognition
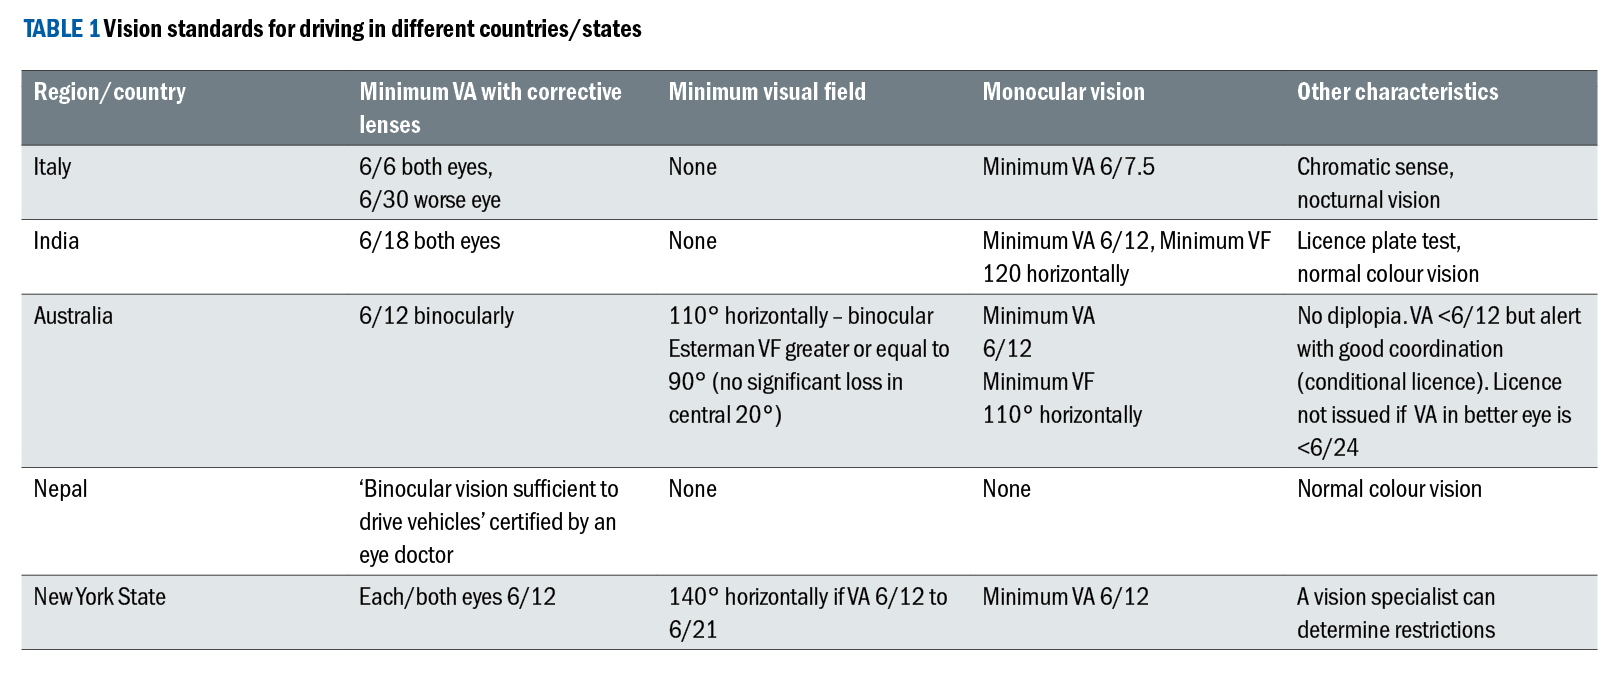
Examples of the requirements by country are shown in table 1 where it can be seen there is a wide variance. In the EU, states must adhere to regulations set down by the European Parliament (Commission Directive 2009/113/EC) yet there are still significant differences between the regulations laid down by each member.
As part of Vision Zero (the EU framework to reach zero deaths on EU roads by 20505) the European Commission has proposed several revisions to the directive, including enabling 16-year-olds to drive speed-limited cars, introducing compulsory medical examinations for anyone taking a test or renewing their licence.
This reduces the validity of licences for those over the age of 60 forcing more regular renewals and therefore assessments of capability. In December 2023, members of the committee voted to adopt these changes however, at the plenary session and subsequent vote it was agreed that member states should set their own regulations on the requirement for medical examinations.6
Elsewhere, the state of New York is an interesting case as drivers who meet the minimum requirements of 6/12 in one or both eyes are required to see a medical professional (the list includes ophthalmologists, optometrists and opticians) who complete and submit a vision test report.7 If corrective lenses were worn to meet the standard, the licence will carry restriction code B highlighting this to law enforcement.8
In the case of the applicant not meeting the visual standards but meeting the visual fields standards detailed in table 1 or if telescopic lenses are worn, a different report must be submitted to the medical review unit.7 In this case, practitioners are asked to indicate whether the applicant should be restricted to day driving only, require a full view mirror, or be banned from driving on limited access roads.
While the concept of restricted licences in terms of when someone can drive has not been adopted in the UK (although in Northern Ireland, new drivers are required to display ‘R’ plates for the first year following their test and are restricted to driving at speeds no greater than 45mph8), there are a number of US states that utilise such a system9 in an effort to enable those with mild impairments to retain their licence.
With driving being a lifeline for many, it is important that vision standards are adequate to ensure the safety of drivers and other road users without excluding those whose vision may be impaired while their driving ability is not.
UK Vision Standards
Acuity and the number plate test
In 2002, an additional element to the driving theory test was introduced by the Driver and Vehicle Standards Agency (DVSA) to test the effectiveness of an applicant’s ability to recognise hazards.10 The hazard perception test requires the subject to view 14 video clips and correctly identify all the potential hazards that should influence their driving behaviour.11 Of the 75 points available, 44 are required to pass with the DVSA quoting an average pass rate of 85%.12
The practical driving test also includes a visual element in the form of an eyesight check performed on a number plate at a specific distance. For new style number plates (after September 2001) the test is performed at 20m, for the old-style number plate the distance is 20.5m.12,13
The guidance for driving examiners requires the test to be performed in ‘good daylight’ using a clean number plate that can be clearly viewed and at a distance ‘obviously more than 20 metres’.14 If unsuccessful, the candidate will be asked to read a different number plate and is allowed to walk forward to just over the 20m distance if necessary.
If a third attempt is required, the examiner is then required to physically measure 20m for a final test, if this is not read correctly the candidate will be marked as a failure and the test ends.
As part of the driving eyesight rules15 provision is also made for visual acuity with car drivers required to meet a minimum standard of 6/12 binocularly measured on the Snellen chart. Unfortunately, this does not correlate well with the number plate test, which is easily shown with Pythagoras’ theorem (figure 1).
Figure 1: The relationship between the height of a Snellen optotype and the height of the characters on a new style number plate in the Charles Wright font

The standard font for new style number plates is Charles Wright Bold and the specification on character height for cars is 79mm.14 We therefore have the values for D and V as shown in the diagram.
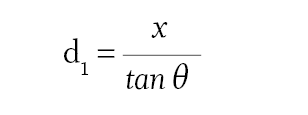
As the angle remains constant for both X and V, we can deduce that:
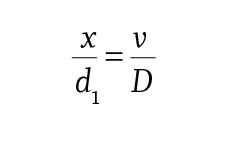
Rearranging the formula leads to:
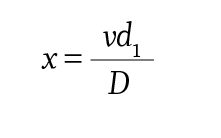
The number plate test is performed at 20 metres (D) and the letter height is 79mm (V), we are interested in the equivalent letter height at 6m in order to compare with Snellen which results in X = 0.0237m or 2.37cm.
To calculate visual acuity, we use the formula:16
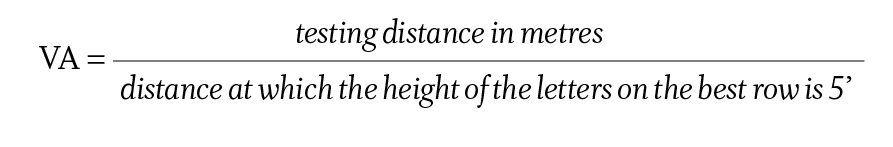
For a letter height of 2.37cm and a value for θ of 5’, we can calculate the distance required as follows:
Converting 5 arc minutes to degrees by multiplying it by 60, we have:
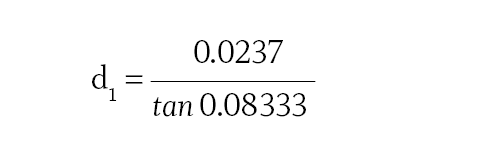
This gives the figure of 16.2999, which is the distance, in metres that a letter 2.37cm in height would have to be positioned to subtend 5 minutes of arc. In other words, the new style number plate is more similar to an acuity of 6/15 than 6/12. It is therefore possible to pass the number plate tests without meeting the legally required visual acuity standards.
This has been demonstrated in research17-19 with one study21 finding that nine participants passed the number plate test but failed to achieve 6/12 Snellen acuity. These participants were described as having vision (ie uncorrected acuity) that fell in the ‘overlap’ zone of 6/9 and 6/36 where it was uncertain if they would be able to read a number plate at 20m.
This study also assessed the participants vision using a logMAR chart utilising Landolt rings, in this case 2% of those in the overlap zone (+0.30 and +0.98 logMAR) could achieve +0.30 (6/12 equivalent) but were unable to read a number plate at 20m in good daylight.
Visual acuity is a measure of the ability to see fine details and for tests that utilise a system like Snellen, it is a measure of static acuity, that is to say when two or more targets are stationary.20 Static acuity, while useful has limitations when assessing suitability to drive as there is a noticeable reduction in the ability to resolve fine detail when either the target or the observer is moving.23
With regard to the legal standards of vision in the UK for drivers of class 1 vehicles, the research clearly shows it is possible that a driver may achieve 6/9 in the test room and be advised they meet the legal requirements yet fail the number plate test. In this case, should the police perform a roadside check, their licence would be revoked.
Practitioners should take care to advise those who meet the acuity standards that they still need to ensure they can meet the number plate standard as they are not always mutually inclusive. The research in this area highlights the importance of this for those in the 6/9 and 6/12 range yet it would be good practice to include this advice for all driving patients.
Visual Fields
The standards of vision for those driving cars and motorcycles also gives guidance on field of vision requirements,17 stating:
“To meet the standard for your field of vision, you must be able to see within a specific area without there being significant problems in the field of vision.”
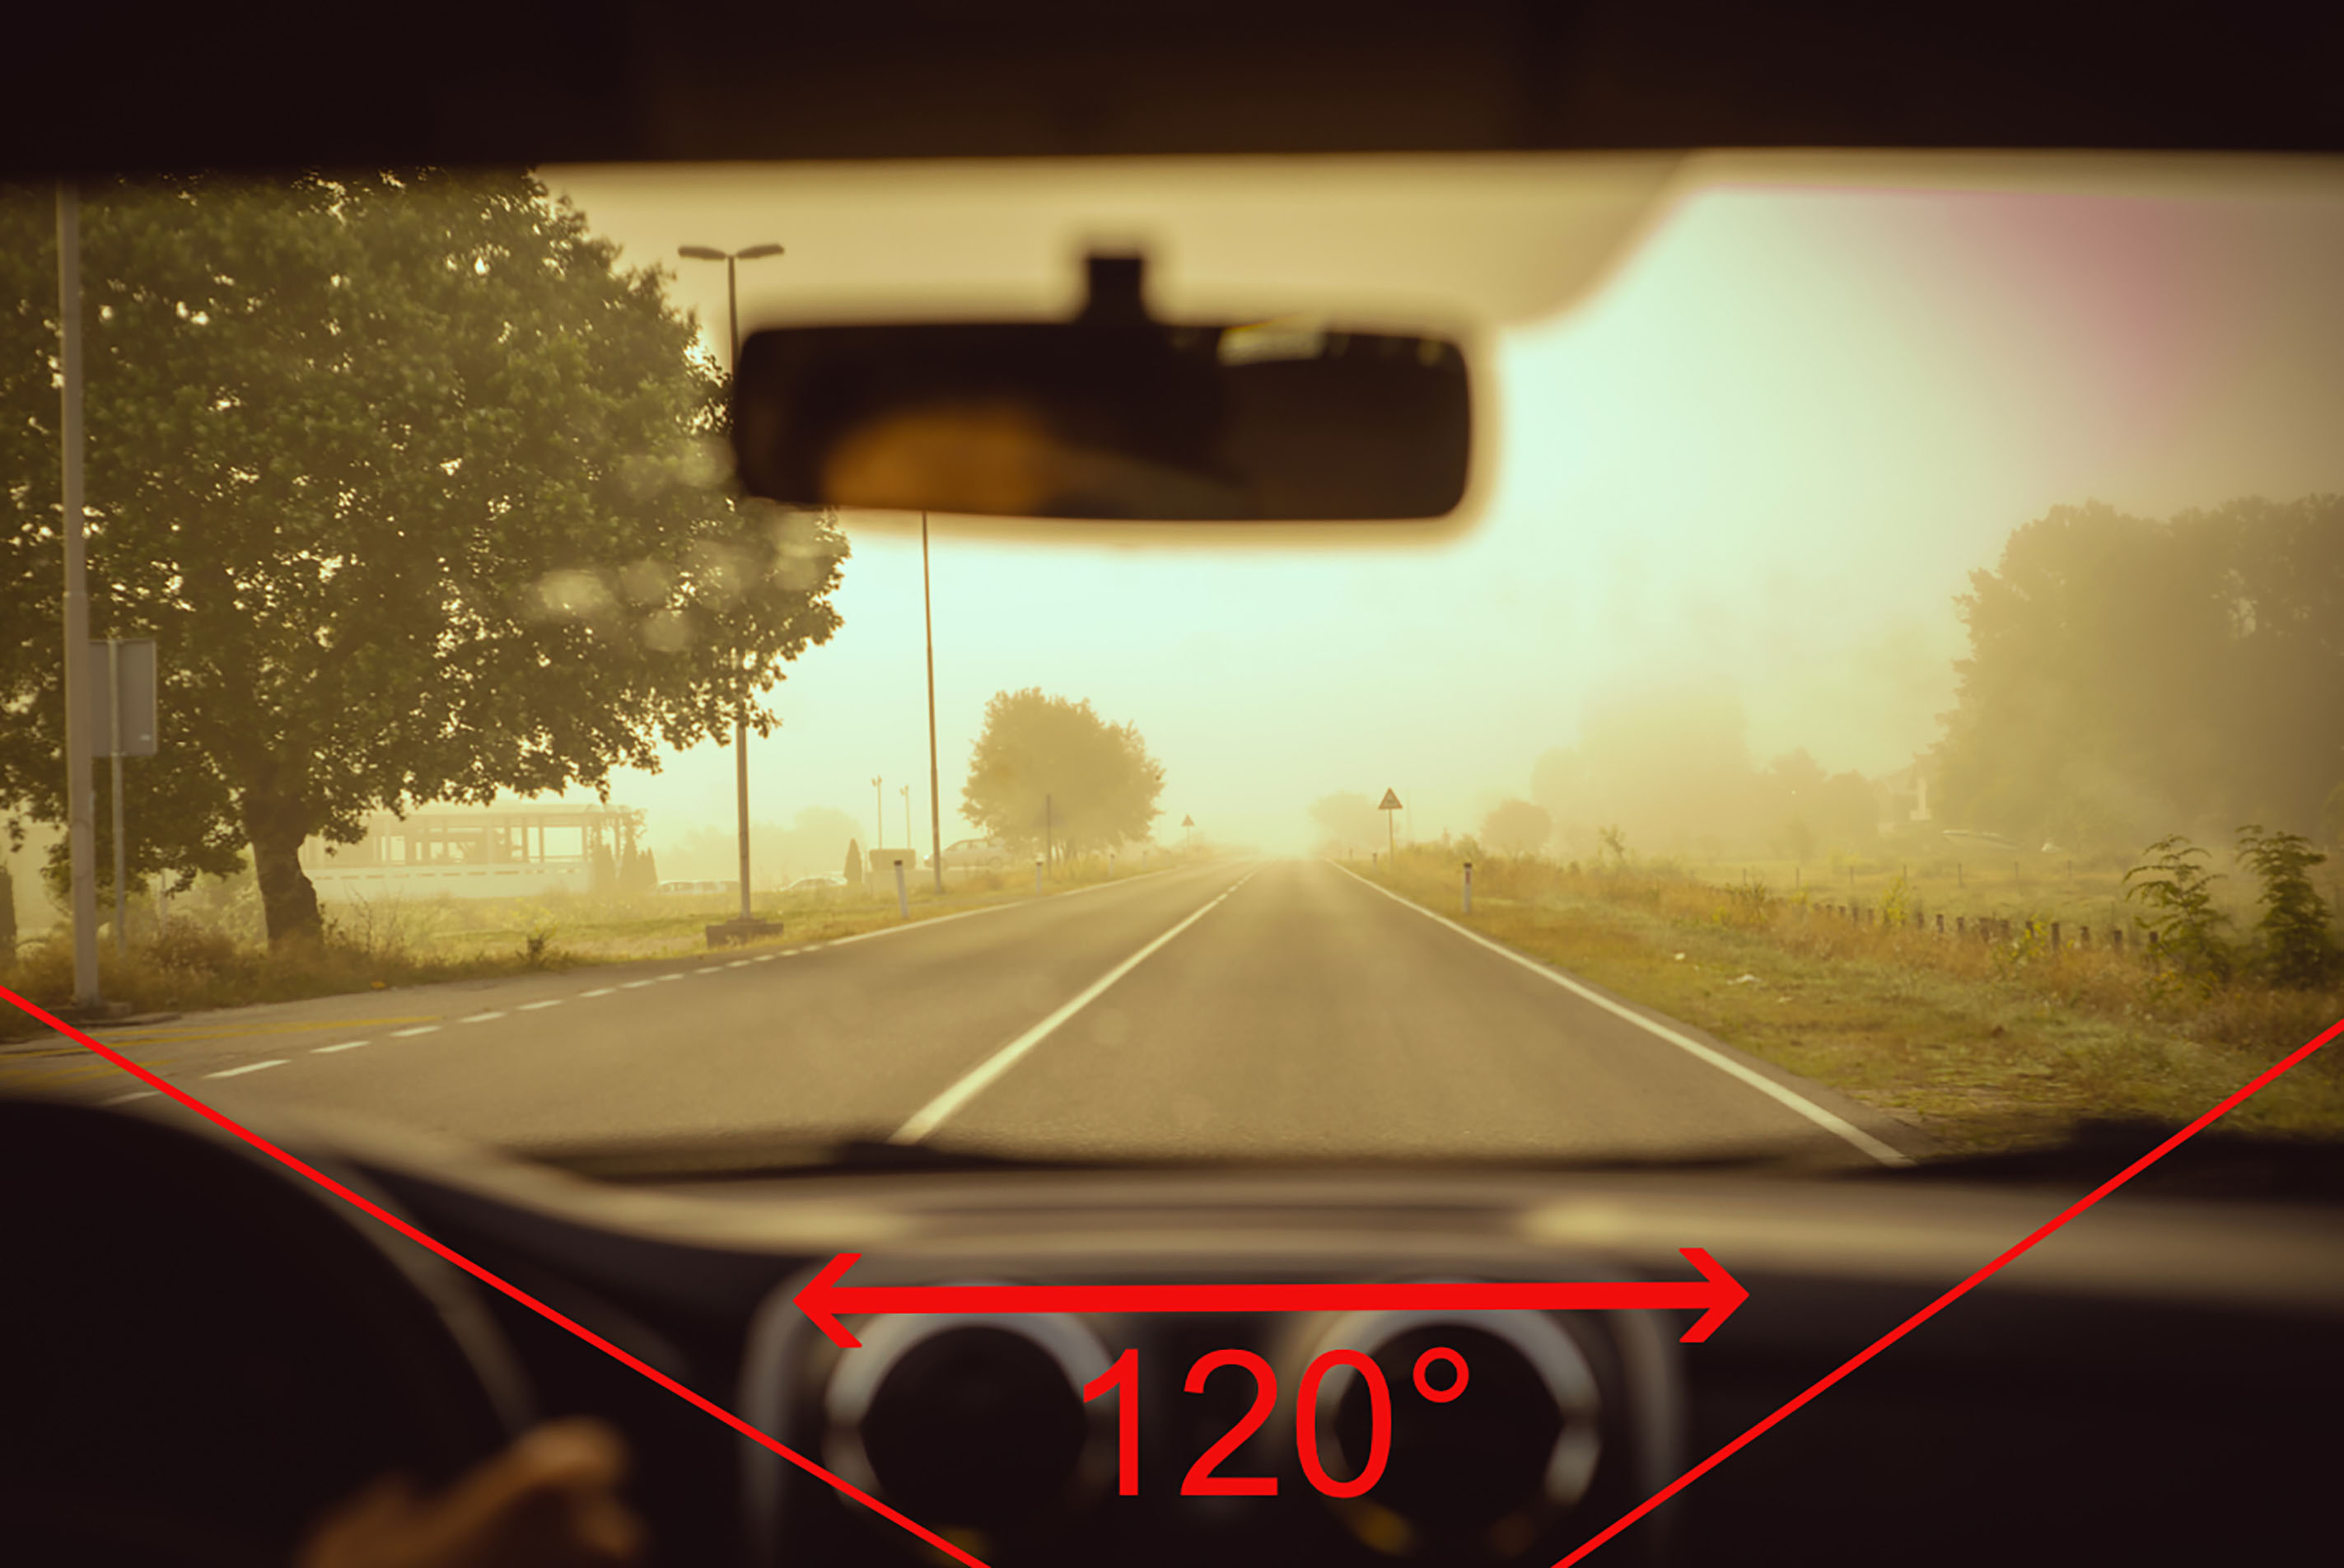
The advice for medical professionals gives a detailed description of the standards expected for group 1 drivers who require a visual field test result of at least 120° horizontally, with a minimum extension of 50° left and right, measured with a target equivalent to the white Goldmann III4e settings.21 There should be no significant defect that encroaches within 20° of the fixation above or below the horizontal meridian.
The guidance also advises that homonymous or bitemporal defects that are close to fixation will usually not meet the required standards, regardless of whether they are hemianopic or quadrantanopic. Drivers with visual field defects have been shown to exhibit driving behaviours which would be deemed unsafe, ranging from poor vehicle control skills, poor reaction speed to unexpected events, unstable lane positioning and more sudden braking, for example.22-24
However, it has also been demonstrated that visual field loss that would lead to licence revocation does not always result in poor driving ability. In one study, a certified driving rehabilitation specialist analysed the driving skills of participants with hemianopia and quadrantanopia who did not meet licensing requirements and found that 73% of those with hemianopia and 88% of those with quadrantanopia were categorised as safe to drive.25
Similar to visual acuity used to determine a person’s ability to drive, the visual field testing method is performed under static conditions. However, the peripheral field when driving reduces as the speed increases.26,27 A driver with 120° horizontal field at 30kmph (approximately 18mph) will see a reduction in usable field to 80° when driving at 50kmph (approximately 30mph)28 (figure 2a & b).
Figure 2A: Field of view when travelling at approximately 30mph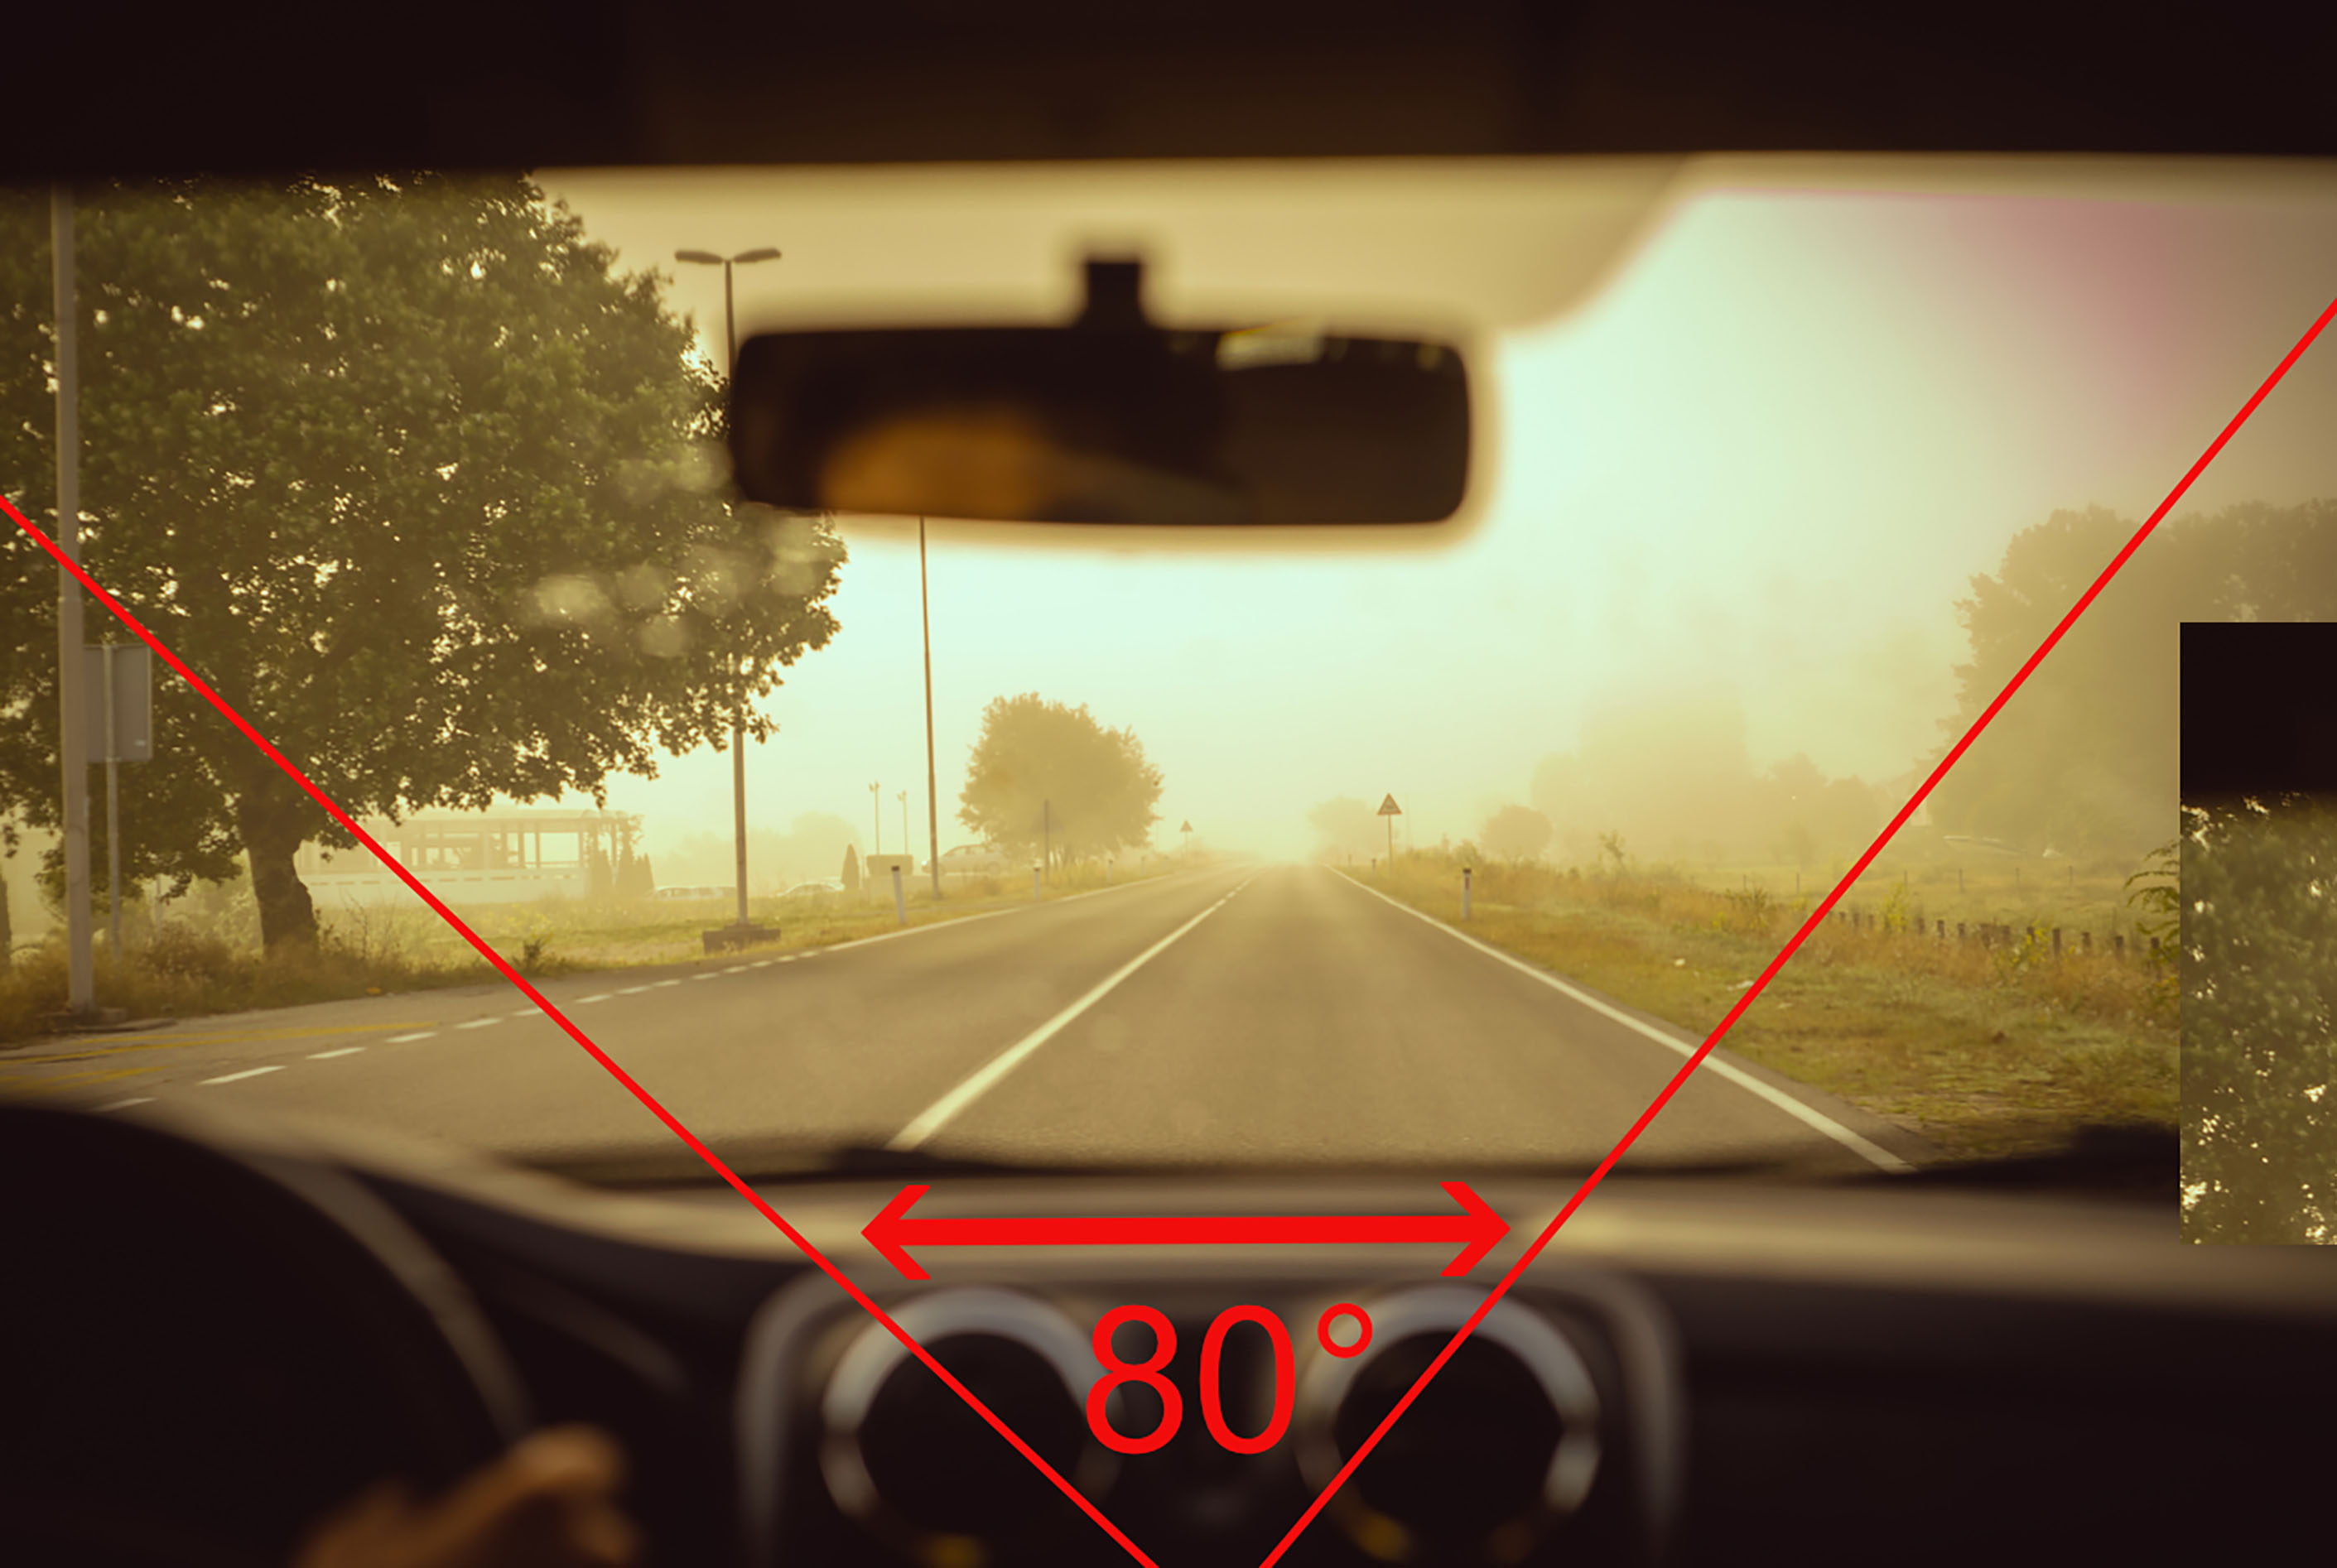
Figure 2B: Field of view when travelling at approximately 18mph
The field of view when driving varies, not only with speed but also with how fatigued the driver is and the type of driving they are doing, with monotonous driving sometimes leading to a tunnel vision effect particularly in older drivers.27,28 There are, therefore, conditions where a driver would meet the standards relating to adequate field of view but, due to other variables have times where they would be deemed at higher risk of an adverse event.
Vision and Driving
The reasons for the variation in visual requirements for driving worldwide are apparent when considering the challenges with the UK standards whose purpose is to improve safety and reduce adverse incidents. The role of vision in driving has been well researched leading to a clearer picture of how measures like visual acuity and visual fields (as well as others) impact safety and performance.
In most of the countries listed in table 1, a defined measure of static visual acuity is required to legally drive. This may seem perfectly reasonable – there should be a well-defined threshold beyond which a person would be unsafe to drive – the problem is with using static visual acuity as the measure.
Driving research that looks at accident data (eg frequency and causation) usually breaks down the data into two categories – driver safety and driver performance.29 Driver safety concerns adverse driving events and is often described as a crash rate.
Driver performance describes the behaviours employed by the operator during the driving task, which are rated by their quality and effectiveness. These categories are not directly linked; low scoring on driving performance is not an indicator of increased likelihood of future collision.31
A critical review of the available research performed by Owsley et al31 found that visual acuity has no relationship to involvement with a motor collision (a significant but weak correlation was found in older drivers), however it is associated with reduced driver performance. In terms of driving skills, static visual acuity has relevance in regard to sign recognition but is not related to collision avoidance.
In a study to investigate the effect of inducing refractive blur in both day and nighttime driving conditions,30 it was found that refractive blur led to reduced static visual acuity and contrast sensitivity, which further led to reduced driving performance.
Subjects with refractive blur hit more hazards, recognised signs at a shorter distance and took longer to complete the circuit, with the effect being worse under nighttime driving conditions. However, gap judgement and the ability to maintain position of the vehicle within the lane remained stable demonstrating that a driver with reduced acuity is capable of driving with a degree of safety.
Interestingly, two of the three levels of induced blur (+0.50DS and +1.00DS) resulted in acuities that met the visual standard for driving in the country where the research was conducted demonstrating that this is a poor measure of a person’s ability to drive. If static acuity and standard visual field tests have limitations in determining a person’s visual and cognitive fitness to drive, what other methods can be employed within optometric practice?
Acuity
As well as resolution acuity, there are other types of acuity that are relevant to the driving task. Recognition acuity describes the ability to differentiate between different targets (an example of this is Landolt rings), and Vernier acuity which is a measure of the eye’s ability to identify misalignment.31
In addition to these, and of particular relevance to driving patients is the measure of dynamic visual acuity, low-luminance acuity, and low-contrast acuity.22
Visual Fields
The concept of ‘Useful Field of View’ (UFOV) has been suggested as a more accurate method of assessing someone’s visual fitness to drive and has been shown to be an effective way of predicting driving performance when attention is divided,32,33 as it often is when driving. The Useful Field of View is defined as:
…the visual area from which information can be acquired without moving the eye or turning the head.34
A method for assessing UFOV was developed in the late 1980s35 designed to help practitioners understand the everyday visual problems encountered by older patients that are not measurable using traditional assessment methods like visual acuity and visual fields tests. Rather than being solely a test of visual function, it also provides a measure of higher order cognitive abilities that are extremely relevant to driving.36
The current commercially available UFOV test from Posit Science involves the subject completing three short tests. These measure processing speed, divided attention ability and selective attention ability. The results are presented in speed (milliseconds) with lower scores representing greater ability. An overall score is given in the form of risk for which there are five categories (very low to high).37
Interestingly, research has shown that it is possible to use this software as a training tool, with six studies in older populations (age range from 55 to 95) all demonstrating an improvement in processing speeds after regular training.38
Contrast Sensitivity
With an increased death toll from motor collisions at night39,40 understanding a person’s ability to see under mesopic conditions is important in determining their fitness to drive in low light conditions.41-43
Contrast sensitivity function is a useful indicator of adequate visual function for driving in low light, with one study demonstrating that it is directly related to hazard detection speed under simulated conditions.41
Furthermore, it has been shown that reduced contrast sensitivity can lead to a person meeting the required driving standards under photopic conditions yet fail them under low lighting conditions.42 This is particularly important when we consider older patients where opacities caused by conditions such as a developing cataract are concerned.
Are we doing enough for driving patients?
The Driver and Vehicle Standards Authority (DVSA) recognises the importance of adequate standard for vision requirements for drivers and is currently investigating better methods for determining a person’s visual capabilities with regard to driving.43
Following a public consultation, proposals have been made to change the eyesight test performed during the test so that it may be performed in any light conditions, not just good daylight and to incorporate more tests as part of the overall driving test.
As part of the consultation, one respondent made the following comment:
‘I do not understand why a road safety organisation such as the DVSA conducts such a rudimentary eyesight check as asking someone to read a number plate from the very short distance of only 20m. If we’re going to be serious about road safety, then anyone wishing to apply for a driving licence should be required to take a full eyesight examination with an optometrist.’
While this may appear to be the ‘gold standard’ in meeting visual requirements for driving, as has been shown measures of static visual acuity alone is not enough to determine someone’s fitness to drive.
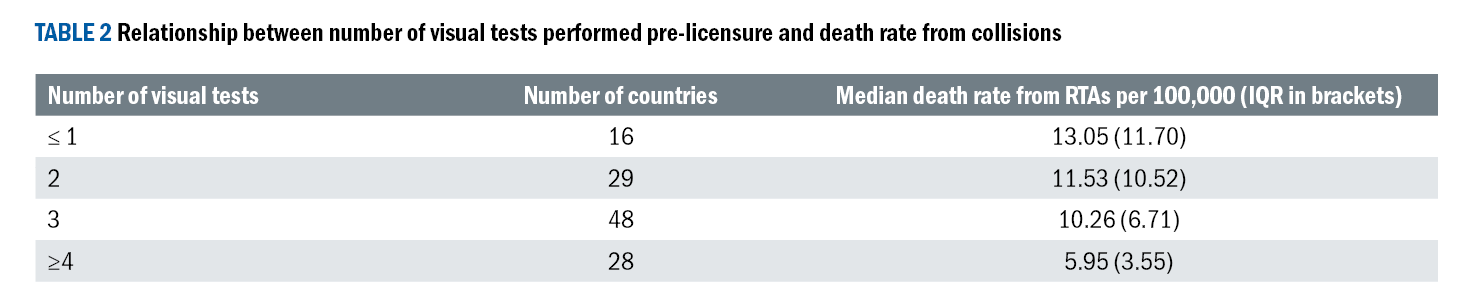
Returning to the research into vision standards for driving around the world,4 the authors came to an interesting conclusion regarding the number of visual standards required and the death rate from road traffic accidents (table 2) with fatality rates decreasing as the number of visual tests increased.
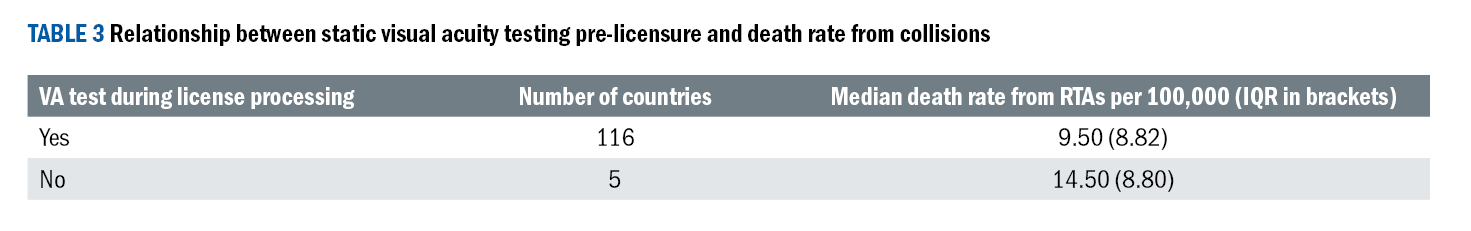
It was also found that countries where static visual acuity testing has to be carried out at the time the licence was processed had lower fatalities per 100,000 than those that did not, although the p-value was less significant compared to that for the total number of visual tests (table 3).
There are many reasons for road traffic accidents, so this data has some limitations, however it is interesting that the same relationship occurs when analysing the data against the effective enforcement of speeding, seatbelt and driving under the influence of alcohol regulations – the stricter the enforcement, the lower the accident rate. It appears that performing more visual testing methods is related to improved driver safety.
Conclusion
Driving relies heavily on good vision and efficient cognitive processing, both of which deteriorate with age. A large proportion of our patients are drivers and, although we can perform the tests required to meet the driving standards for group 1 drivers, it is worth considering including additional tests to adequately assess a person’s fitness to drive from a visual perspective.
In the author’s experience, visual field assessment is not routinely performed for all drivers, yet the standards signpost applicants to check with their optician if they meet the requirements. Furthermore, assessing contrast sensitivity, glare recovery, colour perception and acuity under speed could be considered to provide a higher standard of care for drivers.
There are many additional methods of assessing vision that can be used to support driving patients, with the introduction of more advanced testing technologies, such as the UFOV test and Keystone View’s Drivers Vision Screener,46 we are able to offer a more comprehensive visual assessment, which can guide the advice we give on driving suitability and driver behaviour, such as recommending limited driving under certain conditions.
In the absence of this support from other medical professionals and the licensing authorities, optometrists and dispensing opticians are well placed to provide drivers with the support to improve their safety and driving performance.
- Eluned ‘Lil’ Creighton-Sims is a dispensing optician who has worked in the optical industry since 1999, her early career was spent in various practice settings as a senior dispensing optician and manager. For most of her career, she has been involved in the supply chain working with lens suppliers, manufacturers, and lens design companies. Creighton-Sims is the UK manager for the research and lens design company IOT Lenses, and is also the owner of BCS Optics providing consultancy services to the wider optical and finance industry including learning and development solutions and Continued Professional Development.
References
- Department for Transport. Driving Licences and Access to Vehicles.; 2023. Accessed March 28, 2024. https://www.gov.uk/government/statistical-data-sets/nts02-driving-licence-holders#full-publication-update-history
- Department for Transport. National Travel Survey 2022: Household Car Availability and Trends in Car Trips.; 2023. Accessed March 28, 2024. https://www.gov.uk/government/statistics/national-travel-survey-2022/national-travel-survey-2022-household-car-availability-and-trends-in-car-trips
- Department for Transport. Purpose of Travel.; 2023. Accessed March 28, 2024. https://www.gov.uk/government/statistical -data-sets/nts04-purpose-of-trips#trips-stages-distance-and-time-spent-travelling
- Almatar H et al. Visual Functions, Seatbelt Usage, Speed and Alcohol Consumption Standards for Driving and Their Impact on Road Traffic Accidents. Clin Optom (Auckl). 2023;15:225-246. doi:https://doi.org/10.2147/OPTO.S422635
- Members Research Service. Revision of the Driving Licence Directive [EU Legislation in Progress]. European Parliamentary Research Service. Published June 21, 2023. Accessed March 28, 2024. https://epthinktank.eu/2023/06/ 21/revision-of-the-driving-licence-directive-eu-legislation-in-progress/
- Gyapong O. EU Parliament Adopts Stand on Revisions to Driving Licence Directive. EURACTIV. Published March 14, 2024. Accessed March 28, 2024. https://www.euractiv.com/section/transport/news/eu-parliament-adopts-stand-on-revisions-to-driving-licence-directive
- Department of Motor Vehicles New York. Vision test report MV619.; 2022. Accessed March 29, 2024. https://dmv.ny.gov/forms/mv619.pdf
- Department of Motor Vehicles New York State. Driver Licence Endorsement and Restriction Codes. Accessed March 29, 2024. https://dmv.ny.gov/driver-license/driver-license-endorsement-and-restriction-codes
- Department of Motor Vehicles New York. Eye test report for medical review unit form MV80L.; 2022. Accessed March 29, 2024. https://dmv.ny.gov/forms/mv80l.pdf
- Great Britain. Department of the Environment. The Official Highway Code for Northern Ireland. TSO; 2008.
- Reddy V et al. Driving Restrictions per State. Eyewiki. Published February 12, 2024. Accessed March 29, 2024. https://eyewiki.aao.org/Driving_Restrictions_per_State
- DVSA. Hazard Perception Test Wins Road Safety Awards. Published June 19, 2014. Accessed April 2, 2024. https://www.gov.uk/government/news/hazard-perception-test-wins-road-safety-award
- UK Government. Theory Test: Cars. Accessed April 2, 2024. https://www.gov.uk/theory-test/print
- Licensing Agency V. INF104 Vehicle Registration Numbers and Number Plates. www.gov.uk/personalised-vehicle-registration-numbers
- UK Government. Driving Test: Cars. Accessed April 2, 2024. https://www.gov.uk/driving-test/print
- Driver and Vehicle Standards Agency. Carrying Out Driving Tests: Examiner Guidance. Published November 21, 2022. Accessed April 2, 2024. https://www.gov.uk/guidance/guidance-for-driving-examiners-carrying-out-driving-tests-dt1/01-the-practical-driving-test-and-extended-test-for-cars
- DVLA. A Guide to the standards of Vision for Driving cars and Motorcycles(Group 1).; 2017. Accessed April 6, 2024. https://assets.publishing.service.gov.uk/media/ 5a81cd49ed915d74e6234305/inf-188X1-standards-of-vision-for-driving-cars-and-motorcycles-group-1.pdf
- Alan H. Tunnacliffe. Introduction to Visual Optics. 4th ed. The Association of British Dispensing Opticians; 2004.
- Kiel AW, Butler T, Alwitry A. Visual acuity and legal visual requirement to drive a passenger vehicle. Eye. 2003;17(5):579-582. doi:10.1038/sj.eye.6700441
- Currie Z, Bhan A, Pepper I. Reliability of Snellen charts for testing visual acuity for driving: prospective study and postal questionnaire. BMJ. 2000;321(7267):990. doi:10.1136/bmj.321.7267.990
- Latham K, Katsou MF, Rae S. Advising patients on visual fitness to drive: Implications of revised DVLA regulations. British Journal of Ophthalmology. 2015;99(4):545-548. doi:10.1136/bjophthalmol-2014-306173
- Olson PL, Dewar Robert, Farber Gene. Forensic Aspects of Driver Perception and Response. Lawyers & Judges Pub; 2010.
- DVLA. Visual Disorders: Assessing Fitness to Drive. GOV.UK. Published March 2, 2021. Accessed April 7, 2024. https://www.gov.uk/guidance/visual-disorders-assessing-fitness-to-drive#minimum-eyesight-standards--all-drivers
- Bowers AR. Driving with homonymous visual field loss: a review of the literature. Clin Exp Optom. 2016;99(5):402-418. doi:10.1111/cxo.12425
- Patterson G, Howard C, Hepworth L, Rowe F. The Impact of Visual Field Loss on Driving Skills: A Systematic Narrative Review. British and Irish Orthoptic Journal. 2019;15(1):53-63. doi:10.22599/bioj.129
- RACETTE L, CASSON EJ. The Impact of Visual Field Loss on Driving Performance: Evidence From On-Road Driving Assessments. Optometry and Vision Science. 2005;82(8). https://journals.lww.com/optvissci/fulltext/2005/08000/the_impact_of_visual_field_loss_on_driving.8.aspx
- Elgin J, Mcgwin G, Wood JM, et al. Evaluation of On-Road Driving in Persons with Hemianopia and Quadrantanopia.; 2010.
- Solowczuk A. Effect of Bulb-outs at Intersections on Speed Reduction and Visibility Conditions in Tempo–30 Zone. In: New Approaches in Engineering Research Vol. 4. Book Publisher International (a part of SCIENCEDOMAIN International); 2021:24-34. doi:10.9734/bpi/naer/v4/8595d
- Rogé J, Pébayle T, Lambilliotte E, Spitzenstetter F, Giselbrecht D, Muzet A. Influence of age, speed and duration of monotonous driving task in traffic on the driver’s useful visual field. Vision Res. 2004;44(23):2737-2744. doi:10.1016/j.visres.2004.05.026
- Rogé J, Pébayle T, Hannachi S El, Muzet A. Effect of sleep deprivation and driving duration on the useful visual field in younger and older subjects during simulator driving. Vision Res. 2003;43(13):1465-1472. doi:10.1016/S0042-6989(03)00143-3
- Owsley C, McGwin G. Vision and driving. Vision Res. 2010;50(23):2348-2361. doi:10.1016/j.visres.2010.05.021
- Wood JM, Collins MJ, Chaparro A, et al. Differential effects of refractive blur on day and nighttime driving performance. Invest Ophthalmol Vis Sci. 2014;55(4):2284-2289. doi:10.1167/iovs.13-13369
- Illuminating Engineering Society of North America. IESNA Lighting Handbook 9th Ed - PDF Room.
- Wood JM, Chaparro A, Lacherez P, Hickson L. Useful Field of View Predicts Driving in the Presence of Distracters. Vol 89.; 2012. http://journals.lww.com/optvissci
- Ball KK, Clay OJ, Wadley VG, Roth DL, Edwards JD, Roenker DL. Predicting driving performance in older adults with the useful field of view test: a meta-analysis.; 1993.
- Mestre DR. The Useful Field of View in Driving.; 2014. Accessed April 8, 2024. http://www.ism.univ-amu.fr/mestre/projects/heading/UFOV2.htm
- Ball KK, Beard BL, Roenker DL, Miller RL, Griggs DS. Age and visual search: expanding the useful field of view. Journal of the Optical Society of America A. 1988;5(12):2210. doi:10.1364/josaa.5.002210
- Wood JM, Owsley C. Useful field of view test. Gerontology. 2014;60(4):315-318. doi:10.1159/000356753
- Posit Science. UFOV Assessment Manual.; 2011.
- Edwards JD, Wadley VG, Vance DE, Wood K, Roenker DL, Ball KK. The impact of speed of processing training on cognitive and everyday performance. Aging Ment Health. 2005;9(3):262-271. doi:10.1080/13607860412331336788
- Sullivan JM. Relationships among Driver Age, Vehicle Cost, and Fatal Nighttime Crashes.; 2009. https://www.researchgate.net/publication/30862556
- Plainis S, Murray IJ, Pallikaris IG. Road traffic casualties: Understanding the night-time death toll. Injury Prevention. 2006;12(2):125-128. doi:10.1136/ip.2005.011056
- Jones PR, Ungewiss J, Eichinger P, Wörner M, Crabb DP, Schiefer U. Contrast Sensitivity and Night Driving in Older People: Quantifying the Relationship Between Visual Acuity, Contrast Sensitivity, and Hazard Detection Distance in a Night-Time Driving Simulator. Front Hum Neurosci. 2022;16. doi:10.3389/fnhum.2022.914459
- Rae S, Latham K, Katsou MF. Meeting the UK driving vision standards with reduced contrast sensitivity. Eye (Basingstoke). 2016;30(1):89-94. doi:10.1038/eye.2015.188
- DVSA. Improving Driving Test Availability and Processes: Consultation Outcome. GOV.UK. Published March 30, 2023. Accessed April 9, 2024. https://www.gov.uk/government/ consultations/driving-tests-improving-availability-and-processes/outcome/improving-driving-test-availability-and-processes-consultation-outcome#update-when-and-how-we-check-someones-eyesight-at-the-start-of-the-driving-test
- Instruction Manual Vision Screening with the Keystone View DVS-V GT.; 2014. www.keystoneview.com