At the NEG/Independents Day conference in November 2016, Heidelberg Engineering scanned three real patients from Optometrist Peter Waite’s practice, KG Miles in Birmingham. All the patients were scanned live on the big screen using the Spectralis Imaging Platform and were assessed for both retinal disease and glaucoma. A case study is presented below in the second of a three-part series examining each of the patient cases.
Patient presentation
A 72-year-old female patient of Afro-Caribbean ethnicity presented with a sudden loss of vision in her right eye. She was an existing patient who had elected to attend the practice for an earlier than scheduled eye examination. She reported a quick deterioration in the vision of her right eye over the past couple of days. This is her dominant eye and she is now struggling with visual tasks at distance and near.
Fundus examination: Retinal haemorrhage, dilated vein and arteriovenous crossing changes in the right superior temporal quadrant of her right eye.
Previous ocular history: Advanced glaucoma and early cataracts in both eyes. Left eye had inferior retinal vein occlusion in 2013 and left eye had also had a macular hole in 2012.
Ocular treatment history: Right eye: iridectomy. Travatan eye drops in both eyes.
General medical history: Right sphenoid sinus tumour in 2013. Has had type II diabetes since 2014 (which is diet controlled), along with hypertension and cardiac arrhythmias.
IOP: R 15mmHg L 17mmHg
Family history: Mother is diabetic and brother has glaucoma.
Fundus examination (8/4/2015)
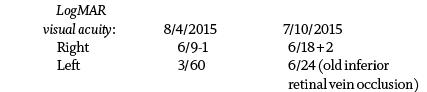
The infrared fundus image of the right eye (figure 1) shows a clearly circumscribed area of hypo-reflectivity in the superior temporal quadrant, which is consistent with retinal oedema and haemorrhage (yellow circle). There is an arteriovenous crossing change (red circle), with dilated vein distal to this point. At this point, pressure from the over-lying artery is narrowing the lumen of the vein causing an accumulation of platelets which results in a vascular occlusion. These changes are therefore consistent with a branch retinal vein occlusion. The optic nerve shows extensive excavation, with marked deflection of retinal vessels at the disc margin and loss of neuro-retinal rim (figure 2).
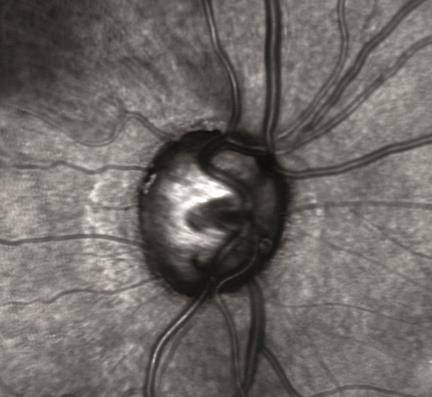
Figure 2: Infrared image of the disc (taken 8/4/2015)
The infrared fundus image of the left eye (figure 3) show signs of an old inferior temporal branch retinal vein occlusion (yellow circle). The optic nerve shows the same signs of advanced glaucoma that are observed in the right eye.
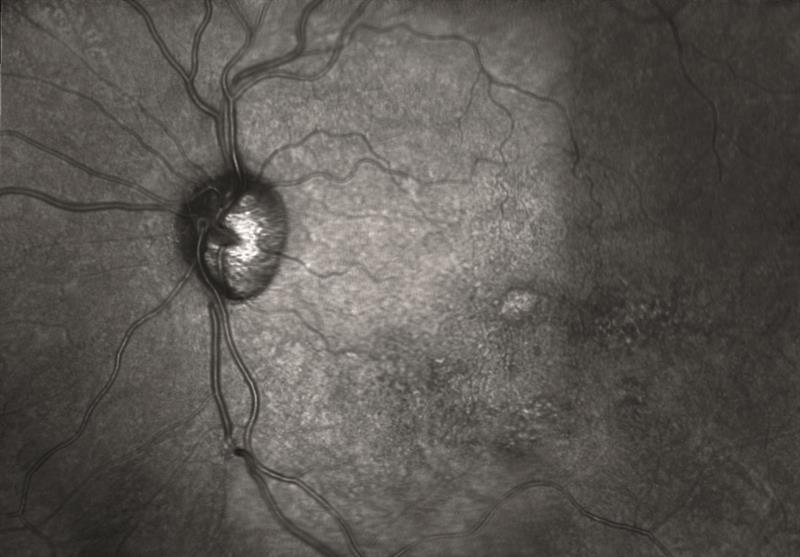
Figure 3: Infrared image of the disc and macular in the left eye (taken 8/4/2015)
OCT examination – right eye (8/4/2015)
The OCT examination of the right eye (figure 4) shows an abnormal retinal and foveal profile, with shallowed foveal depression, hypo and hyper-reflective voids in the nuclear layers of the retina and an area of hypo-reflectivity under the fovea. These changes would fit with acute intraretinal cyst formation secondary to a retinal vein occlusion and sub-retinal fluid.
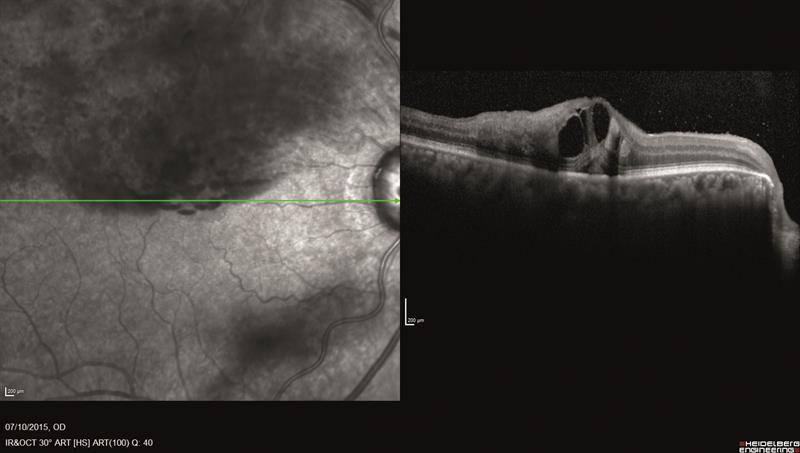
Figure 4: Horizontal line OCT exam of the right eye
The retinal thickness map (figure 5) shows marked retinal thickening (white and red areas) secondary to macular oedema secondary to a retinal vein occlusion.
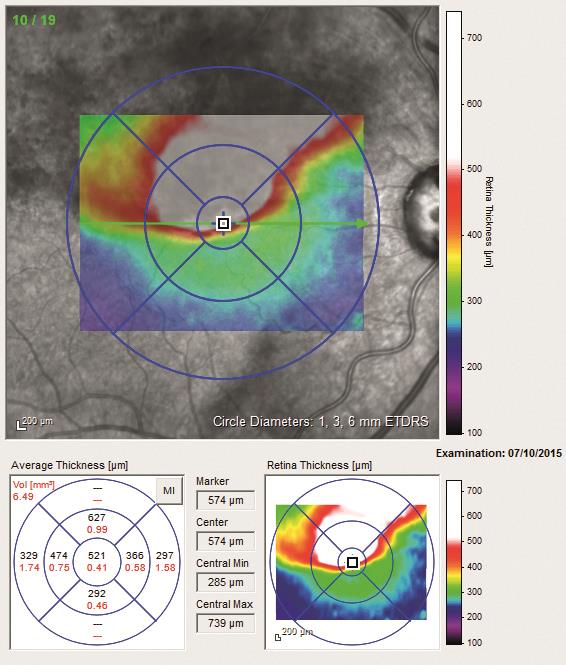
Figure 5: Retinal thickness map
OCT examination – left eye (8/4/2015)
The OCT examination of the left eye (figure 6) shows an abnormal retinal and foveal profile, with shallowed foveal depression (red circle). There is marked retinal atrophy, particularly in the inner/outer nuclear layer and photoreceptor layer (yellow circle). These changes would fit with chronic retinal atrophy secondary to a retinal vein occlusion.
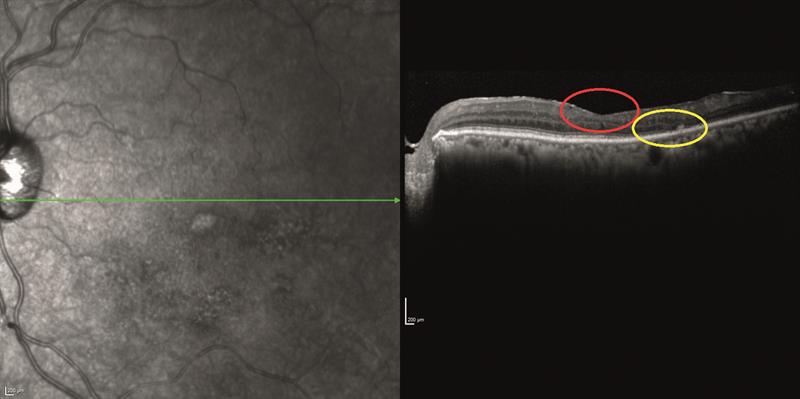
Figure 6: Horizontal line OCT exam of the left eye
The retinal thickness map (figure 7) shows extensive macular atrophy (blue and purple areas).
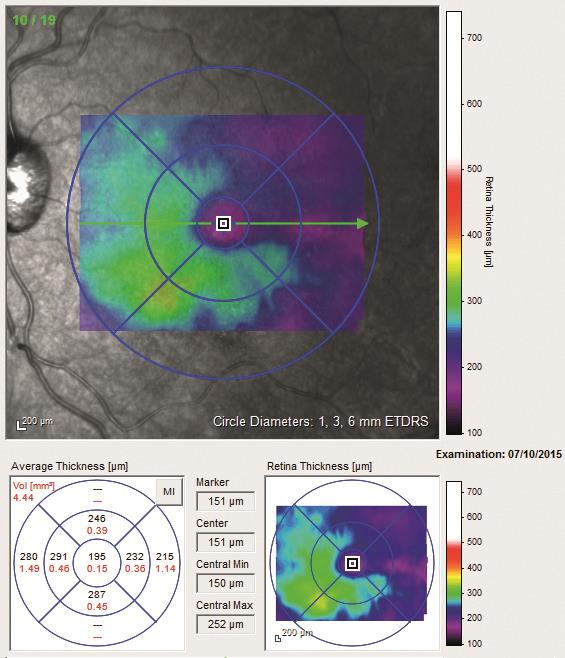
Figure 7: Retinal thickness map
Glaucoma assessment using the RNFL report for right and left eye (8/4/2015)
The retinal nerve fibre layer (RNFL) examination (figure 8) shows classic signs of an advanced glaucoma with loss of temporal superior and inferior RNFL bundles (figure 9). The retinal oedema from the acute branch retinal vein occlusion masks the true extent of the RNFL atrophy temporal superior in the right eye.
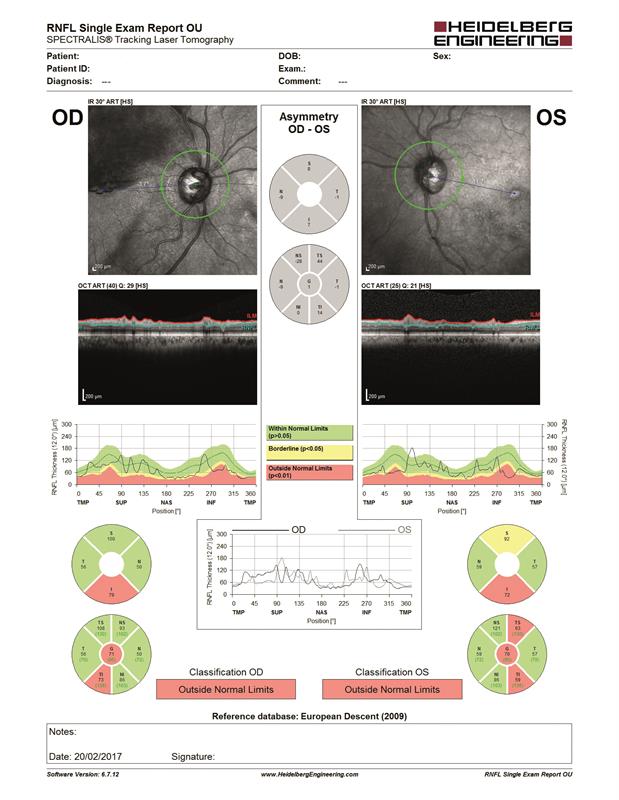
Figure 8: RNFL report for right (OD) and left (OS) eye
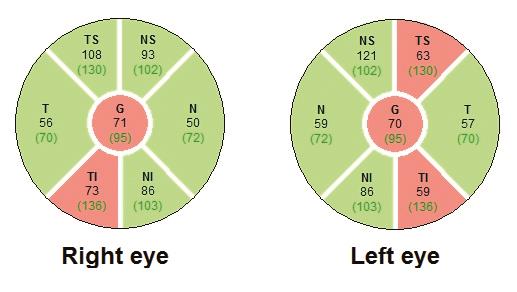
Figure 9: RNFL thickness (µm) classification charts for right and left eye
Clinical decision
The patient was referred urgently for further investigation for acute branch retinal vein occlusion. At the hospital the patient underwent anti-VEGF treatment and had laser treatment in the right eye.
Six months later
On 7/10/2015, the patient re-attends the practice and the results are given below.
Fundus examination (7/10/2015)
The right eye (figure 10) shows evidence of grid laser treatment (red circle) and resolution of widespread macular and retinal oedema and haemorrhage. The left macular remains unchanged (figure 11).
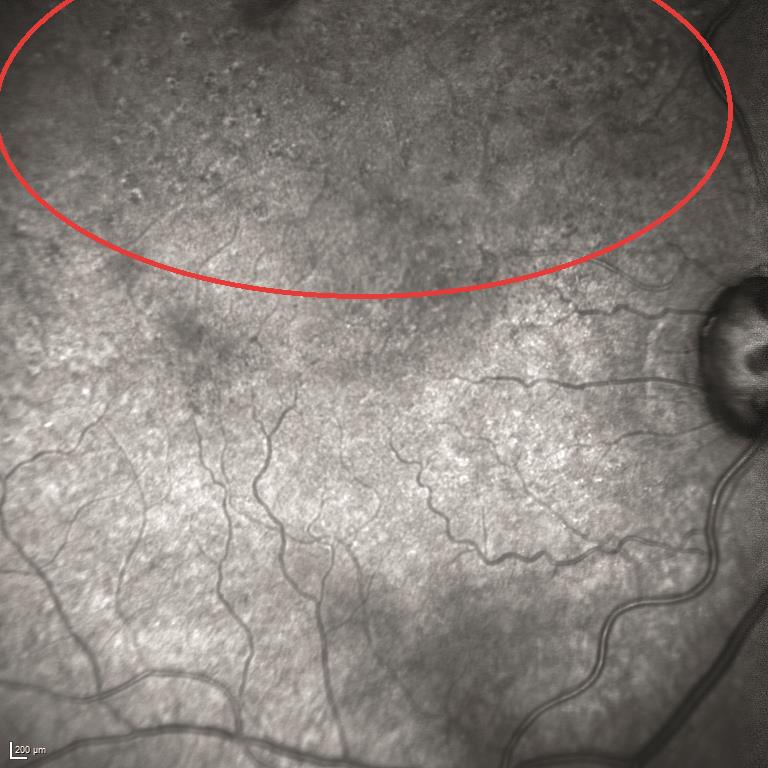
Figure 10: Infrared image of the macular in the right eye
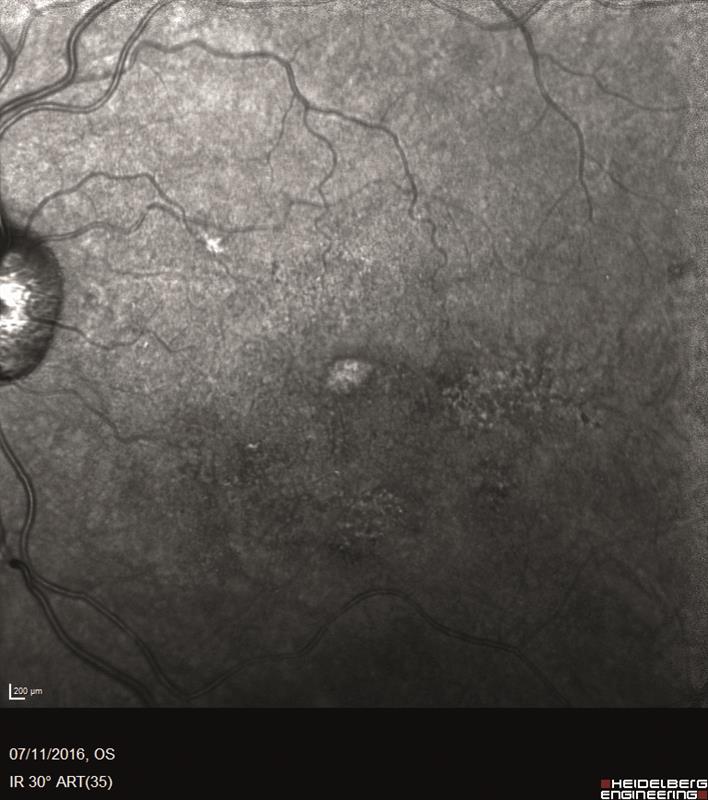
Figure 11 Infrared image of the macular in the left eye
OCT Examination – right eye (7/10/2015)
The OCT examination of the right eye (figures 12 and 13) still shows an abnormal retinal and foveal profile, with shallowed foveal depression (red circle). The hypo and hyper-reflective voids in the nuclear layers of the retina have reduced in size. The observed changes are likely to be secondary to anti-VEGF therapy and grid laser treatment.
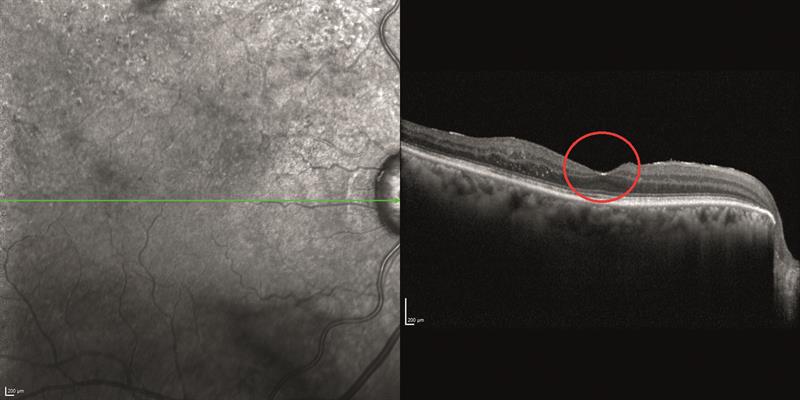
Figure 12: Horizontal line OCT exam of the right eye
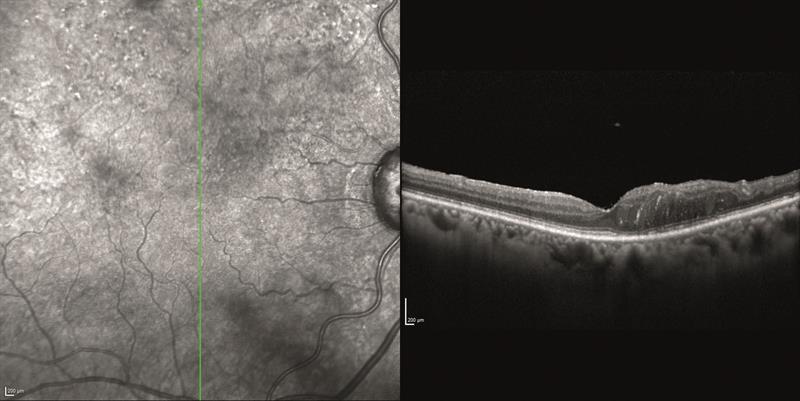
Figure 13: Vertical line OCT exam of the right eye
The retinal thickness map (figure 14) again shows resolution of the macular thickening and associated retinal oedema, although an area of retinal thickening persists above the fovea (red area).

Figure 14: Retinal thickness map
Glaucoma assessment using the RNFL report for right and left eye (7/10/2015)
Now that the retinal oedema in the right eye has been resolved using laser treatment, a more accurate assessment of the RNFL in the right eye can be made (figure 15). The assessment reveals significant tissue loss (figure 16), which was previously masked by the retinal swelling.
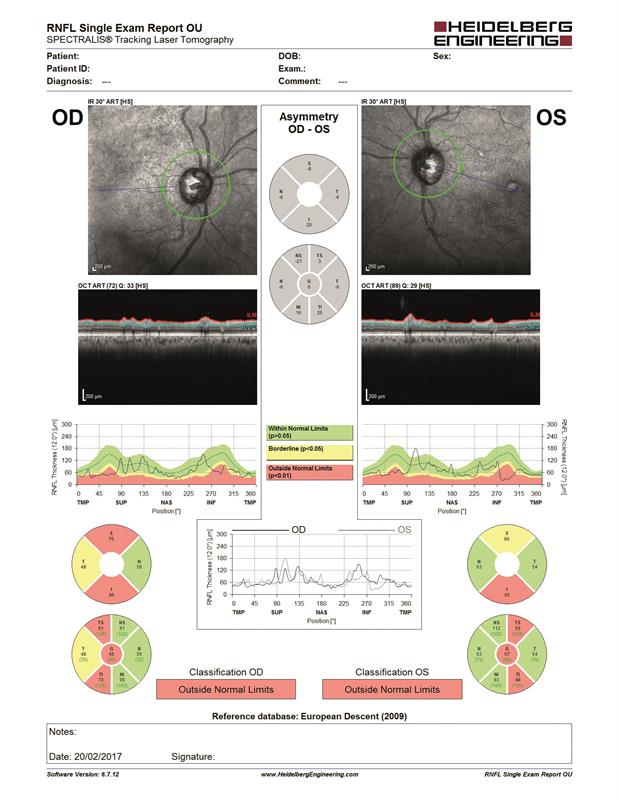
Figure 15: RNFL report for right (OD) and left (OS) eye
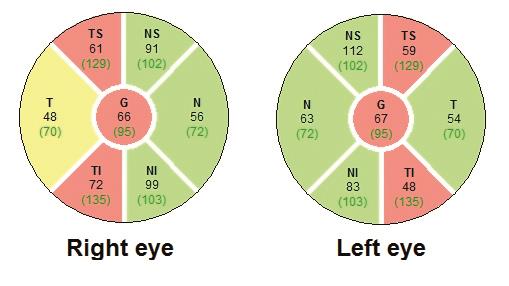
Figure 16: RNFL thickness (µm) classification charts for right and left eye
Conclusion
The lack of improvement in the patient’s visual acuity, despite the resolution of the macular oedema, may be secondary to an ischaemic change at the fovea. Further angiographic investigation might be indicated, either with fluorescein angiography or OCT angiography, for a non-invasive assessment of vascular flow and structure.
Glaucoma is a risk factor for vascular occlusion due to the tissue remodelling observed in this progressive optic neuropathy. OCT eloquently provides visualisation of the vascular occlusion and the effects of the subsequent treatment. Remember that co-morbidities may mask the results or introduce artefact into OCT assessment. Referring back to the images enables the optometric practitioner to confidently interpret OCT data.
Want to know what happened next? Join Heidelberg Engineering on stand G20 at Optrafair on Sunday, April 2, to take part in a live follow-up examination of this patient and peer discussion worth three CET points. Register at www.optrafair.co.uk/education/on-stand-cet.