
For almost a quarter of a century, we have examined the state of the UK contact lens market in terms of the lenses and solutions prescribed by British eye care practitioners.1-23 The initial rationale for the work still holds; we wish to report details of products used by a large peer group to allow individual clinicians to benchmark their own product choices and prescribing habits
In early 2019, we selected 1,400 optometrists and 600 contact lens opticians at random from the current General Optical Council register and sent out our A4 survey form. We asked for some background information about each recipient and then requested data on the first 10 contact lens fits performed since the survey form arrived. This included: date of fitting, new or refit, age, sex, material, design, frequency of replacement, days per week of wear, daily or extended wear, and care system. This was entered into our database of almost 400,000 lens fits and analysed. A weighting system was used to appropriately account for the volume of activity undertaken by the respondents, calculated by the time period required to achieve 10 fits.
In 2019, we received forms from 66 contact lens opticians, 40 optometrists and two ‘not recorded’ practitioners. These forms detailed 1,036 fits. Sixty six per cent of the lens fits were to females and the mean age of the fitted patients was 37.7 ±17.4 years (with a range of six to 86 years) which is a slight reduction on recent years. Fifty five per cent of fits were ‘new’ (ie to patients with no recent contact lens history) and 31% of patients were anticipated to use their lenses on a part-time (three days per week or less) basis. As was the case in 2018, 99% of new fits were with soft lenses compared with 90% of refits (figure 1).
Soft lens details
Around 80% of all soft lenses prescribed were manufactured from silicone hydrogel materials with the remaining lenses generally mid (40-60%) or high (>60%) water content products (figure 2). The use of silicone hydrogels varied between daily disposable and reusable soft lenses (figure 3). In 2011, 83% of prescribed reusable lenses and 17% of daily disposables, respectively, were manufactured from silicone hydrogel materials. From that time, reusables have naturally reached something of a plateau whereas daily disposables have continued to increase with 73% manufactured from silicone hydrogels in 2019.
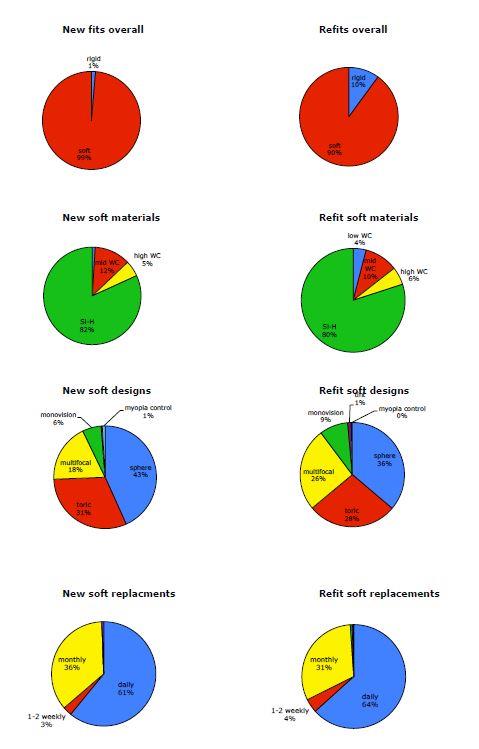 Figure 2: Major findings from the 2019 survey
The proportion of spherical-only fits continues to decline due to the success of toric and multifocal lenses. In 2019, spherical lenses represented 43% of new soft lens fits with 31% toric, 18% multifocals, 6% monovision and 1% used for myopia control. The overall lens fit market continues to be dominated by daily disposable lenses (61% of new fits) and monthly replaced products (36% of new fits).
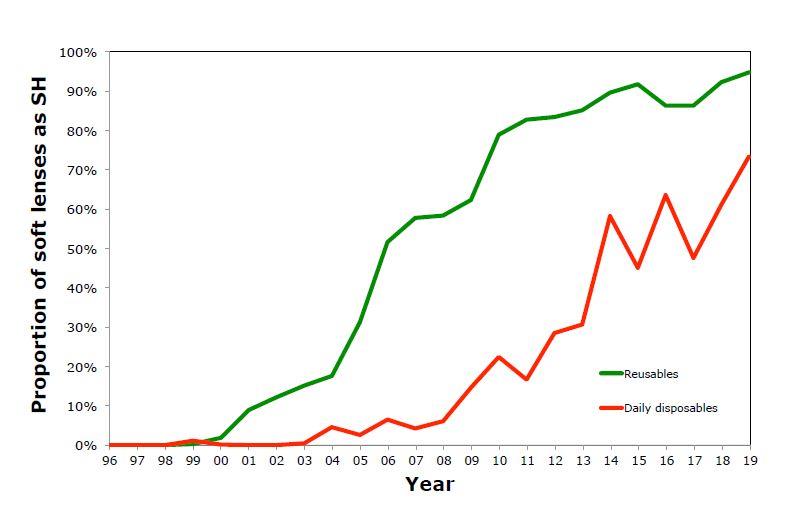 Figure 3: Silicone hydrogel materials prescribed for daily disposable and reusable lenses
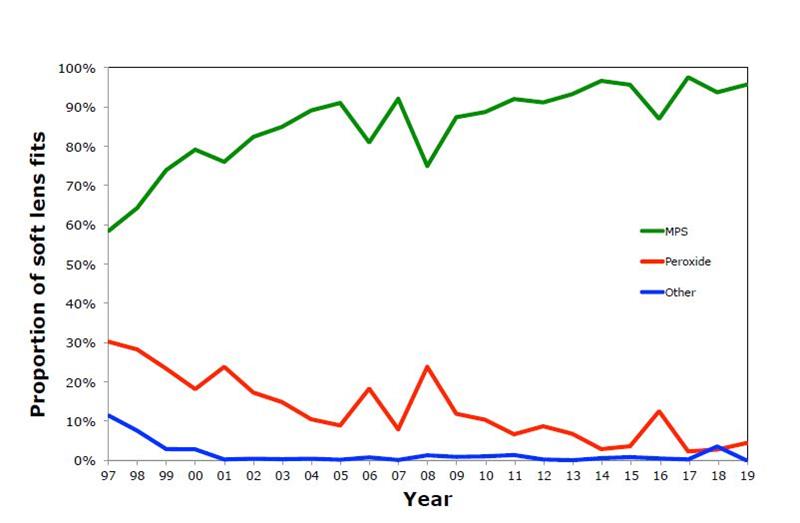 Figure 4: Solution types prescribed with soft lens fits
We received information about a relatively small number of rigid lens fits so caution needs to be applied when considering the breakdown of these lenses into the various sub-categories. However, we noted that mid Dk materials (40-90 Dk units) were the most widely prescribed and that multifocals accounted for 26% of rigid lens refits.
Philip Morgan is professor of Optometry and director of Eurolens Research at the University of Manchester.
References
2 Morgan PB. The trends in UK contact lens prescribing 2017. Optician 2017; 252 (6573): 12-14.
3 Morgan PB. The trends in UK contact lens prescribing 2016. Optician 2016; 252 (6573): 14-15.
4 Morgan PB. Trends in UK contact lens prescribing 2015. Optician 2015; 250 (6518): 12-13.
5 Morgan PB. Trends in UK contact lens prescribing 2014. Optician 2014; 248 (6468): 28-29.
6 Morgan PB. Trends in UK contact lens prescribing 2013. Optician 2013; 246 (6418): 16-17.
7 Morgan PB. Trends in UK contact lens prescribing 2012. Optician 2012; 244 (6364): 14-15.
8 Morgan PB. Trends in UK contact lens prescribing 2011. Optician 2011; 242 (6313): 14-15.
9 Morgan PB. Trends in UK contact lens prescribing 2010. Optician 2010; 239 (6255): 34-35.
10 Morgan PB. Trends in UK contact lens prescribing 2009. Optician 2009; 238 (6205): 20-21.
11 Morgan PB. Trends in UK contact lens prescribing 2008. Optician 2008; 235(6154): 18-19.
12 Morgan PB. Trends in UK contact lens prescribing 2007. Optician 2007; 233(6104): 16-17.
13 Morgan PB. Trends in UK contact lens prescribing 2006. Optician 2006; 231(6054): 16-17.
14 Morgan PB, Efron N. Trends in UK contact lens prescribing 2005. Optician 2005; 229(6004): 28-29.
15 Morgan PB and Efron N. Trends in UK contact lens prescribing 2004. Optician 2004; 227(5950): 16-17.
16 Morgan PB, Efron N. Trends in UK contact lens prescribing 2003. Optician 2003; 225 (5904): 34-35.
17 Morgan PB, Efron N. Trends in UK contact lens prescribing 2002. Optician 2002; 223 (5849): 28-30.
18 Morgan PB and Efron N. Trends in UK contact lens prescribing 2001. Optician 2002; 221 (5803): 38-39.
19 Morgan PB and Efron N. Trends in UK contact lens prescribing 2000. Optician 2000; 219 (5749): 22-23.
20 Morgan PB and Efron N. Trends in UK contact lens prescribing 1999. Optician 1999; 217 (5700): 43-44.
21 Morgan PB and Efron N. Trends in UK contact lens prescribing 1998 Optician 1998; 216 (5679): 18-19.
22 Morgan PB and Efron N. Trends in UK contact lens prescribing 1997. Optician 1997; 214 (5630): 32-33.
23 Morgan PB, Ramsdale C and Efron N. Trends in UK contact lens prescribing 1996. Optician 1997; 213 (5583): 35-36.


