Results for January were positive in the main, but only turnover per eye examination showed an improvement on January 2013.
Summary
? Total practice turnover increased by 4 per cent on last month to 162 Index points but this is 3 per cent lower than last January
? Total eye examinations improve by 15 per cent on December 2013 now at 96 Index points, which is also 15 per cent lower than last January
? Turnover per eye examination increases by just over £3 from last January to £170
? Average dispensing rate increases by 2 percentage points from last month to 64 per cent which is 2 percentage points lower than January last year
? Re-glazes decrease by 1 percentage points to 13 per cent of spectacles dispensed from last month and this is 2 percentage points lower than January 2013
? Anti-reflective coatings reduced by 2 percentage points from last month to 43 per cent and this is 2 percentage points higher than January last year
The New Year started with the expected monthly improvement in January and all our key performance measures, with the exception of new contact lens fits and sales of solutions, showing increases over December. However, the results in general fall below January last year apart from turnover per eye exam which shows a marginal improvement. This month the analysis concentrates on the main business drivers of the practice and the financial outcome over the past 24 months.
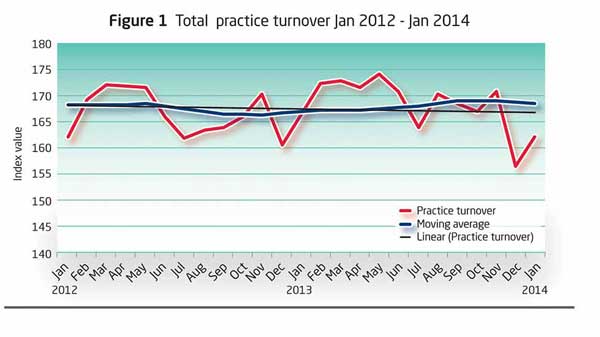
Total practice turnover (Figure 1) reveals strong performance in the early months of both the two years charted (January 2012 to January 2014) but significant under-performance through June, July and August in 2012. The moving average (which takes into account historic values over the preceding 12 months) is flat to May 2012 but then falls through the next six months before recovering through the course of 2013.
The linear trend-line (which takes into account only the values included in the chart) is falling slightly over the period. One of our panel members commented this month that in his view his regional group of practices had been ‘running to stand still’ over the last eight years. Our historic data shows that in January 2007 the moving average for total turnover was 163 Index points and in January 2014 is 168 Index points, which is a small 3 per cent improvement. It should be noted that this turnover Index figure is based on current pricing, taking no account of inflation, so the comment from our member does sum things up for the average practice. Of course, there are businesses which have performed exceptionally well and those which have not.
The increase in January 2014 was 4 per cent on December 2013 to 162 Index points, but this was 3 per cent lower than last January. As we see later, the number of eye examinations carried out by the sample is decreasing year on year but this has not impacted on turnover in a negative way as we have seen in the past. Perhaps, to complete the sporting metaphor, some of our sample practices have found the shortest route on the inside of the track.
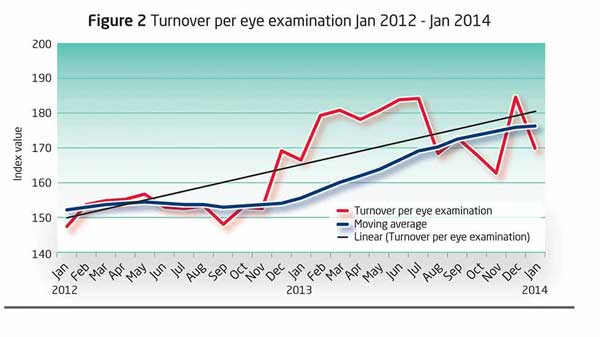
Turnover per eye examination (Figure 2) is an average value not an adjusted indexed figure and we saw a step change in this benchmark from the start of 2013 which is caused directly by the change in the sample to only include independent practices. Over the charted period the linear trend is positive and the moving average shows significant improvement which is now starting to flatten. The peak in December is the result of practice owners and managers maintaining their turnover despite considerably fewer eye during those months. It appears that clients who had their eye examinations in November or early December completed the purchase of their spectacles before Christmas. This month turnover per eye exam decreased from December by £14 to £170 but this is £3 higher than last January.
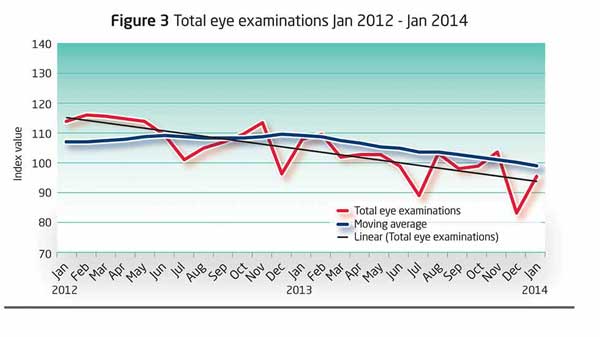
Total eye examinations from January 2012 to January 2014 (Figure 3) shows the moving average climbing slightly as the number of tests increased marginally year on year in 2012, but accentuated falls in July and December over the last 12 months have resulted in a falling moving average. Eye examinations this month increased to 96 Index points, a 14 per cent increase on December 2013, but this is 15 per cent lower than January 2013. Annual growth is negative at -10 per cent. NHS tests account for 75 per cent of all eye examinations carried out during January.
The growth and gradual ageing of the population is set to continue, but it appears that the rate of increase in the number of eye examinations is slowing and has now stalled at around 21 million per year. As our analysis suggests, independent practices are carrying out fewer examinations year on year. It is logical to conclude that the national multiples are increasing the number of sight tests they do and making up the difference. Historically, an optician’s revenue was directly related to the number of eye examinations carried out. Over the past four years we have seen some of our best performing panel members carry out slightly fewer eye tests but increase their turnover per eye examination and dispensing rate.
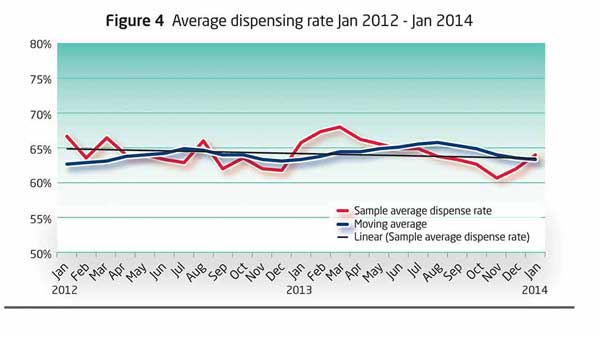
Average dispensing rate (Figure 4) showed improved performance, with the moving average climbing steadily until July of 2012 but then falling in line with the other performance measures we have looked at. The climbing moving average was extended through 2013 but we have seen a slight fall in October and November. The linear trend is slightly negative. The sample average total dispensing increased by 10 per cent to 87 Index points this month from December, but this is 5 per cent lower than January 2013.
Sales of single-vision lenses improved by five points from December to 61 Index points. Bi/trifocal lenses saw an upward movement over December to 38 Index points and progressive lenses also showed an improvement of 11 points, now at 204 Index points.
New contact lens fits are 4 per cent lower than December and January 2013 at 113 Index points.
The percentage of spectacles dispensed with reflection-free coatings has fallen by two percentage points from last month but this is two percentage points higher than January last year to 43 per cent. The percentage of re-glazes has decreased by one percentage point from last month and two percentage points from January last year to 13 per cent. The percentage of spectacles dispensed with photochromic lenses has fallen by one percentage point to 9 per cent from last month and this is three percentage points lower than January 2013.
Please note all figures shown are adjusted to a 25-day working month. In January 2014 there were 26 working days.
Benefits of joining the index:
? Monitor the practice performance of your practice month by month
? Customised reports benchmark your performance against your competitors
? Identify new trends quickly
? Optimise performance and establish competitive advantage
? Optician Index is free of charge to participating practices
If you would like to join or discuss the business value in more detail, contact Lynn Hawkins on 01622 260595 or email l.hawkins@businessbenchmarks.co.uk


