Age-related macular degeneration (AMD) is the most common cause of registrable sight impairment in the UK, accounting for approximately half of all registrations. As the name suggests. The disease presents as a degeneration of the central retinal tissue leading to distortion and loss of central vision.
The Macula
The macula can be considered to cover an area with a diameter of 5 to 6mm, which is centred some 21.5˚ of visual angle from the fovea1,2 and specialised for detailed vision. There are roughly 120 million photoreceptors in the retina and it is these that initiate vision. As we all remember, the photoreceptors comprise of:
- Rods; responsible for vision in dim light
- Cones; responsive to bright light and colour
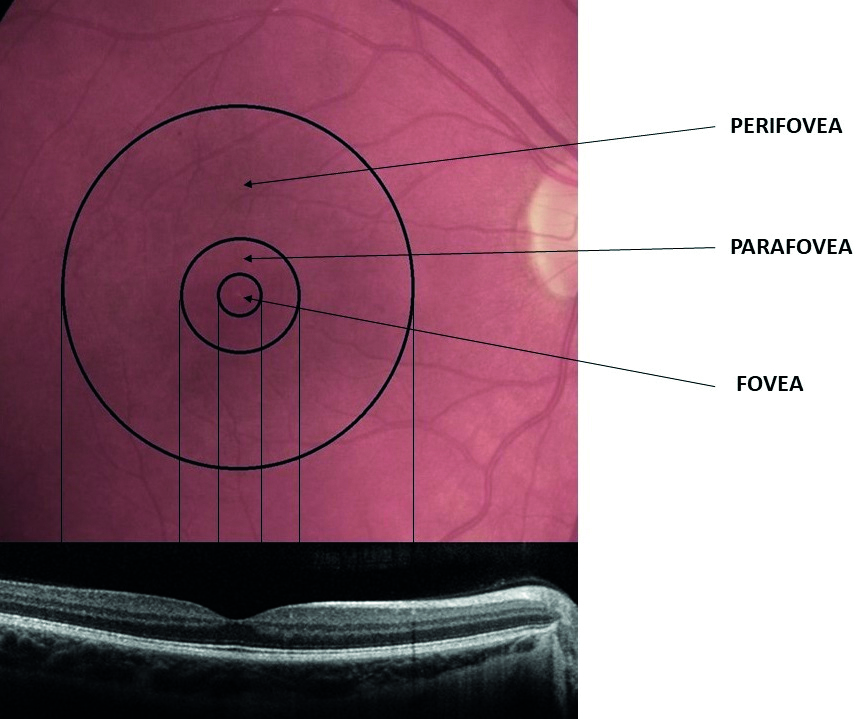
The macula contains three sub-regions (figure 1) with distinctly different photoreceptor content:
- Fovea; this cone-dominated central area is around 1.5mm in diameter and has at its centre a 0.5mm diameter avascular area (the foveal avascular zone, or FAZ), which itself can be further sub-divided into three distinct zones;
- The umbo, or central pit; 0.15mm in diameter, this is almost devoid of all layers of the retina beneath the cone photoreceptors
- The foveal slope; is still mainly devoid of other layers but some cell bodies of retinal interneurons, bipolar and horizontal cells and even some amacrine cell processes are becoming evident. The umbo and the foveal slope have a total diameter of 0.35mm and together are often described as the foveola. By the 0.35mm diameter circular area, the first ganglion cell bodies are beginning to appear
- FAZ; the central avascular area of 0.5mm diameter incorporating the foveola at its centre
- Parafovea; a rod-dominated 2.5mm diameter region encompassing the above smaller regions
- Perifovea; a rod-dominated 5.5mm diameter outermost region encompassing the above smaller regions
Figure 1: The anatomy of the macular area and its zonal subdivisions. Note that the foveal zone is cone-dominated but the parafovea and perifovea are rod-dominated
The rods outnumber the cones by 20:1 across the entire retina, and by 9:1 in the macular region. So, it is important to remember that the macula, despite its prominent role in photopic vision, is cone-enriched but not cone-dominated.3 The number of cones in the normal cone-dominated area remains stable throughout life, whereas rod density decreases by around 30% with the greatest loss occurring in the parafoveal area.4
Photoreceptor outer segments are comprised of stacked membranes containing proteins, which form part of the phototransduction cascade. Outer segment components are synthesised in the photoreceptor cell body, with continual phagocytosis of the outer segments discs every day by the retinal pigment epithelium (RPE). The RPE sustains photoreceptor health in numerous ways, including maintaining proper ionic balance and hydration, transporting and filtering nutrients, providing retinoid intermediates to replenish the photopigment bleached by light exposure, and absorbing stray photons.
The RPE and photoreceptors are supplied by the choroidal vascular system, which boasts the highest rate of blood flow per unit weight of any tissue. Between the RPE and the choriocapillaris lies Bruch’s membrane (figure 2), a delicate wall only 2 to 6µm thick and divided into five distinct layers in the following order running anterior to posterior:
- RPE basal lamina
- Inner collagenous layer
- Elastic layer
- Outer collagenous layer
- Choriocapillary endothelium basal lamina
Figure 2: Structure of Bruch’s membrane (constituent layers in bold)

All nutrients passing to and metabolites from the RPE and photoreceptors must cross Bruch’s membrane. This clearly has the potential to affect retinal function and is a major reason why, over time, there is a build up of materials and degeneration to adjacent tissues, especially closer to the fovea where there is the highest photochemical activity.
AMD
AMD is a multifactorial disease, and there is a wide range of influences that variously contribute to the disease pathogenesis, including ageing, genetics and environmental factors such as diet and light exposure.5,6 Exactly how these factors cause macular damage is not yet fully understood.7
Recent studies have shown that inflammatory response, and the complement pathway in particular, plays a ‘pivotal role in the pathogenesis of AMD’,8,9 leading some to call AMD a ‘complementopathy.’10 For a detailed discussion of the inflammatory processes in AMD, see Optician 06.11.20.
The retina changes with age and many of these changes are difficult to differentiate from those linked with AMD. In fact, exact definitions of normal and abnormal at stages of life have yet to be exactly described. That the main non-modifiable risk factor for AMD is age makes this yet more problematic. For example, photooxidative damage contributes to both AMD and to the normal ageing process.
With age, the following changes occur:
- Photoreceptors become reduced in density within the outer retina
- Within the RPE, melanin granules diminish, and lipofuscin granules form
- Sheet-like deposits called basal laminar deposits develop below the RPE but above Bruch’s membrane (basal lamina of the RPE)
- Within the choriocapillaris, involutional changes are observed. Decreased choroidal blood flow, lumen diameter and choriocapillaris number also occur11
- Small, defined focal depositions of acellular debris (hard drusen) may form between the RPE and Bruch’s membrane and are a common finding in older patients
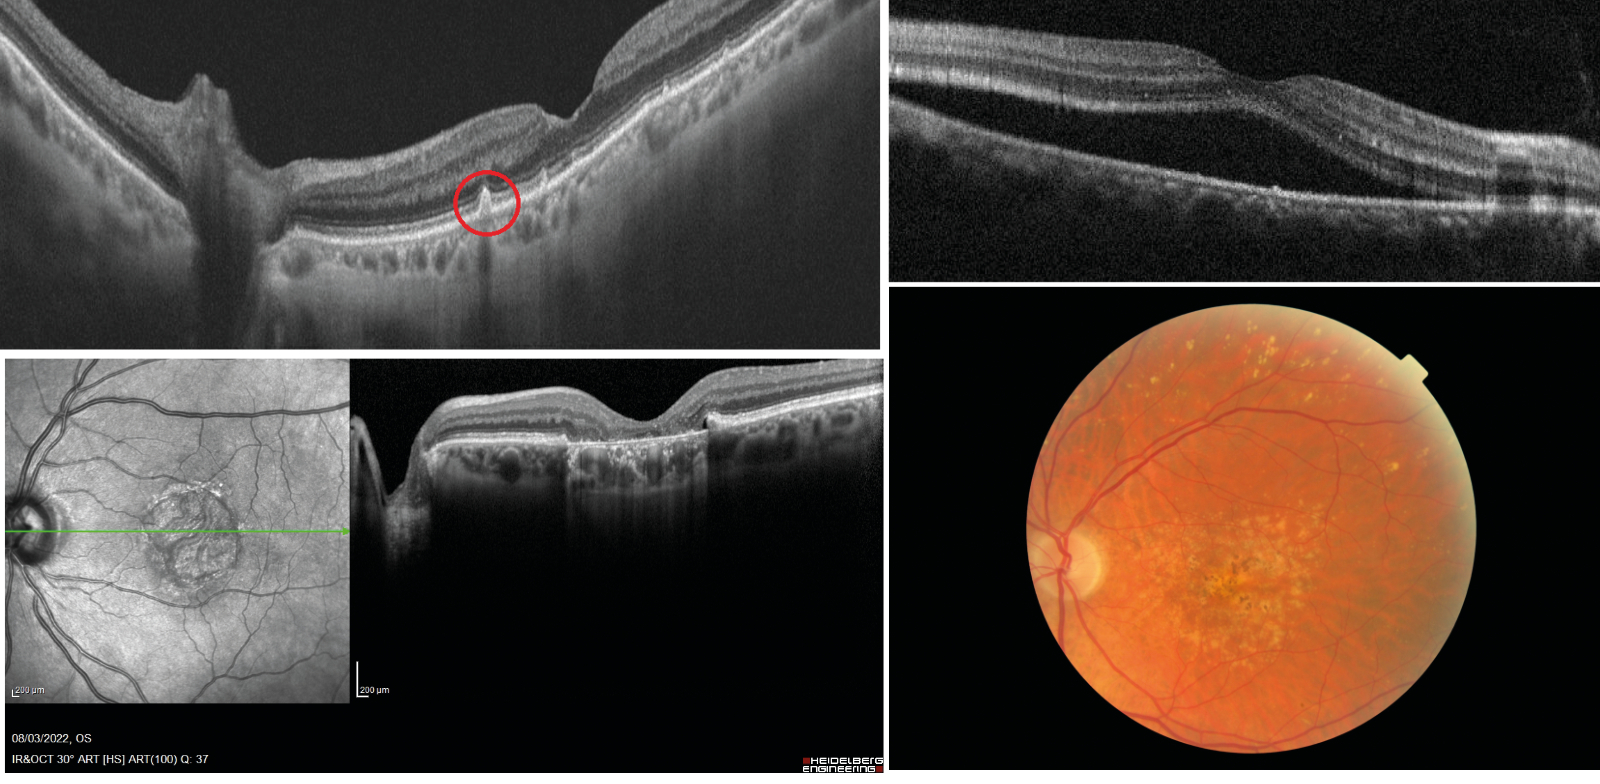
Age-related drusen, however, are biochemically distinct from drusen associated with AMD.12 Large, confluent, or soft drusen are more likely to be a marker of age-related macular degeneration than normal aging. Soft or large drusen may occur with the development of localised detachments of basal laminar or basal linear deposits, which represent granular material accumulating between either the RPE and its basement membrane or external to the RPE’s basement membrane, respectively.13 These localised detachments are often termed drusenoid RPE detachments, as shown in figure 3.
Figure 3, 4, 5 & 6 (clockwise): Drusenoid RPE detachment as seen on OCT; Serous detachment of the RPE on OCT; AMD showing soft drusen, localised hypopigmented areas of atrophy with associated pigmentary migration
As will be discussed later, the appearance and nature of drusen are characteristic of AMD and help in its classification.
As AMD progresses, other changes include the following:
- Serous detachments of the RPE appear as well-demarcated, abrupt elevations of the RPE with a homogenously hypo-reflective sub-RPE space (figure 4)
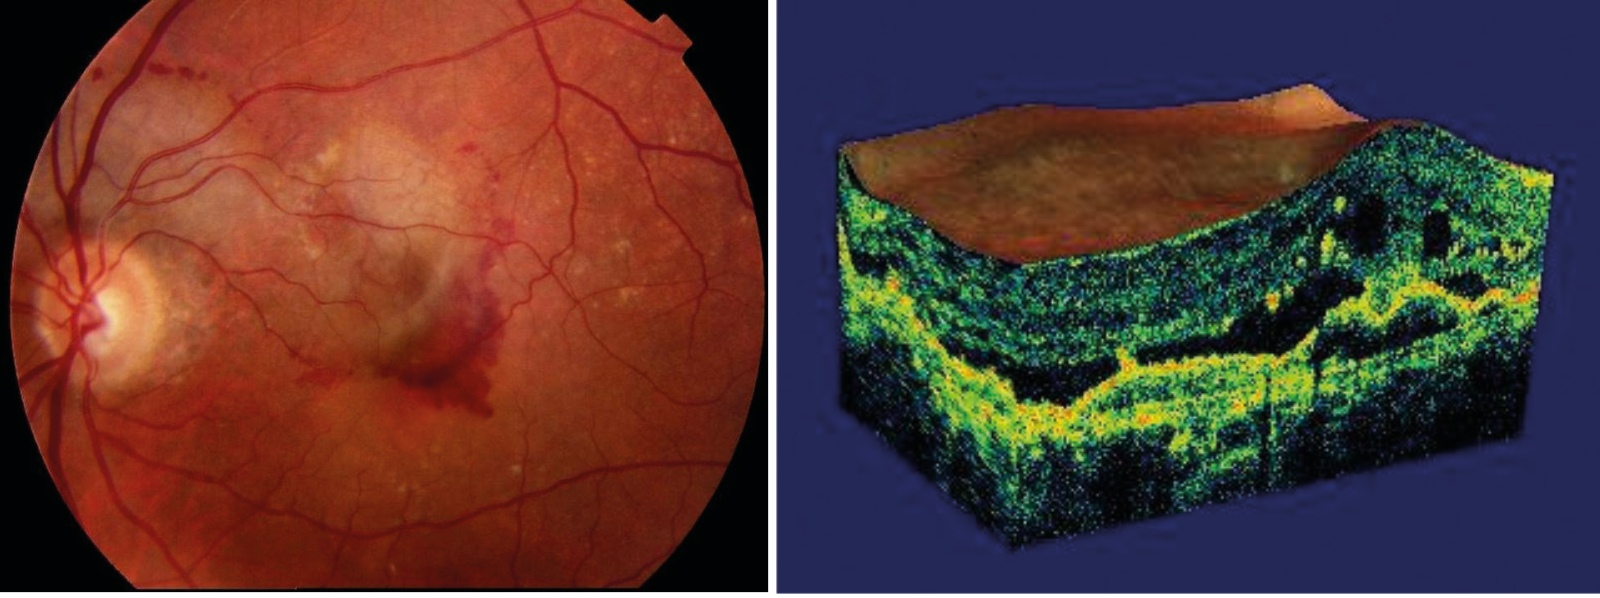
- RPE atrophy progresses and may be associated with depigmentation, migration and proliferation of RPE cells into the photoreceptor layer (figure 5). With progression, RPE degeneration is seen, with loss of adjacent photoreceptors, and juxtaposition of Bruch’s membrane to the inner nuclear layer. Extensive atrophy is usually described as geographic (figure 6)
- Sub-RPE neovascularisation, induced by the increased stimulus of vascular endothelial growth factor secreted as a response to ischaemia and hypoxia in the degenerating retinal tissues, extends within Bruch’s membrane, typically between the thickened inner aspect of Bruch’s membrane and the rest of Bruch’s membrane. A sub-RPE neovascular membrane can extend sub-retinally in areas where Bruch’s membrane is not intact. With discontinuities in Bruch’s membrane, capillary-like choroidal vessels can form a subretinal RPE vascular complex that may lead to serous or haemorrhagic detachment of the neurosensory retina (figure 7)
- Fibrous, disciform scars result from sub-RPE neovascularisation with fibrous tissue developing within Bruch’s membrane or between the RPE and retina. Overlying retina may develop cystic changes and photoreceptor loss (figure 8)
Figure 7 & 8: Sub-retinal haemorrhage; Cystic changes in retina overlying disciform scarring
Clinical Assessment
Over the past two decades, there has been significant developments in new technology that has helped clinicians assess macular changes far more accurately and so benefited patient management. While the use of some of these (retinal imaging and OCT) are standard practice now, others (OCT-angiography, fundus autofluorescence, dark adaptation) are less widespread and will be discussed later.
Despite these advances, however, the initial approach to assessing the macula patient invariably begins with a detailed history and symptoms, assessment of visual function (typically with an acuity chart and/or Amsler grid), and slit-lamp binocular indirect ophthalmoscopy.
History and symptoms
As with all patients being assessed for any eye disease, a detailed history and symptoms is essential. This will help to establish the likelihood of a patient presenting with age-related macular degeneration, whether they have any related symptoms or not and, for those with symptoms, help to define whether they are related to AMD.
History
Part 1 in this series (see Optician 25.11.22) offered a detailed discussion of the risk factors for AMD. The following key non-modifiable risks need to be established:
- Age: the prevalence of advanced AMD is approximately 5% in those aged over 65 years, but rises to approximately 12% of those aged 80 years or more14
- Family history: a family history of AMD is associated with a 12-fold or greater increase in the odds of developing the disease15
- Ethnicity: white people of European descent are at an increased risk of advanced AMD compared to other ethnic groups
Modifiable, lifestyle factors that need to be identified include:
- Smoking
- Short wavelength light exposure
- Cataract surgery
- High body mass index (30 kg/m2 or more)
- Cardiovascular disease and hypertension16
- Diet low in omega-3 and 6, vitamins, carotenoids and minerals and high in saturated fats17
- Lack of exercise17
Symptoms
- Loss of acuity: this may be slow and progressive with dry AMD and therefore not noticed by the patient. A sudden loss of acuity is more likely related to a vascular, wet AMD event. It is also worth noting that, where there is a fall in acuity, there should be no improvement or even a further reduction when presented with a pinhole if the sight loss is primarily linked with maculopathy
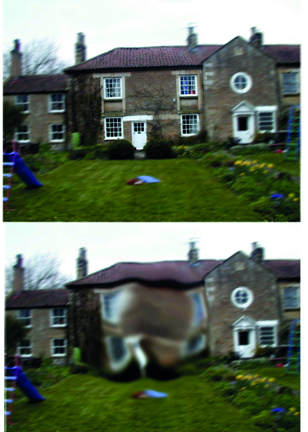
- Distortion: as with acuity, rapidity of onset needs to be established (figure 9)
- Poor photostress recovery; persistent after-images after flash photography or reduced adaptation to scotopic ambient conditions may sometimes be linked with early maculopathy
Figure 9: Representation of sudden onset distortion
While this article is focusing on visual symptoms, it is always worth remembering that, with established AMD, the impact of the sight loss may have much wider implications. There is a well-established link between loss of central acuity and depression, for example. Also, it is becoming increasingly obvious that the numbers of patients suffering from Charles Bonnett syndrome hallucinations with sight loss is much higher than was once thought to be the case.
Visual function - Visual acuity
The assessment of visual acuity is necessary, though it is important to remember that, in isolation, it is often a poor predictor of the extent of maculopathy. Though the atrophy of retinal tissue in the macular region would be expected to cause acuity loss, this can be variable. As well as the inherent variability in subjective blur sensitivity and adaptation between patients and dependent upon speed of degeneration, the location of the atrophy relative to the fovea may vary as might the patient’s adoption of eccentric viewing at low acuity levels.
That said, the visual acuity is integral to any management [plan for visual assistance, along with contrast sensitivity assessment, and is also a requirement for decisions about suitability for certification for sight impairment and severe sight impairment registration.
Central fields
Though the poor sensitivity of the Amsler grid is well known,18 and many patients struggle to relate their visual change to the recording sheet, the simplicity and low cost of the grid and the ease with which it can be taken away for use at home by a patient means that it is still a mainstay of macular monitoring to this day. Attempts to improve sensitivity and issues of better representational recording include the development of electronic charts (figure 10).
Figure 10: Amsler grid. (a) The basic grid recording sheet; (b) cross-hairs aids fixation for those with maculopathy; (c) poor labelling and inaccurate representation of vision change contribute to poor sensitivity off the test; (d) patients may struggle to represent scotoma (red outline) or distortion (blue outline); (e) digital Amsler displays on tablets allow for corrections, data storage and changes to grid pattern and colour; (e) the M-chart was an attempt to quantify central vision loss
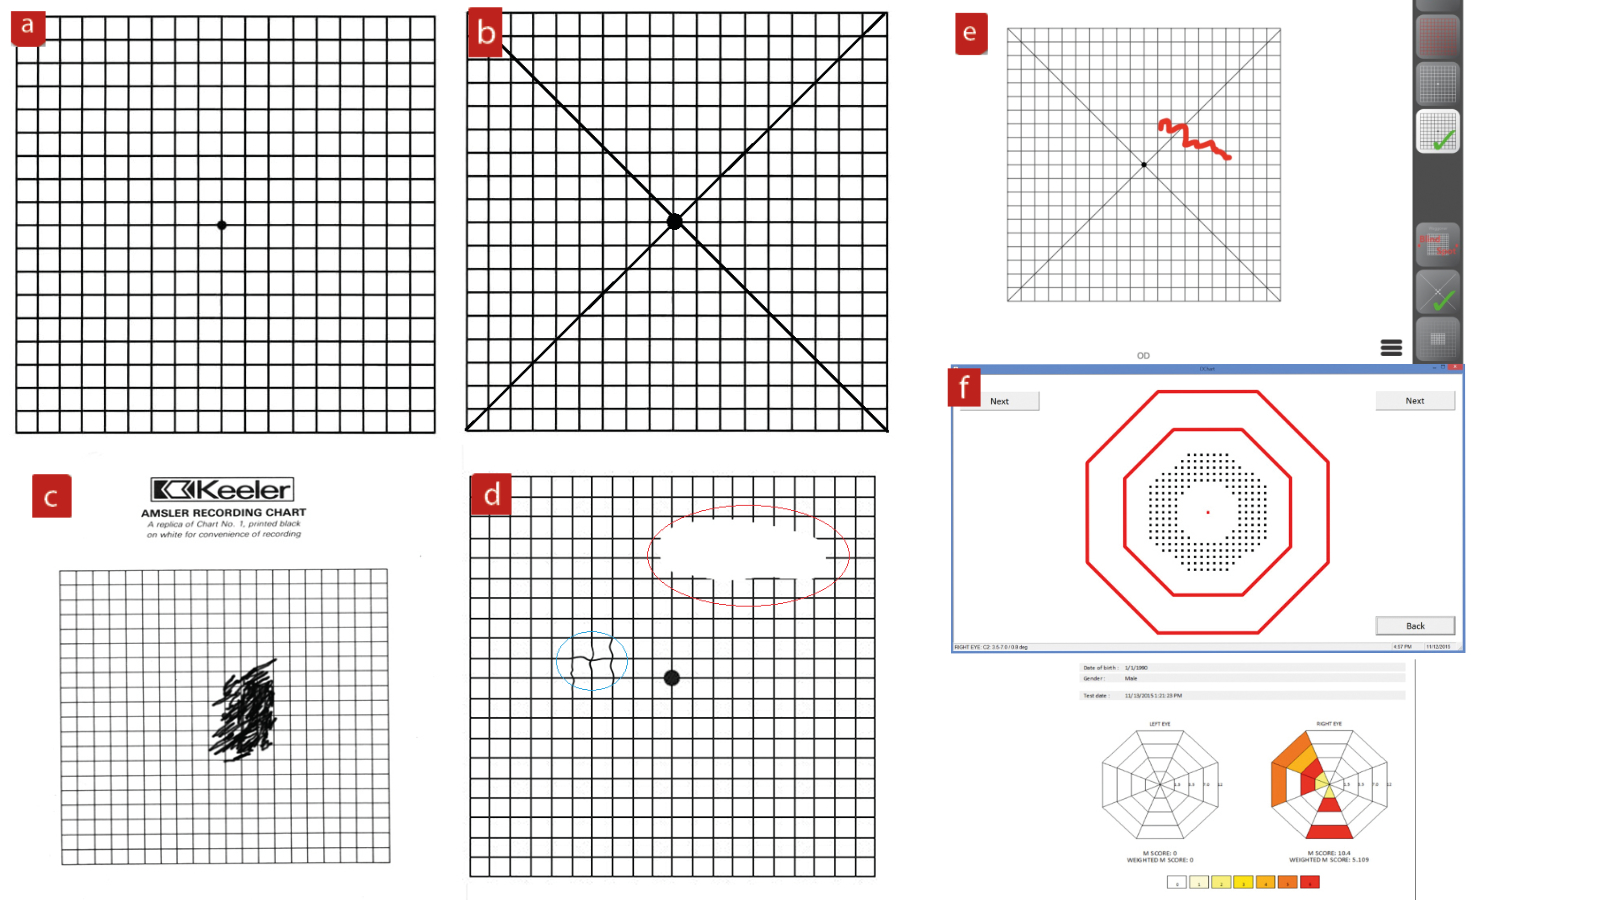
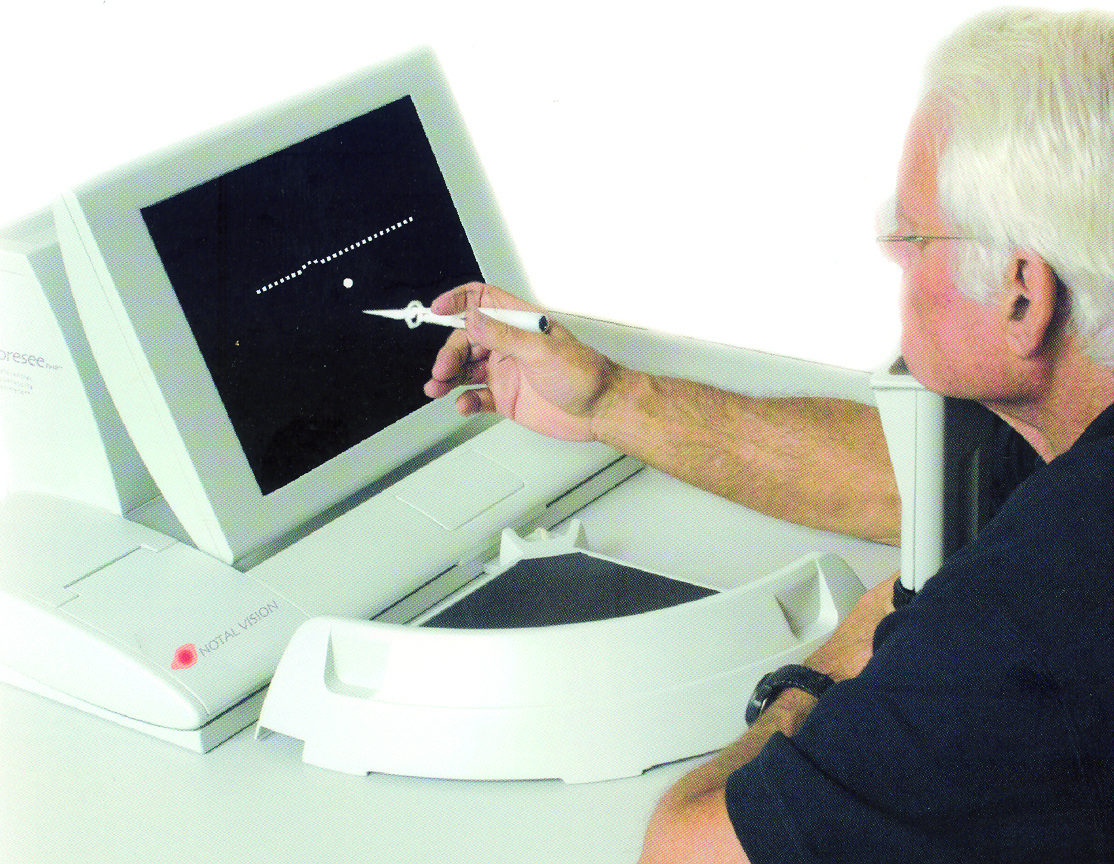
Another attempt at improving the sensitivity of detection of the onset of central distortion was the preferential hyperacuity perimeter, which required the patient to detect deviations in the path of lines of different sizes (figure 11). Possibly due to expense, the test has never really taken off.
Figure 11: A preferential hyperacuity perimeter
Fundus assessment
A view of the fundus, either live or captured, is essential in order to record the extent of any degeneration and therefore be able to classify the AMD.
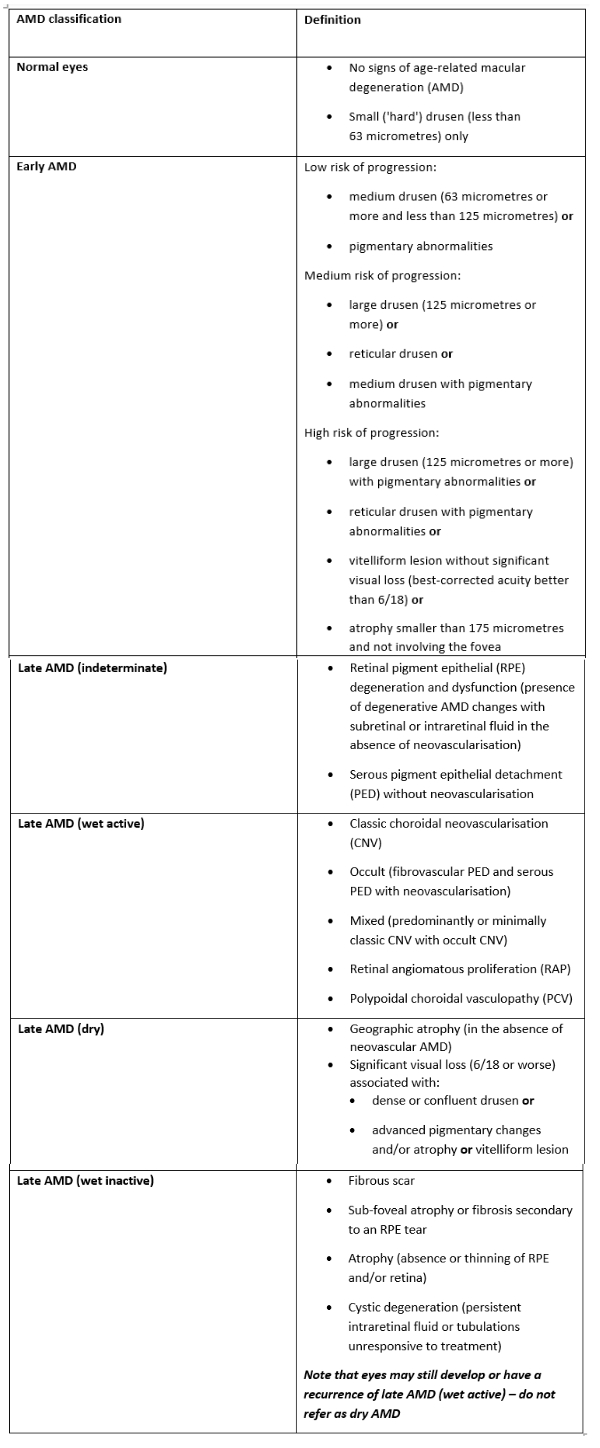
Traditionally, the progression of AMD has been described as ranging from normal aging, to early AMD, then to intermediate AMD; all based on the estimated size of drusen and the presence of pigmentary abnormalities. Eventually, advanced AMD is reached which was defined as geographic atrophy or neovascular. This classification is given, albeit in greater detail, in the 2018 NICE guidelines and shown here in table 1. As can be seen, key to assessing the extent of AMD is the identification of the nature of drusen.
Table 1: Classification of AMD by the NICE guideline 8217
For many years, fundus viewing relied upon slit-lamp binocular indirect ophthalmoscopy (slit-lamp BIO), supported by digital imaging. The rise of OCT and the evolution of wavelength specific imaging techniques have greatly enhanced the interpretation of macular appearance by clinicians.
Slit-lamp indirect biomicroscopy
The binocular view of the macular made possible by slit-lamp BIO, which allows assessment even in the presence of cataract. Dilation of the patient is always recommended for optimum viewing and the fundus viewing lens should offer the best magnification, assuming a reasonable pupil diameter is present. From table 2, it can be seen that a 60DS or Super66 viewing lens offers the best view of maculopathy.
Table 2: Properties of commonly used fundus viewing lenses
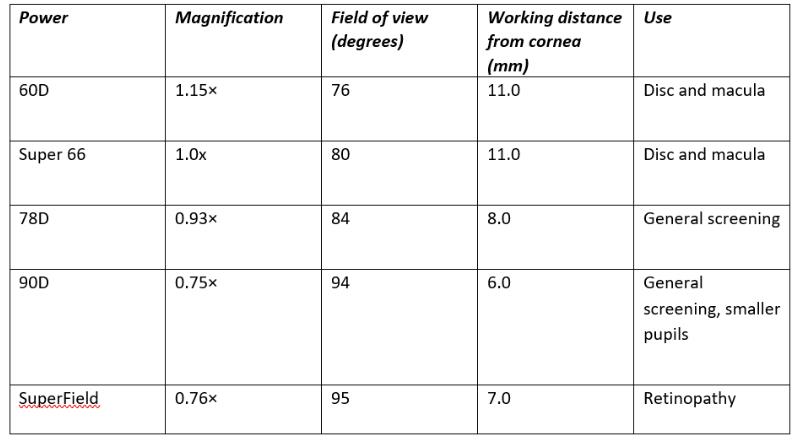
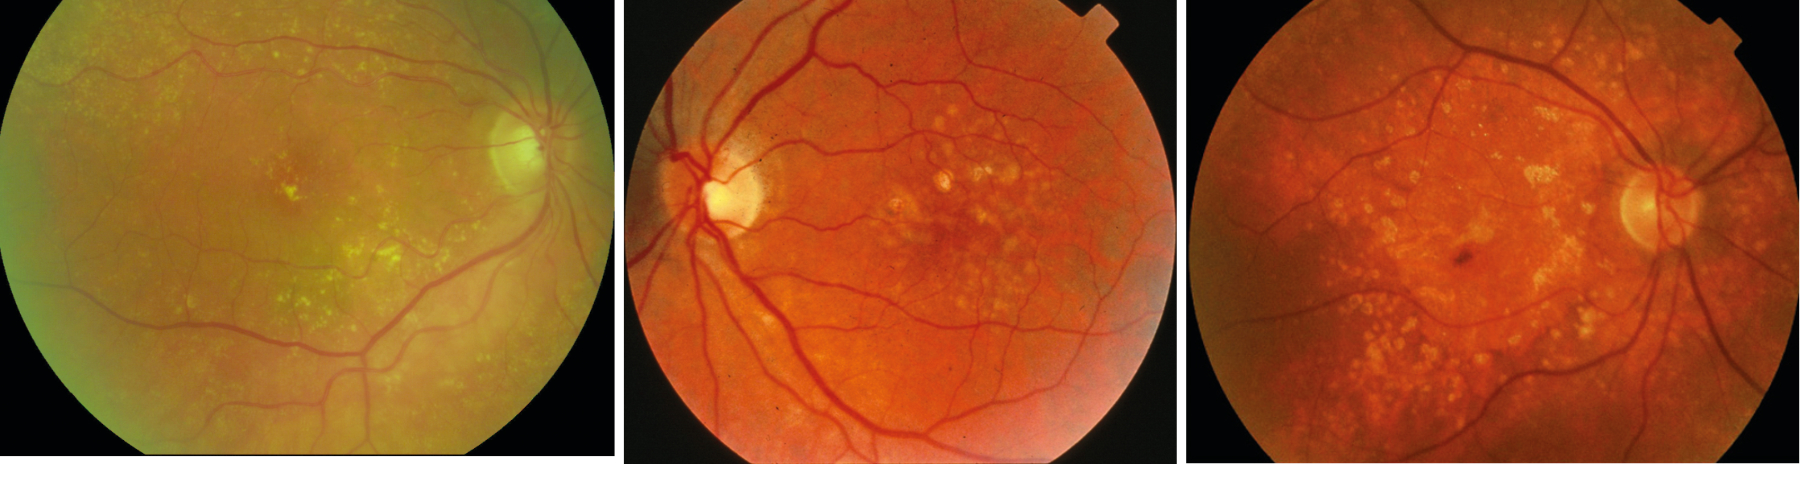
Figure 12 shows the presence of multiple, small discrete hard drusen, figure 13 shows larger, soft drusen and figure 14 shows the presence of longstanding drusen, which have a glistening appearance due to calcification.
Figure 12, 13 & 14 (left-right): Multiple, small discrete hard drusen; Larger, soft drusen; Longstanding drusen
OCT
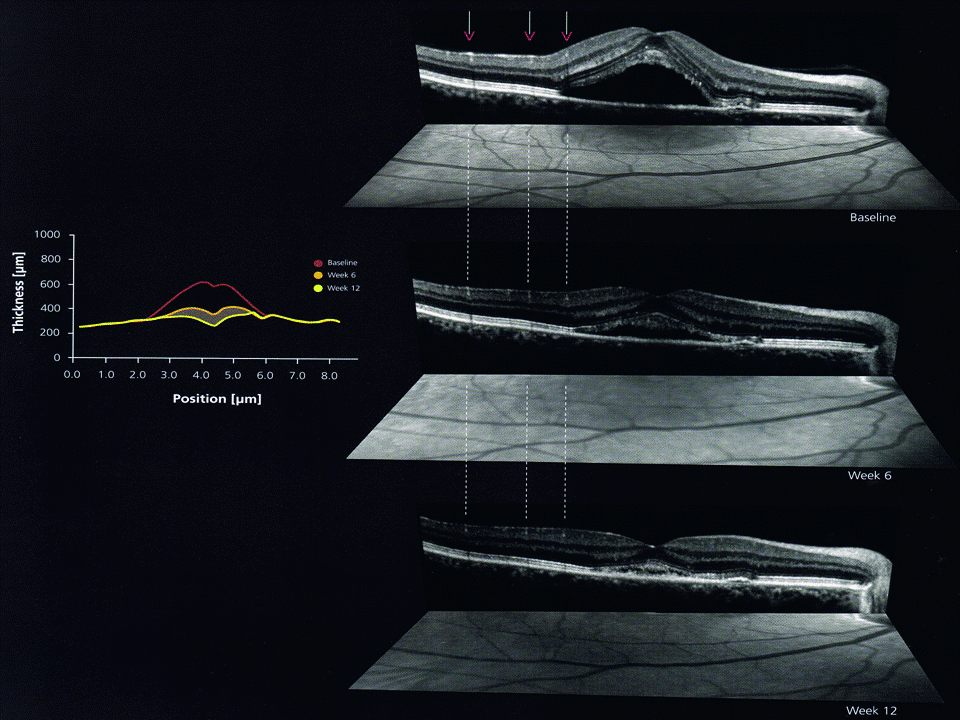
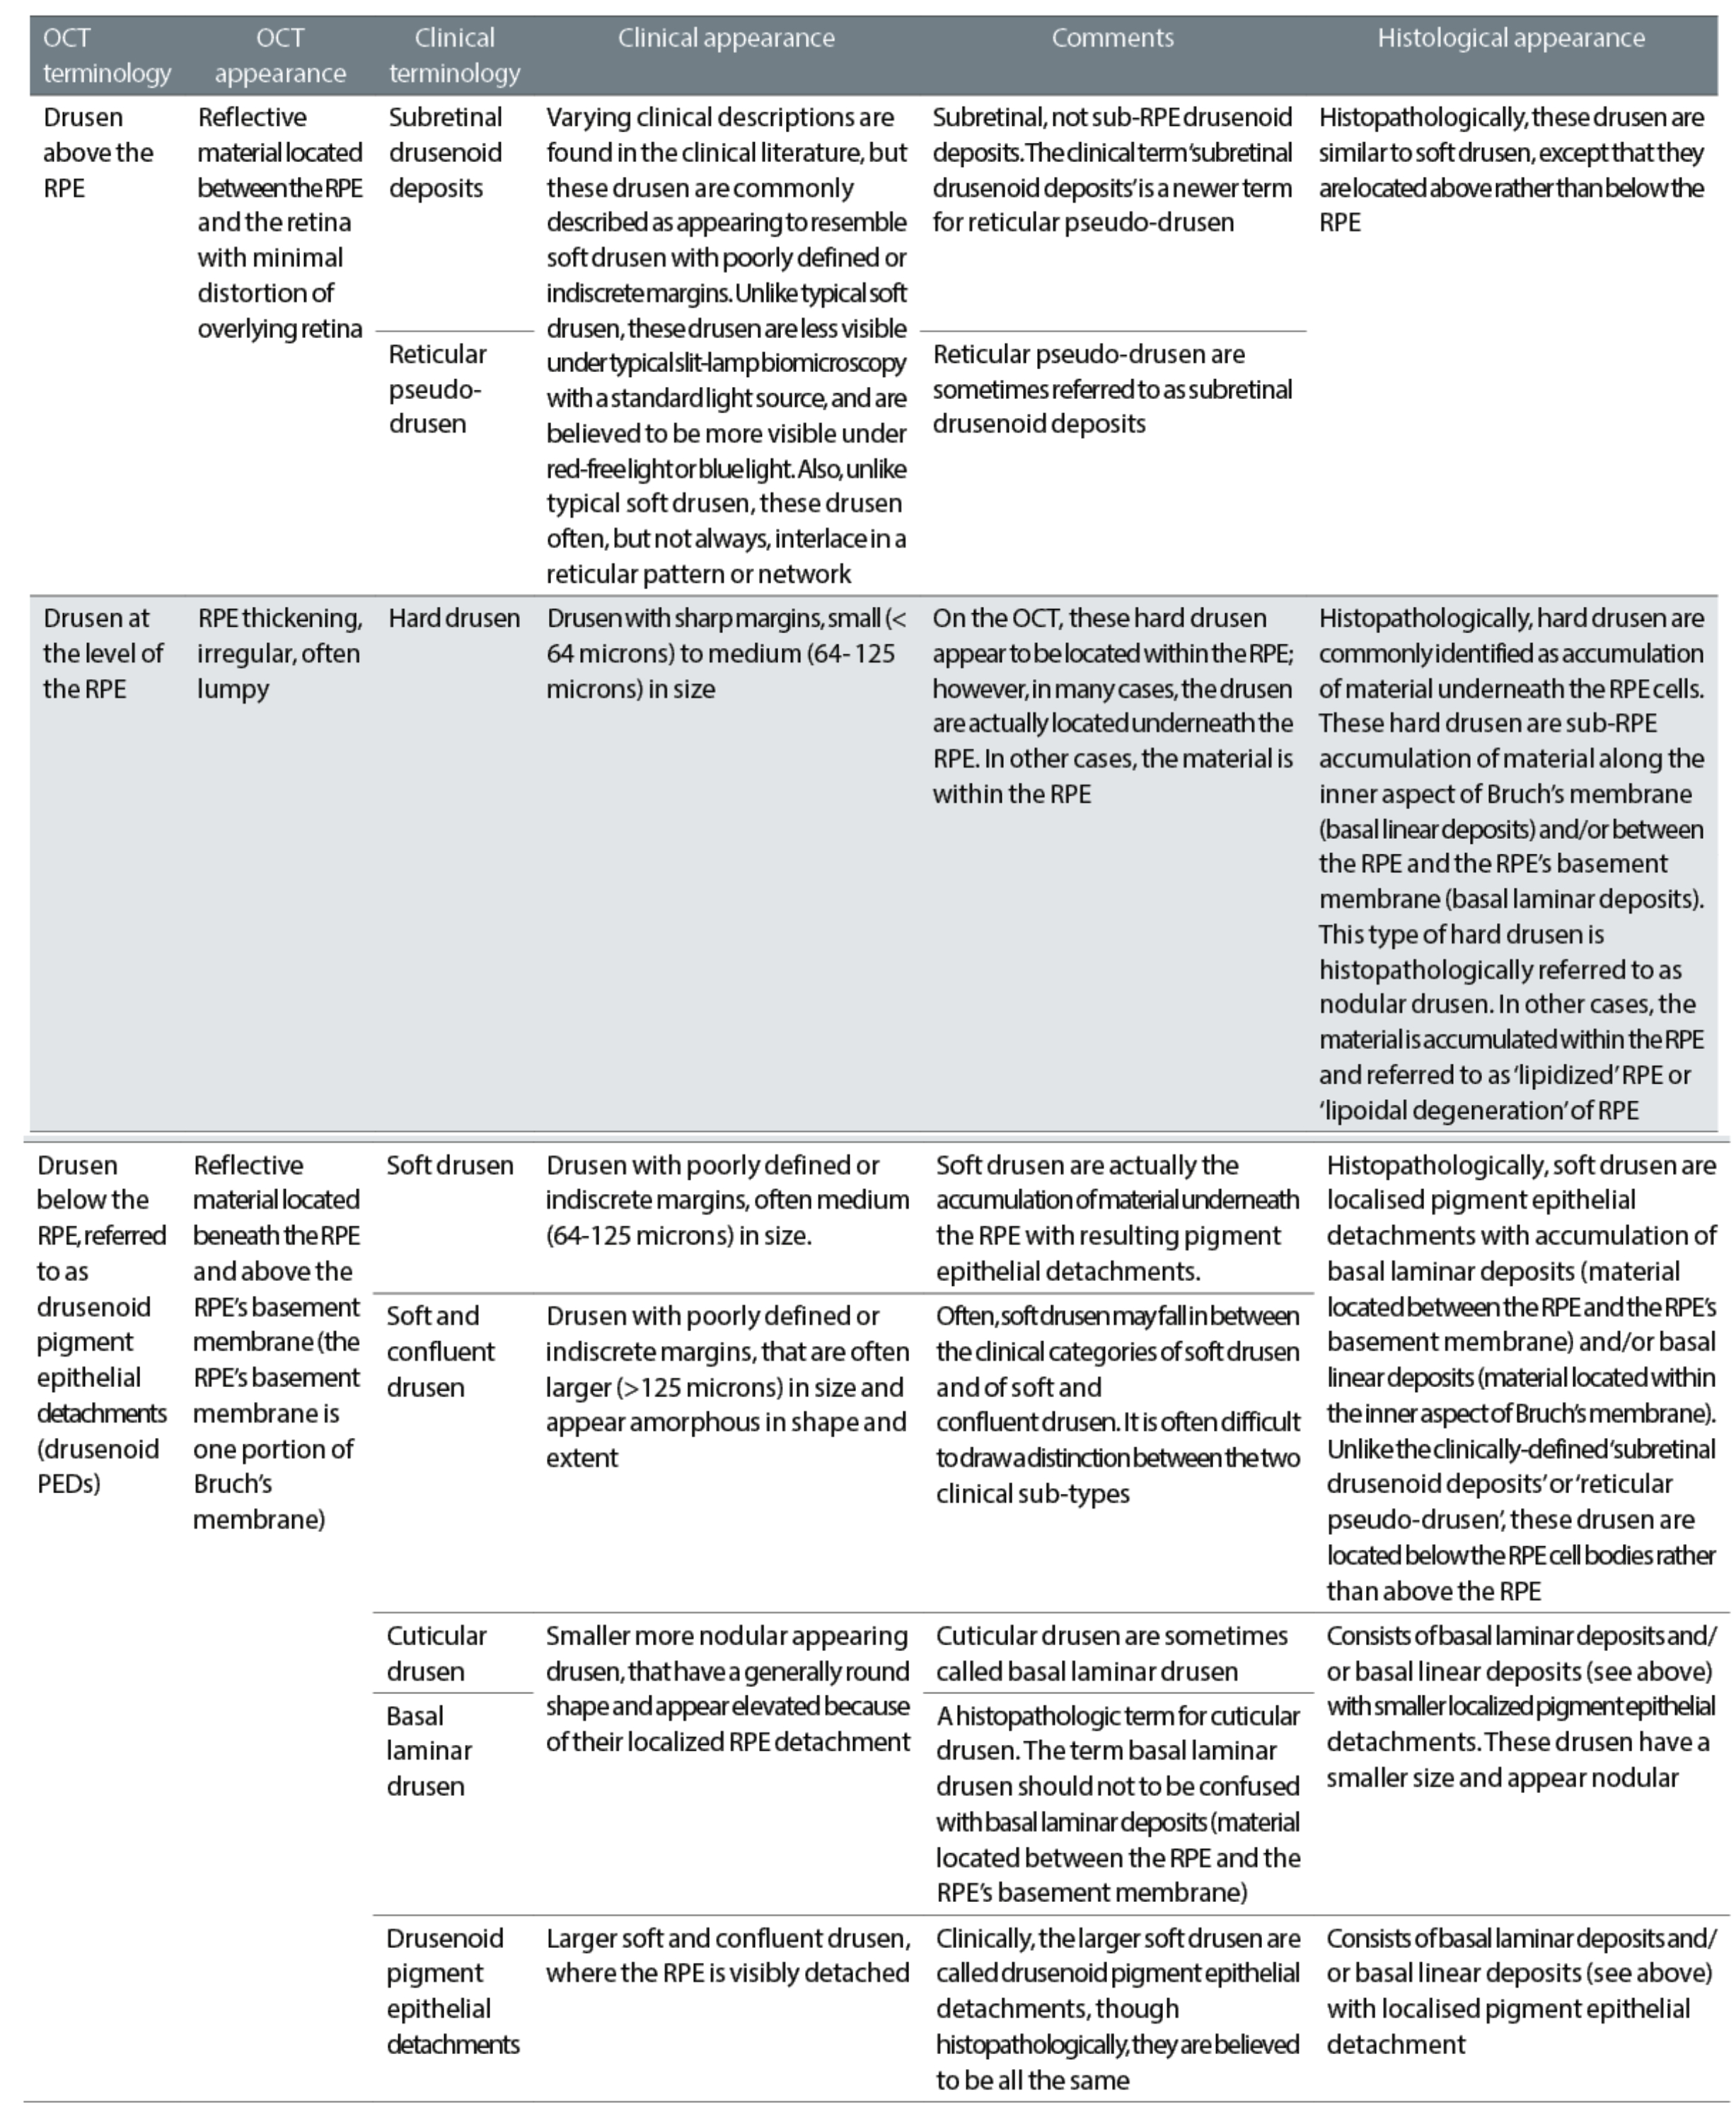
The advent of OCT has not only made it possible to view a cross-section of the retina, so allowing easy visualisation of retinal and RPE detachment and elevation (figure 15), but has also led to a much more detailed classification of drusen as shown in table 3.
Figure 15: Retinal and RPE detachment and elevation
Of particular note here are reticular drusen. Though mentioned in the NICE guidelines and found to be present in 24% of eyes and 29% of patients with AMD, reticular drusen are often ignored.20 Reticular drusen (also known as reticular pseudo-drusen, RPD, subretinal drusenoid deposits, or reticular macular disease) are more prevalent among the advanced age group, and are commonly bilateral and symmetrical and more common in females than males.21
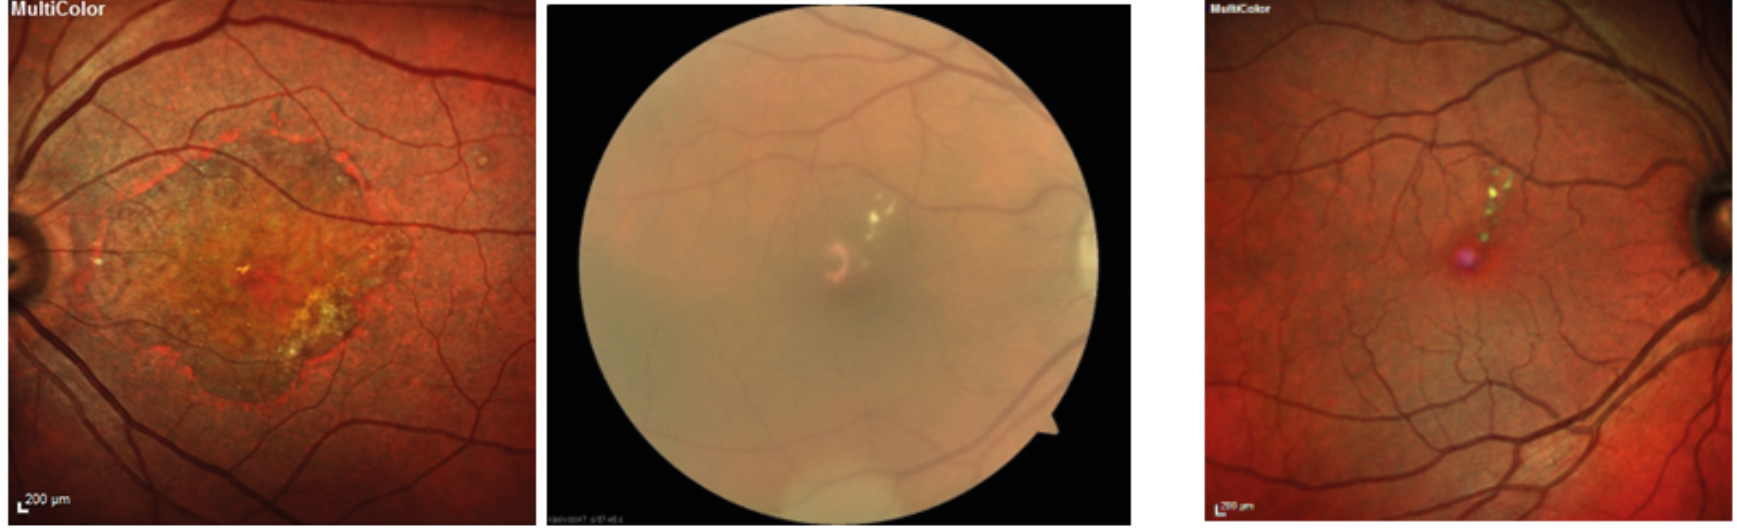
They appear as dot-like whitish-yellow sub-retinal structures in a cluster, which are usually connected in a reticular pattern and are more prominent on the blue light channel of a fundus photograph (figure 16).
Figure 16: Reticular drusen seen in: (a) separate colour channels; (b) blue peak autofluorescence; (c) multicolor. Images courtesy of Tim Cole, Clinical Affairs Manager, Heidelberg Engineering UK
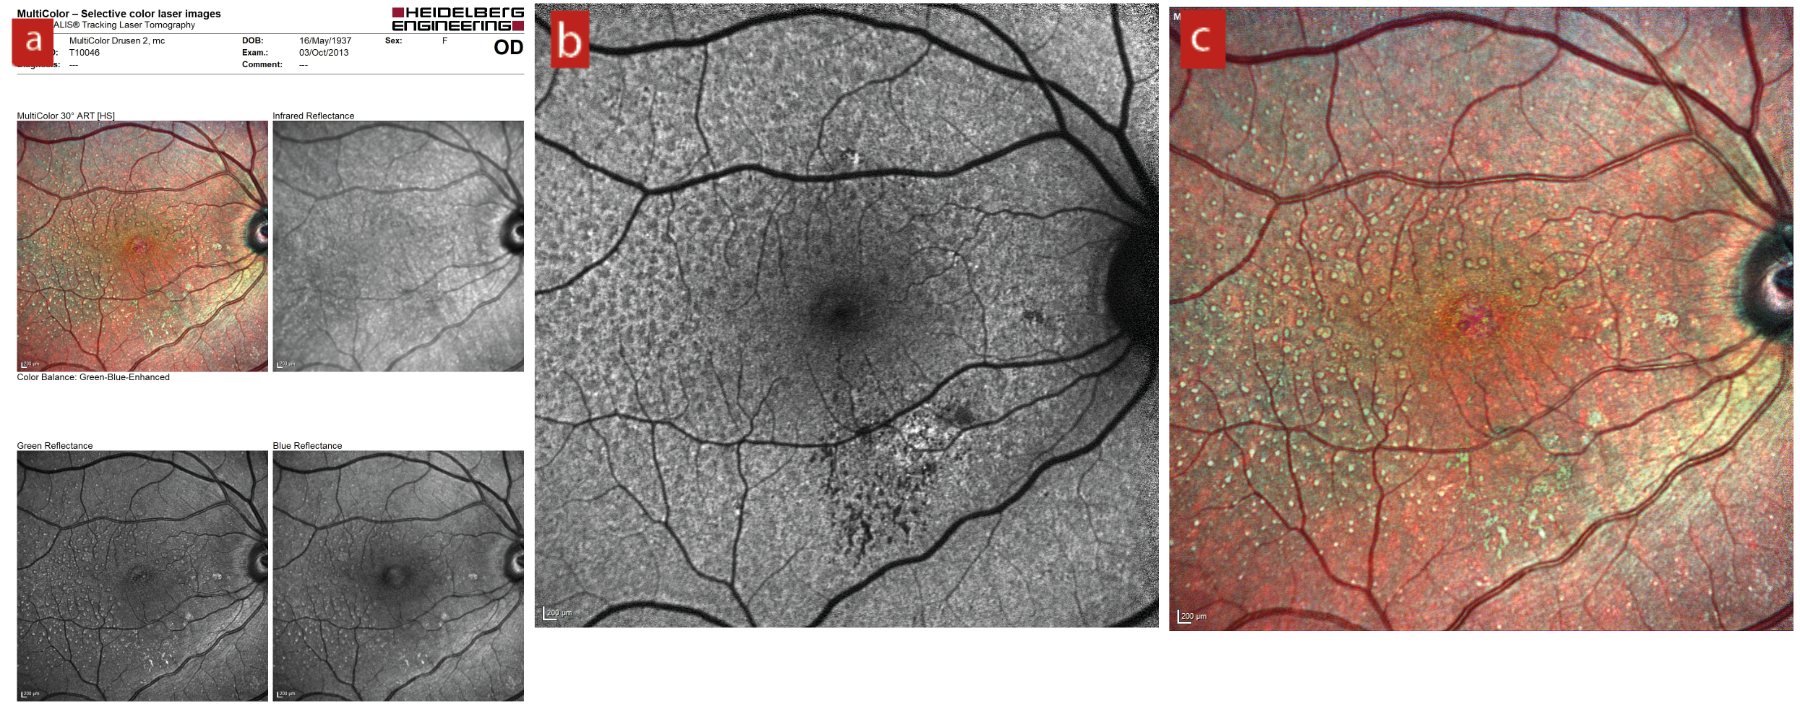
Table 3: Classification of drusen as viewed by OCT19
Multicolor Imaging
Scanning laser ophthalmoscopy systems use a collimated light beam focused on a retinal confocal plane and then the reflected image interpreted and constructed by a computer. This not only offers excellent sharpness of image (the technique limits the effect of backscattered light from deeper layers and provides enhanced image quality), but allows colour biased images (typically red, blue and green) to be constructed, which shift the reference plane under view either in front or behind the retina. A composite image may then be constructed from the individual confocal colour images and these multicolour images offer significantly greater detail (figure 17), even in the presence of significant media opacification (figure 18).
Figure 17 & 18 (left-right): Geographic atrophy seen with multicolor imaging; Scanning laser ophthalmoscopy multicolor imaging offers a much better retinal view (right) than standard digital photography (left) when cataract is present;
Other Instrumentation
Macular pigment measurement
Macular pigment (MP) is a yellow pigment concentrated around the macular region of the retina in a thin band in front of the central photoreceptors. MP is composed of the xanthophyll carotenoids lutein (L), zeaxanthin (Z), and meso-zeaxanthin, the first two of which are full derived from the diet. MP appears to have an anti-oxidative effect and so helps limit the processes that over time would degrade retinal tissue. MP also helps filter out short wavelength visible and longer wavelength UV light, which might otherwise damage retinal tissues through a photo-oxidative effect.
There is a general consensus and also extensive evidence to suggest a link between reduced levels of MP and increased risk of AMD.22 MP levels have also been linked with aspects of visual function, such as dark adaptation and contrast sensitivity. It is not surprising, therefore, that clinicians have sought to measure MP as a way of indicated retina and macular integrity and also monitoring the impact of any intervention, such as MP supplementation.
The majority of practice-based tests have incorporated a subjective testing strategy, which uses the patient’s ability to detect a flickering blue target to correlate with MP optical density (MOPD). Objective tests do exist, and the more commonly found are an adapted form of imaging with a blue light source to look for absorption of light by the MP, the latter often employing use of software run on an OCT or a scanning laser ophthalmoscope with autofluorescence capability.
Despite a solid theoretical underpinning, MP testing still proves somewhat controversial with disagreement over repeatability, accuracy and relevance. That said, most would argue some value in MP testing as exemplified by this concluding remark from a study published this year: ‘While further investigation is warranted, this finding should prompt clinicians to consider MPOD evaluation in healthy patients with specific complaints.’
Figure 19: A skin carotenoid sensor

Recently, there has been some claims made about a correlation between skin carotenoid levels, serum and macular carotenoid levels, opening up the possibility for the clinician to establish a baseline reading and future monitoring as needed. Indeed, some are now looking at the use of skin carotenoid sensor instruments (figure 19).
Autofluorescence
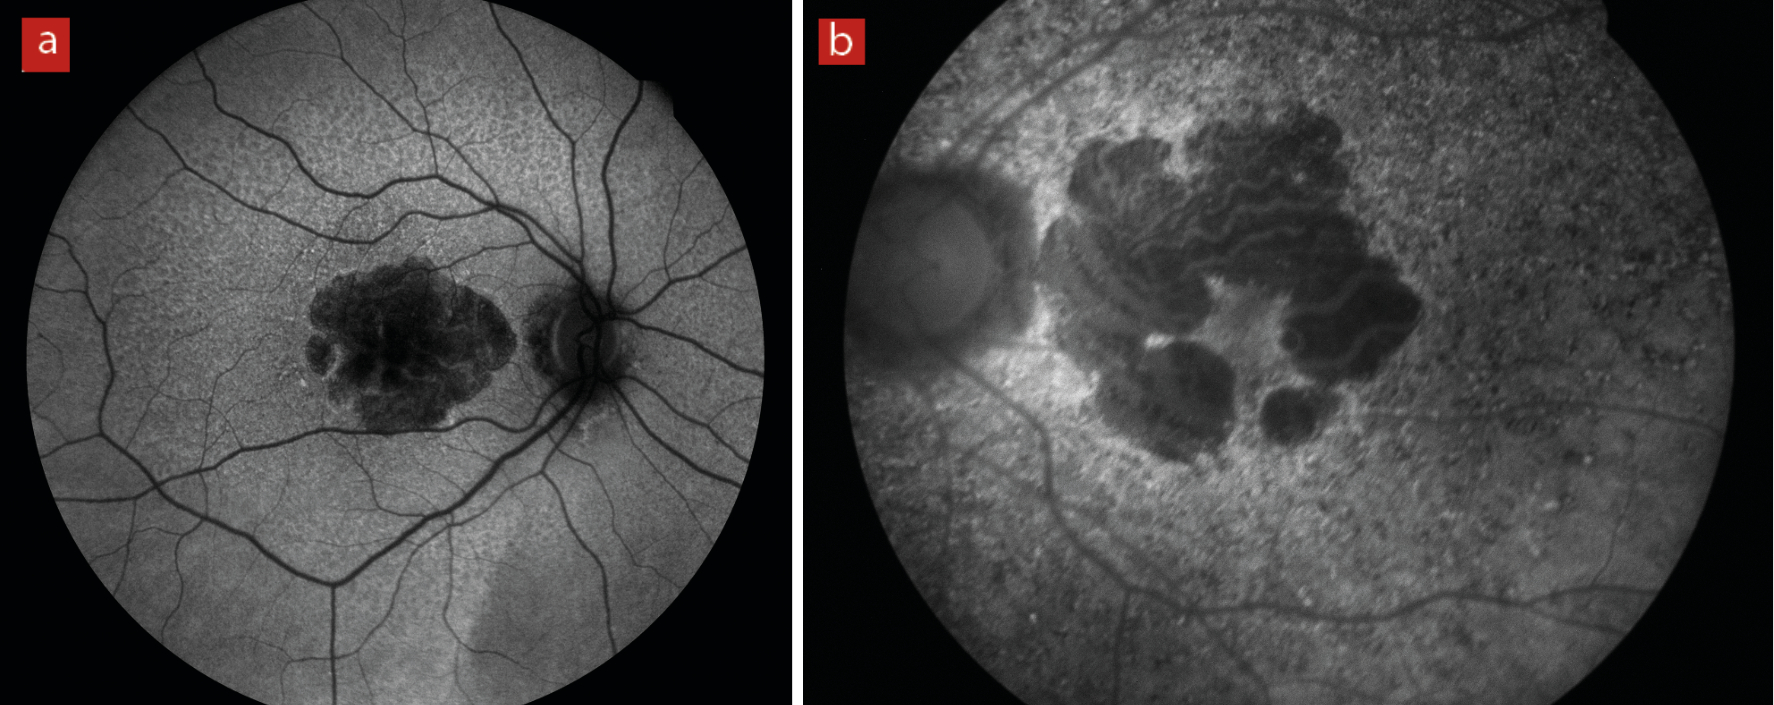
The natural emission of light by biological structures, subsequent to the absorption of light is termed autofluorescence. Some organelles, specialist subunits within cells with their own specific function, such as lysosomes possess this characteristic. For retinal assessment this is helpful as it is known that an indicator of inflammatory response, lipofuscin, will fluoresce and indicate an active disease process (figure 20).
Figure 20: (a) longstanding geographic atrophy where the diseased atrophic tissue appears black or hypofluorescent. (b) areas of light, hyperfluorescence outside the margins of a geographic atrophy imply further inflammatory process and expected future tissue damage
Dark adaptometry
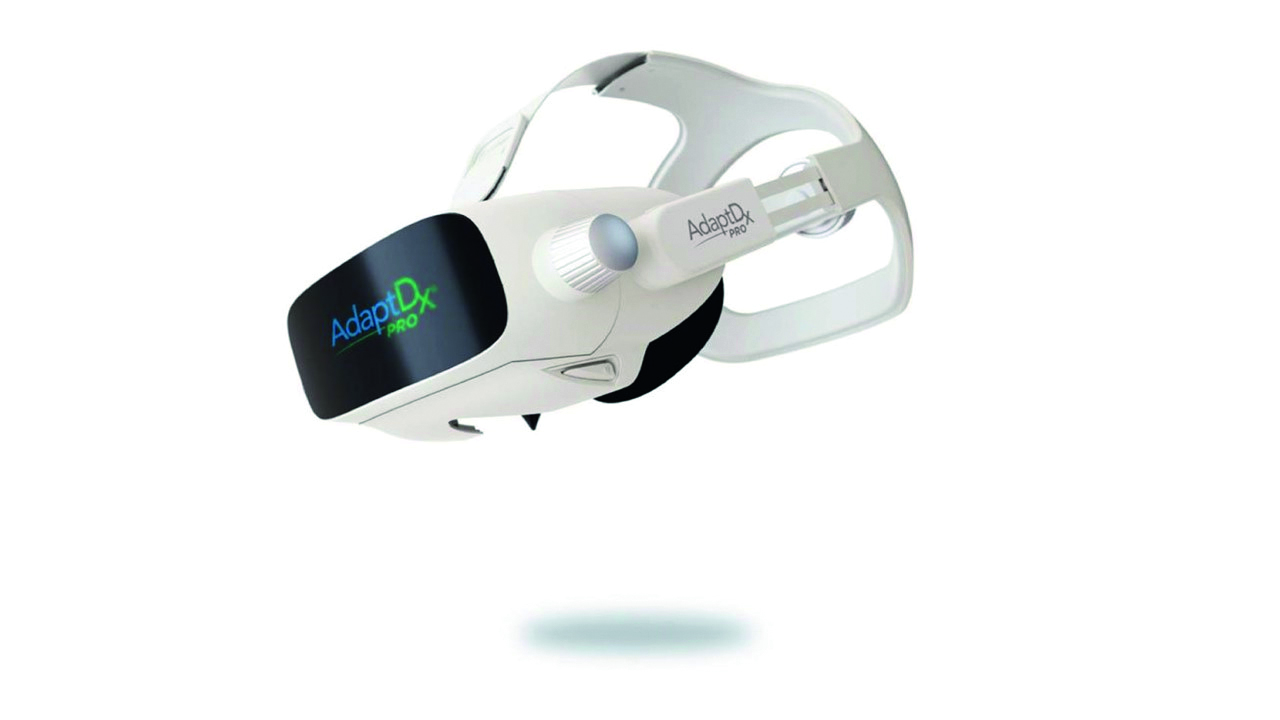
As explained in detail in Optician 26.03.21, dark adaptometry (DA) has the potential to detect functional effects that are subclinical and aid in predicting patients at risk of developing AMD. DA instruments allow more rapid testing by incorporating different protocols, such as reduced bleaching intensity and by applying the stimulus to the area of greatest rod dysfunction. Such instruments include the RapiDA, the AdaptDx and, most recently, the AdaptDx-Pro (figure 21). The latter two devices, both from Maculogix, offer screenings in less than seven minutes and allow for more practical use clinically. With a sensitivity and specificity of over 90%, the AdaptDx-Pro offers greater insight into the AMD status of patients.
Figure 21: The AdaptDx-Pro (from Maculogix)
The next article in this series will focus on referral and management of AMD.
- Dr Rohit Narayan is a therapeutic optometrist with a specialist interest in holistic optometry.
References
- Chua J et al. Age-related changes of individual macular retinal layers among Asians. Scientific Reports, 2019, 9(1), pp.1-11
- Klein R et al. The relationship of age-related maculopathy, cataract, and glaucoma to visual acuity. Investigative Ophthalmology & Visual Science, 1995, 36(1), pp.182-191
- Jackson GR et al. Photoreceptor degeneration and dysfunction in aging and age-related maculopathy. Ageing Research Reviews, 2002, 1(3), pp.381-396
- Curcio CA et al. Human photoreceptor topography. Journal of Comparative Neurology, 1990, 292(4), pp.497-523
- Coleman, HR et al. Age-related macular degeneration. The Lancet, 2008, 372 (9652), pp.1835-1845
- Rozing MP et al. Age-related macular degeneration: A two-level model hypothesis. Progress in Retinal and Eye Research, 2020 May;76:100825
- Chen M et al. Para-inflammation, chronic inflammation, and age-related macular degeneration. Journal of Leukocyte Biology, 2015, 98(5), pp.713-725
- Anderson et al. The pivotal role of the complement system in aging and age-related macular degeneration: hypothesis re-visited. Progress in retinal and eye research, 2010, 29(2), pp.95-112
- Park DH et al. The challenges and promise of complement therapeutics for ocular diseases. Frontiers in Immunology, 2019, 10, p.1007
- Wu J et al. Complement system and age-related macular degeneration: drugs and challenges. Drug Design, Development and Therapy. 2019 Jul 19; 13: 2413-2425
- Zarbin MA. Current concepts in the pathogenesis of age-related macular degeneration. Archives of Ophthalmology, 2004, 122:598-614
- Crabb JW et al. Drusen proteome analysis: an approach to the etiology of age-related macular degeneration. Proceedings of the National Academy of Science (USA), 2002; 99:3842-3847
- Green W.R. 1996. Ophthalmic Pathology, Volume 2, Chapter 9-Retina, pp 982-1047. W.B. Saunders Company
- Owen CG et al. The estimated prevalence and incidence of late stage age related macular degeneration in the UK. British Journal of Ophthalmology, 2012, 96, 752–6
- Shahid H et al. Age-related macular degeneration: the importance of family history as a risk factor. British Journal of Ophthalmology, 2012, 96, 427–31
- Binns A et al. Age-related macular degeneration: the optometrist’s role in detection and management. Optometry in Practice, 2014, Volume 15, Issue 4, 151 – 160
- NICE guideline [NG82]: 23 January 2018. Age-related macular degeneration. Available at: https://www.nice.org.uk/guidance/ng82/chapter/Recommendations#diagnosis-and-referral
- Crossland M et al. The Amsler chart: absence of evidence is not evidence of absence. British Journal of Ophthalmology, 2007, 91, 391–3
- Adams NA. Atlas of OCT: Retinal Anatomy in Health & Pathology. E-book available for download from: https://business-lounge.heidelbergengineering.com/gb/en/resources/ebooks/#octraining
- Cohen SY et al. Prevalence of reticular pseudo-drusen in age-related macular degeneration with newly diagnosed choroidal neovascularisation. British Journal of Ophthalmology, 2007 Mar;91(3):354-9
- Klein R et al. The epidemiology of retinal reticular drusen. American Journal of Ophthalmology, 2008 Feb;145(2):317-326
- Loane E et al. The rationale and evidence base for a protective role of macular pigment in age-related maculopathy. British Journal of Ophthalmology, 2008, 92, 1163–1168